Map (Insights) Tab
Map (Insights) helps you visualize a site using the latest uploaded site images, asset event locations and site zones.
Select assets and tags based on the selected date range. This shows different types of events and zones in different colors, clustered to aid in further understanding the site.
Click individual clusters to view asset, KPI and time stamp details.
-
Asset Tag: Select a single asset tag or multiple to view corresponding data Find all the asset tags available in that site in the drop-down list.

Select Grade & Compact to view combined data for both asset tags. -
Date Range: Select between Today, Yesterday, Last 7 days and Custom Range (up to 31 days).
Today is the default date range selection.
For Custom Range, select dates from the past 13 months and required time range. Refine your downloaded reports by selecting start and end times.
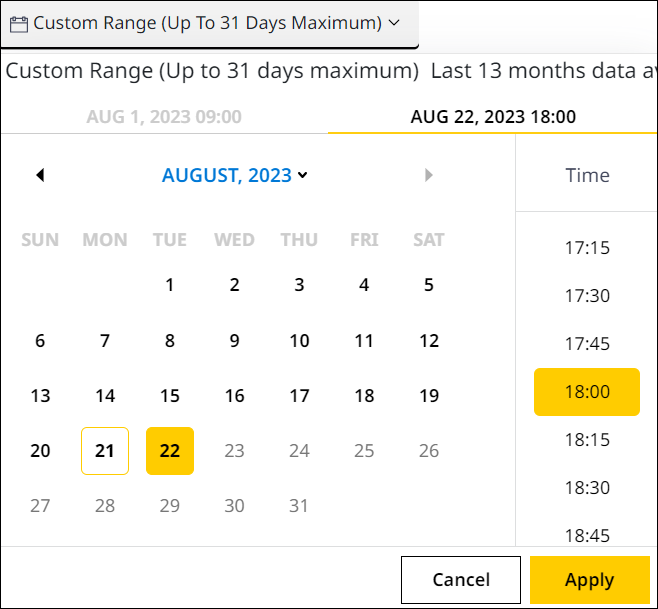

• The available custom date range is based on your local browser time zone and not individual sites. Select one day into the future of your local time zone if said date is available in a different time zone. Use this to view site data for a time zone ahead of yours.
• For sites with calibration (.cal) files, select Project Extents to load and view map data for Grade & Compact assets from site start date to current or (for archived sites) end date.
◦ For Grade and Compact asset tags, after updating a new calibration file, choose a date range that starts after the update date. Data before that date won’t be available.
View ImageView Image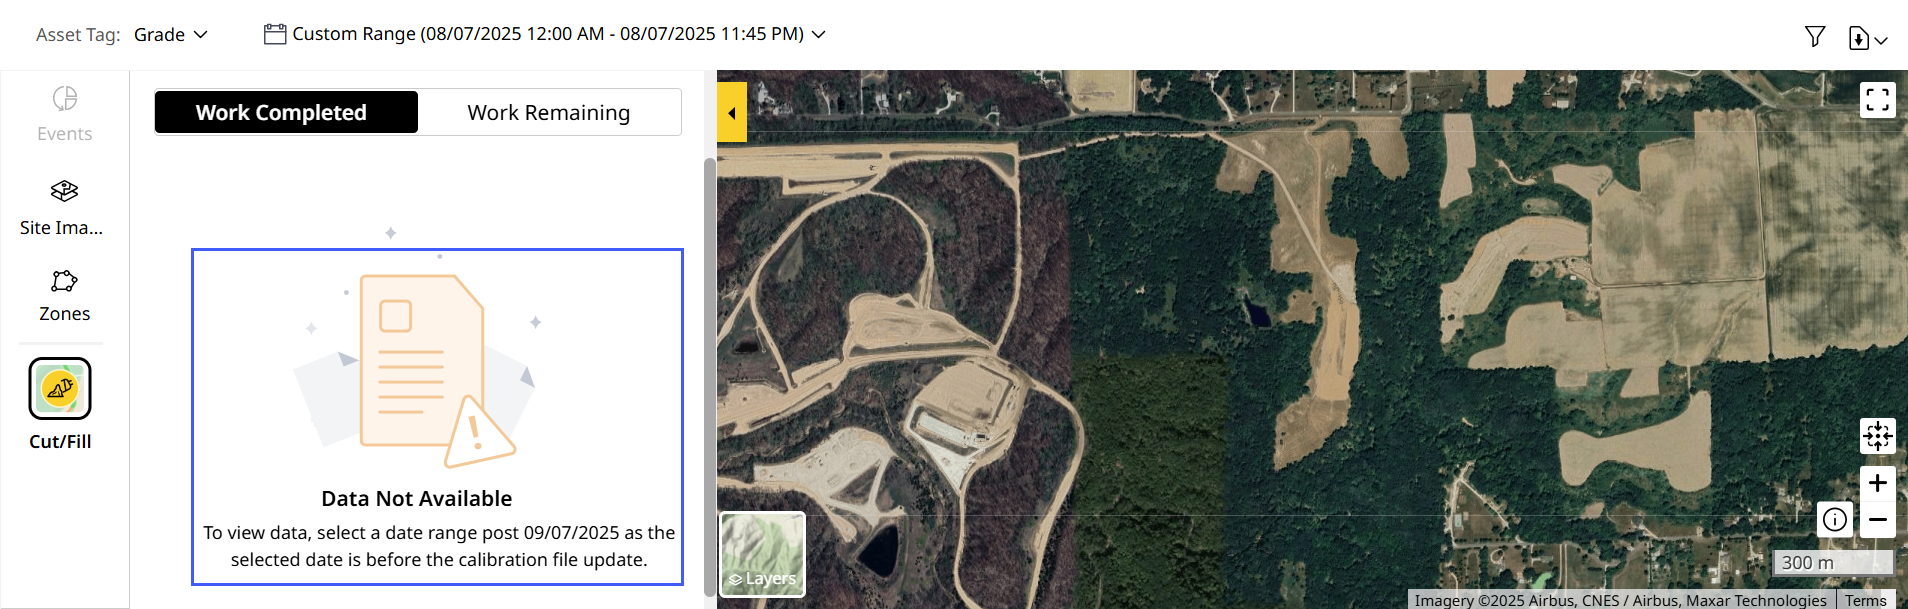
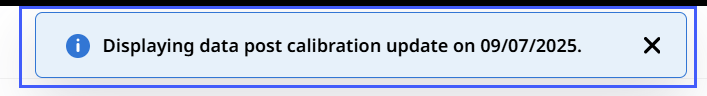
◦ If the selected date range includes dates before and after calibration file update, only the data after the file update will be available.
View ImageView Image
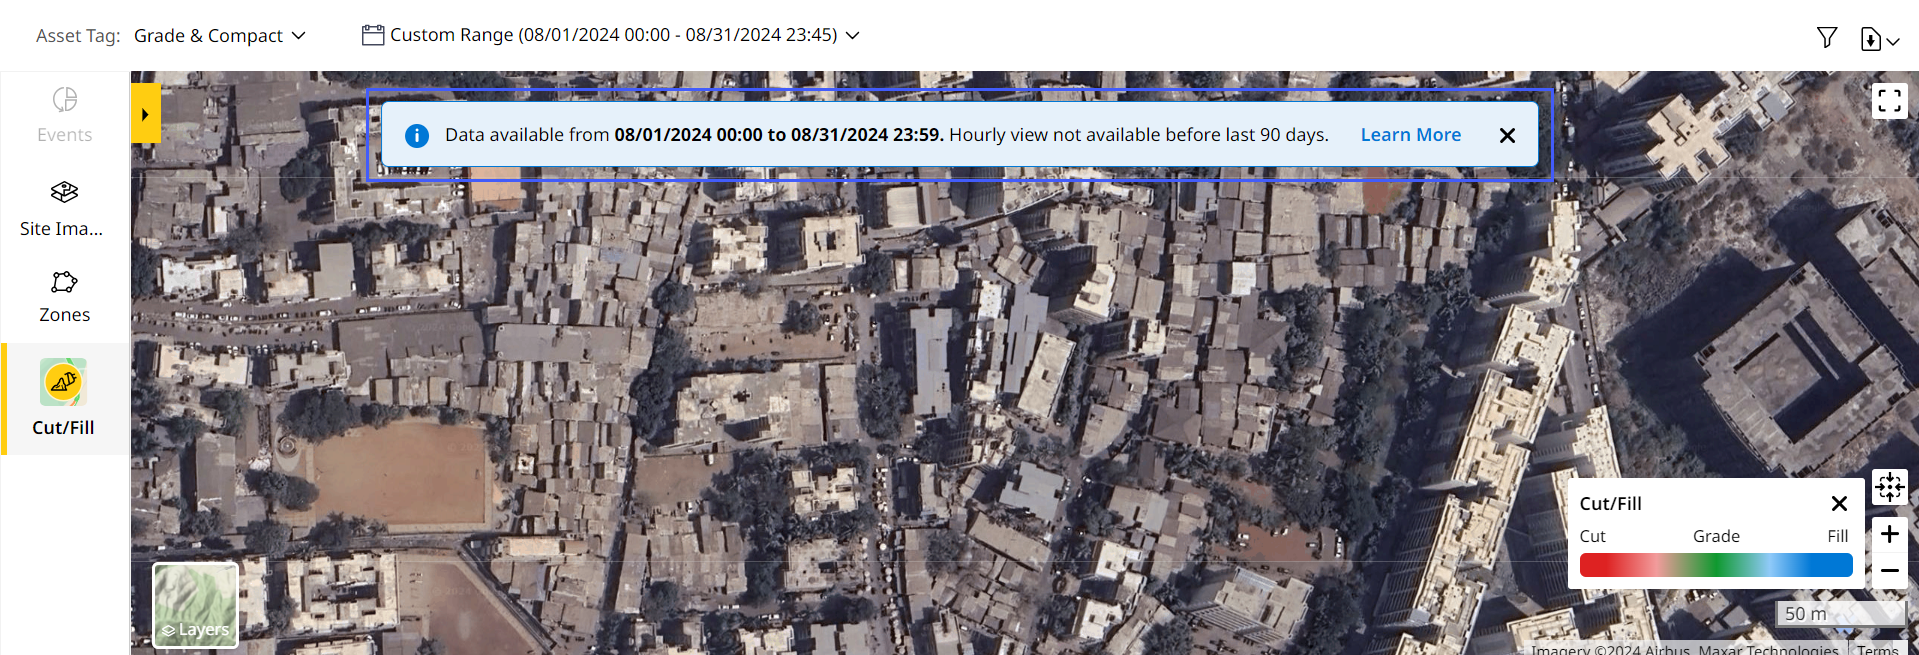
• If you select Grade & Compact assets and a custom range period within the last 90 days (from today's date), the following options will be available:
◦ Select your preferred time from an interval of 15 minutes.
View ImageView Image
◦ The following Map Details are available:
▪ Traffic
▪ Cut/Fill
▪ Elevation
▪ Pass Count
▪ Speed
▪ CMV (Compaction Meter Value)
▪ MDP (Machine Drive Power)
▪ LCA (Landfill Compaction Algorithm)
▪ Temperature
• If you select Grade & Compact assets and a custom range period greater than 90 days (from today's date), the following options will change:
◦ Selected date will use 11:45PM as the default time value.
View ImageView Image
Tab_Calendar_MoreThan90.png)
◦ The following Map Details filters associated with Elevation Data are available (Cut/Fill and Elevation):
▪ Traffic
▪ Cut/Fill
▪ Elevation
• It’s possible that some part of the Custom Range falls between the last 90 days but the rest falls outside of it. If so, you can view hourly data for the former range, i.e., within 90 days, and daily data for the latter range, i.e., older than 90 days.
View ImageView Image
-
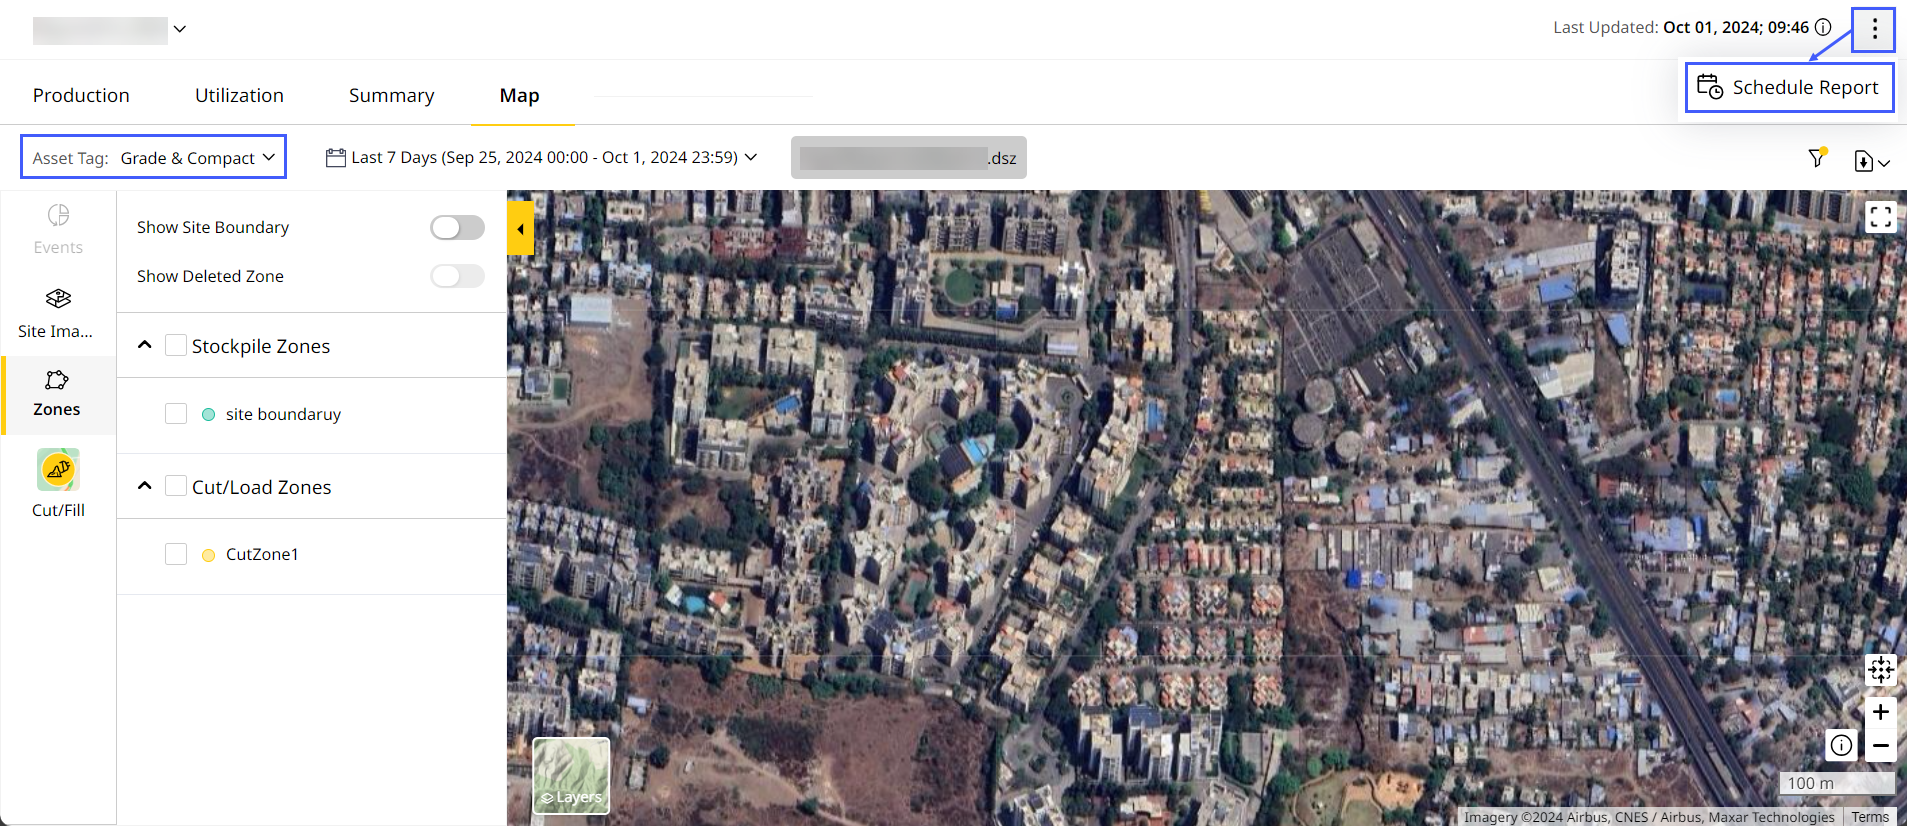
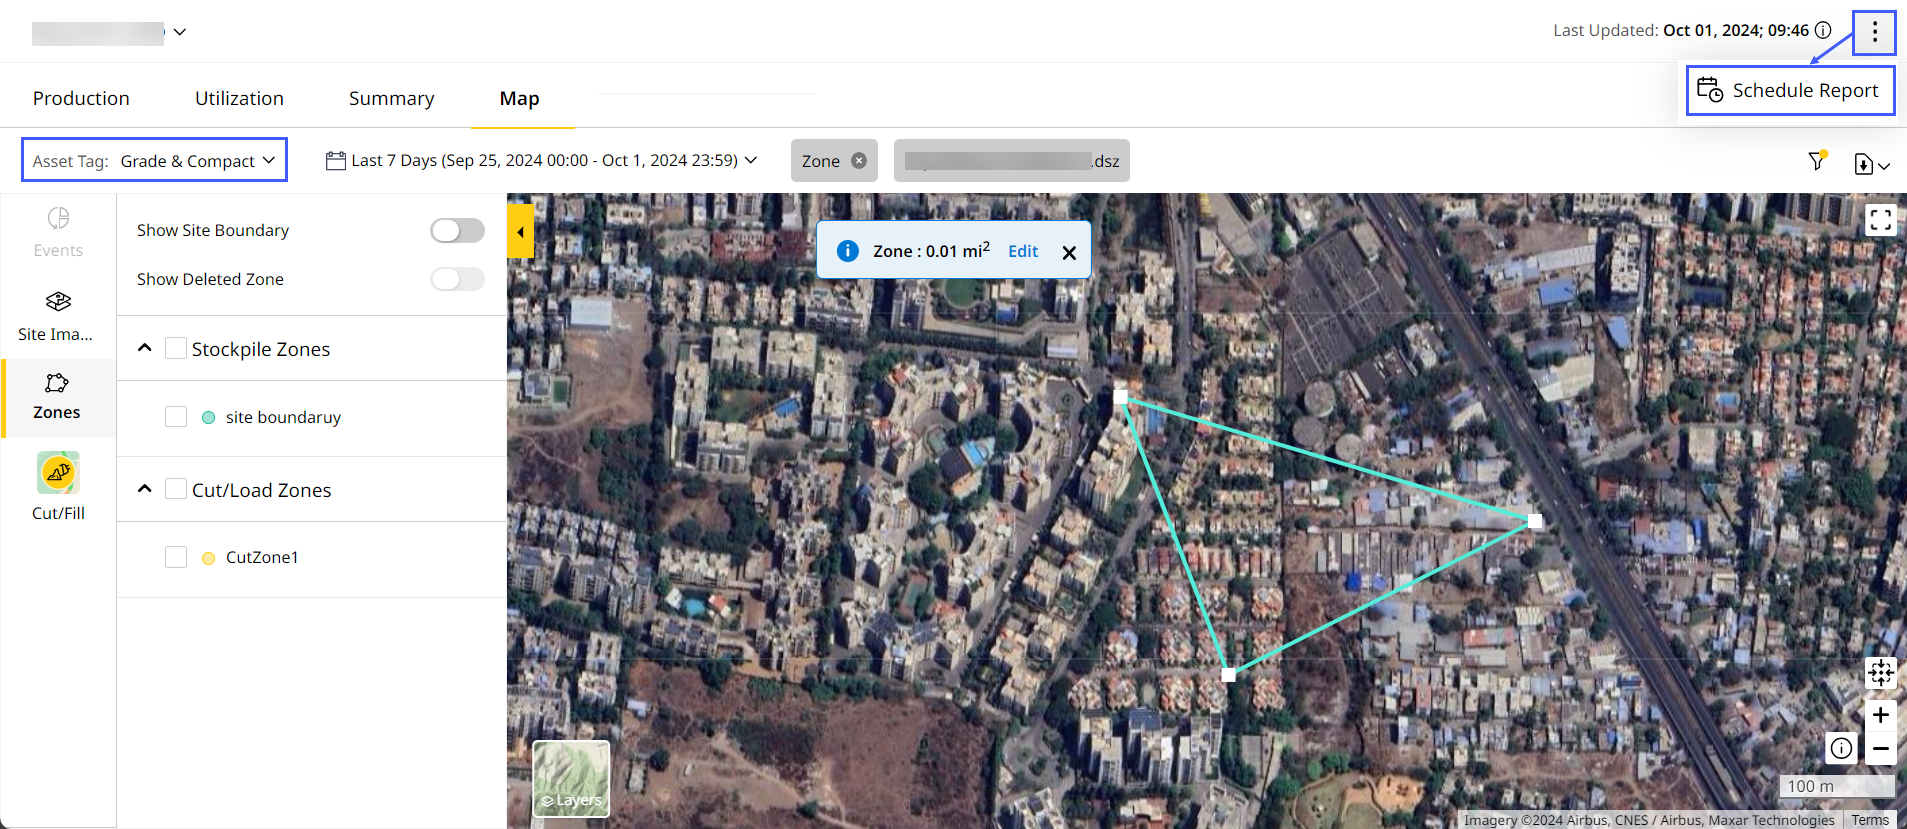
More Options: Click more options
 to perform the following:
 -
Schedule Report: Receive periodic (daily, weekly and monthly) updates on all your Summary (Insights) data as a .xlsx and .csv file.
-
Site Configurations: Set Lift (Layer) threshold value to view lift thickness information
These options are available only for sites that contain assets with 3D capabilities.
View ImageView Image

-
-
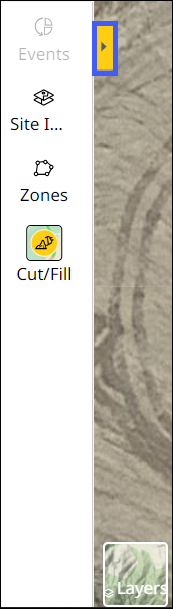
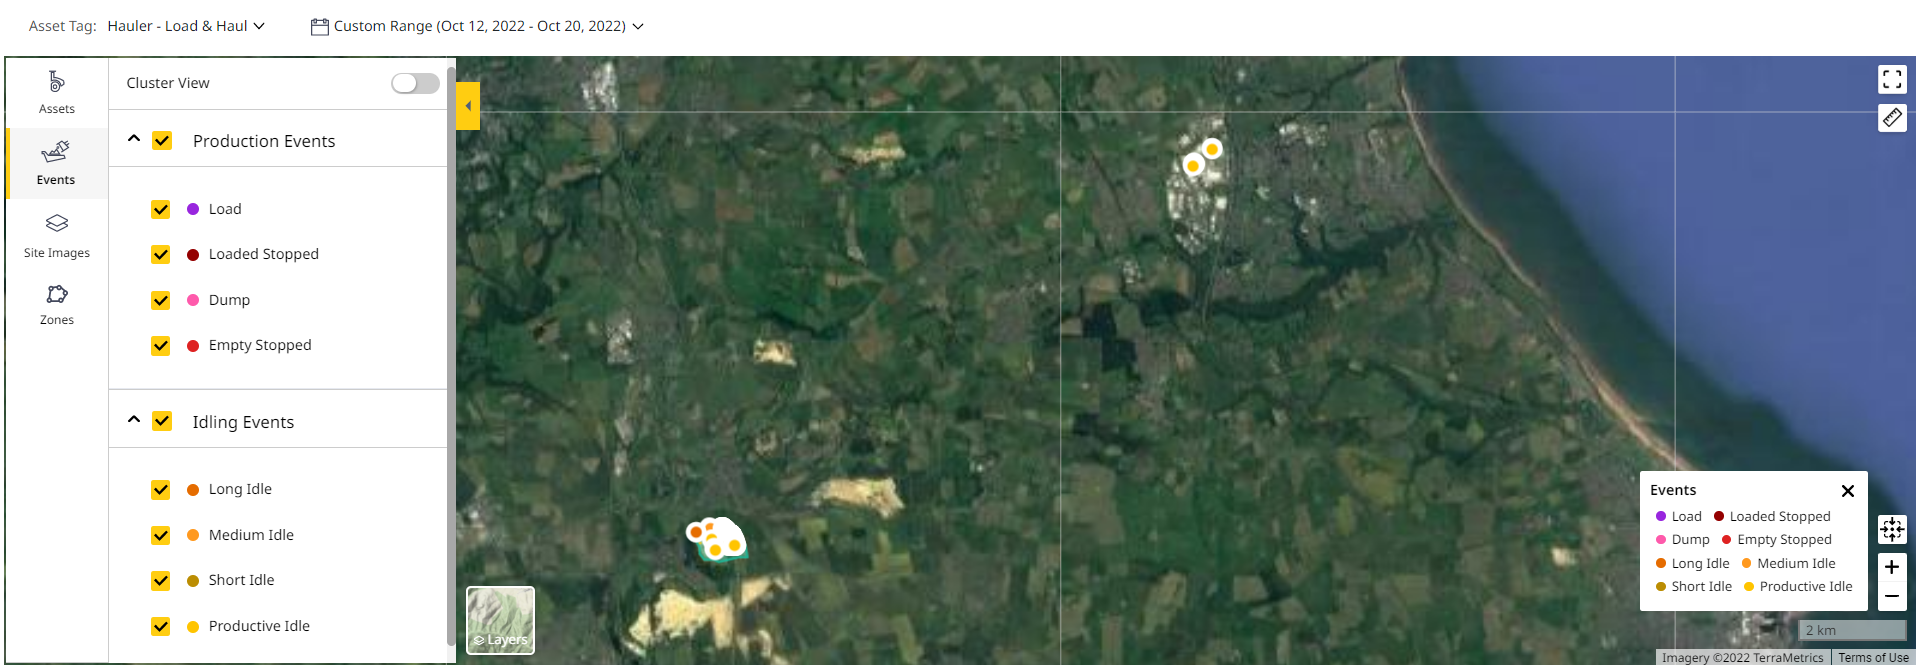
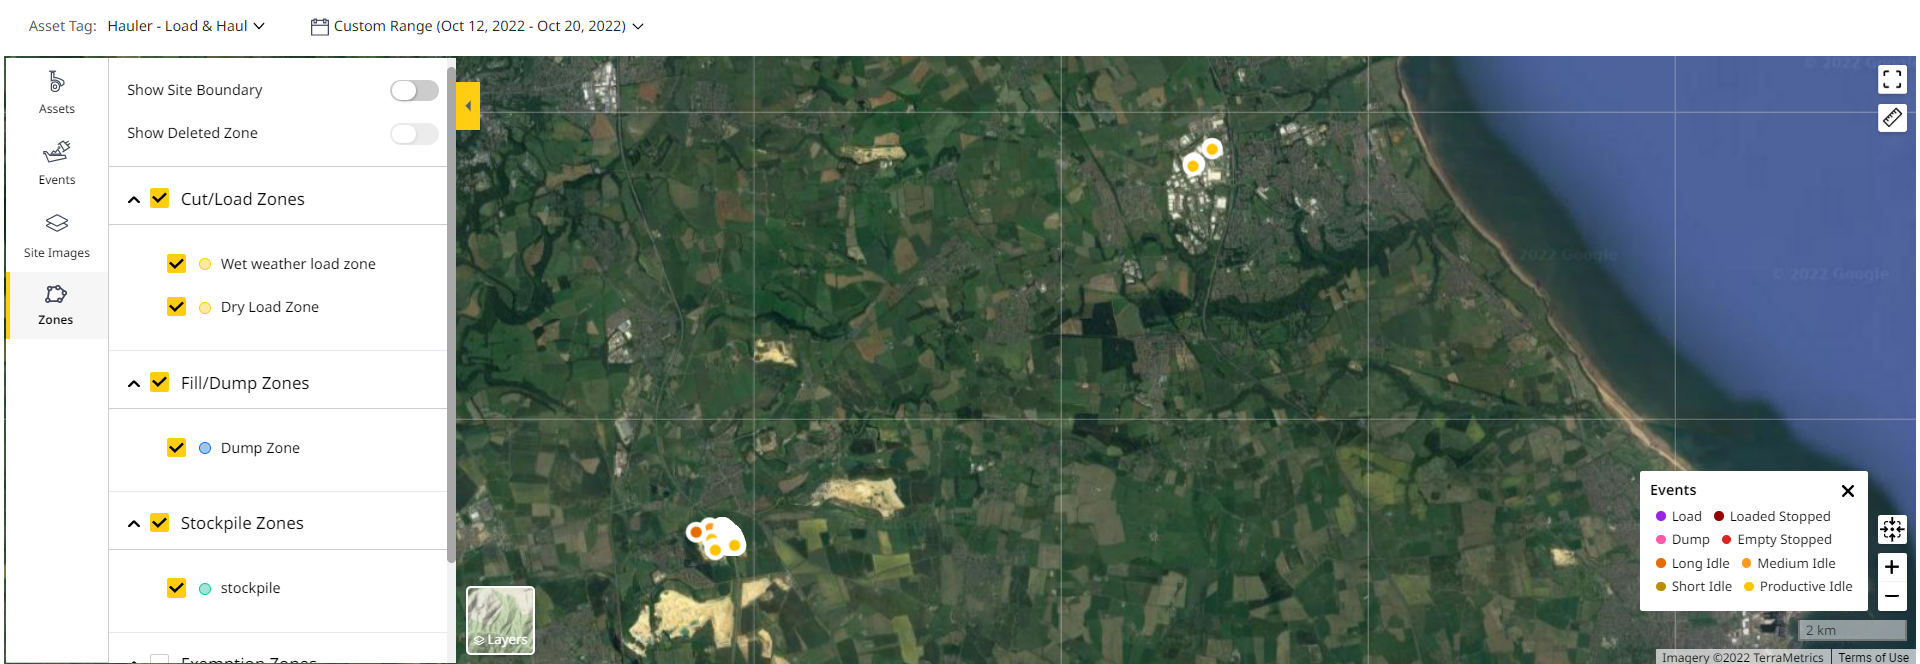
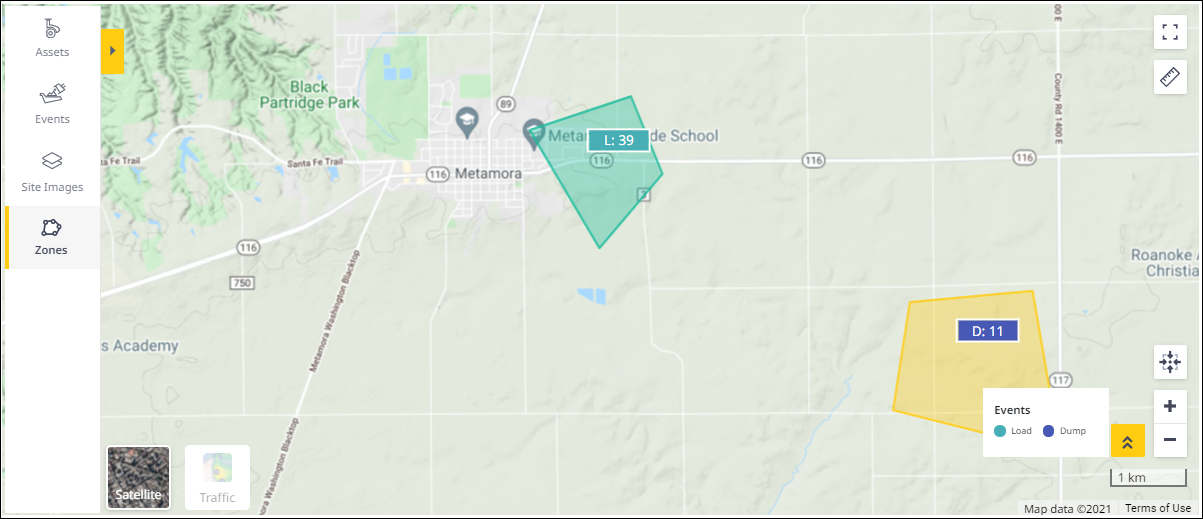
Slider Pane: On the left side of Map is a slider pane that expands when you click on the arrow. It displays Events, Site Images and Zones that you can select to view in detail. You can view selected legends at the bottom of map once the slider panel is closed.
-
Events

Use Events, specifically production & idling events, to filter data displayed by selecting or deselecting events. Each event is represented by a distinct auto-selected color.
Production events are selected by default and include Load, Dump, Loaded Stopped, and Empty Stopped.
For load out assets, the Load events are changed to Dig events, which needs to be manually selected. The Idling Events include Long Idle, Medium Idle, Short Idle and Productive Idle. They vary depending on the selected asset tags and date range.
The default view of Events is the cluster view where all different events occurring in a particular location are grouped together.
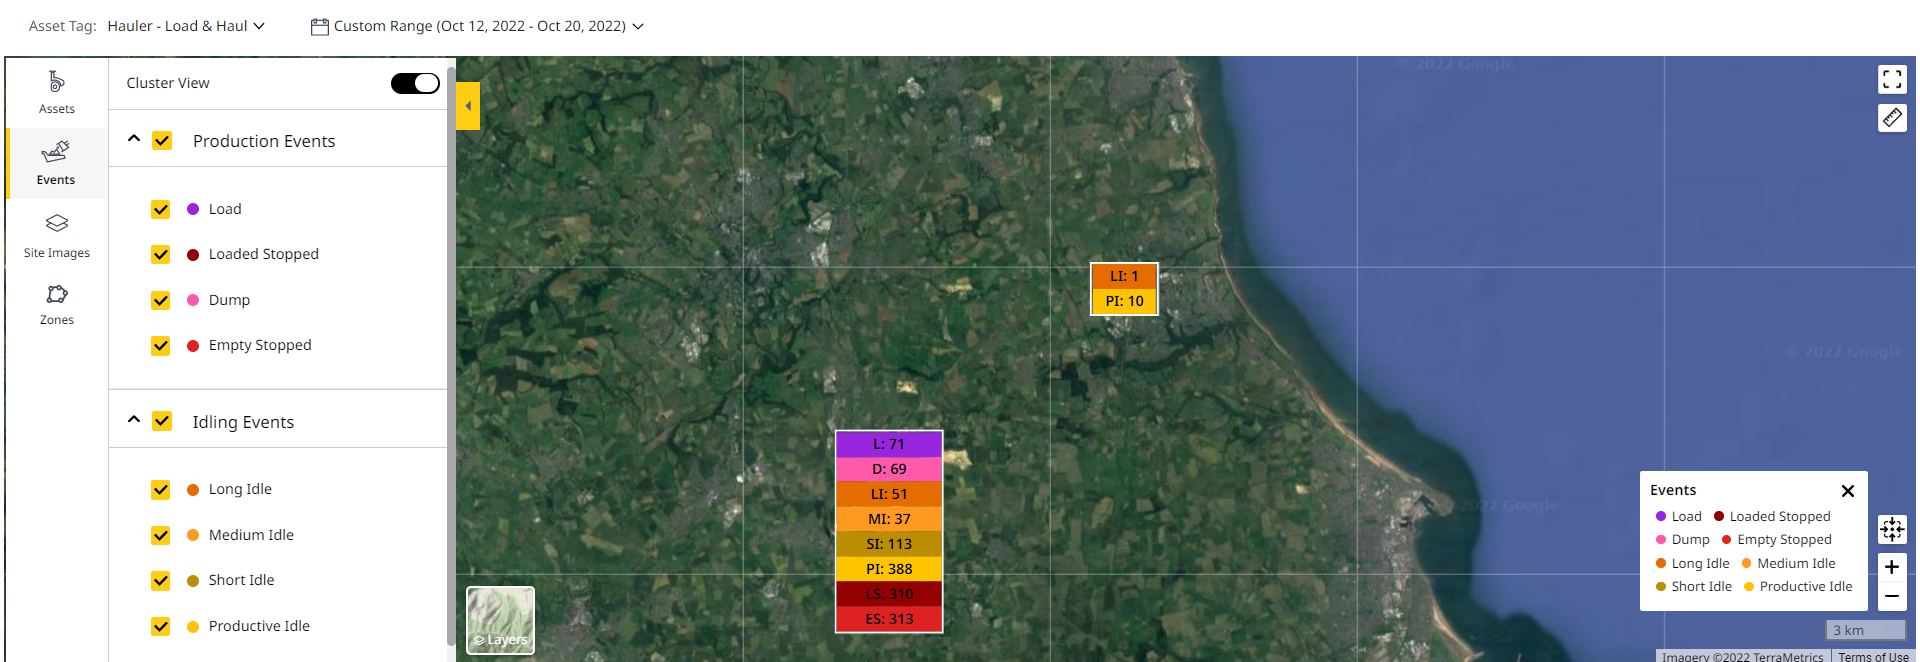
On switching off the toggle button, the cluster view changes, plotting individual events on the map in locations where they occurred.
For an ejector-style articulated truck, considered a hauler asset, the Dump Time, Location and Duration may not be captured correctly in some situations. Typically, it is when an ejector reaches its home position that the dump is recorded as ended and the location is tracked. However, if the operator begins to drive away from the actual dump area while returning the ejector:
-
Location will be recorded as wherever the ejector is returned.
-
Dump Time will include the extended travel time until the ejector was returned to its home position.
-
Duration of that segment will include more than just the duration to dump the material.
-
-
Site Images

Helps you view the uploaded site images. Refer to Add Site Images for more information about adding images under the slider icon.
-
-
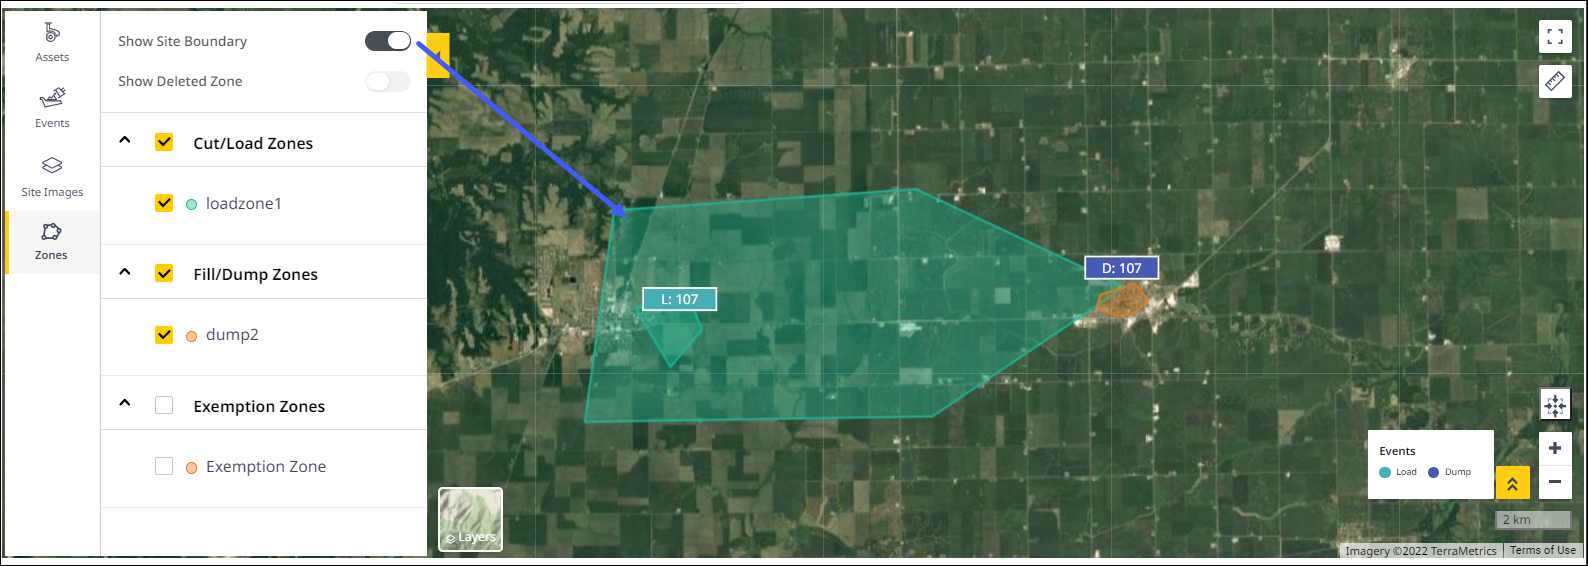
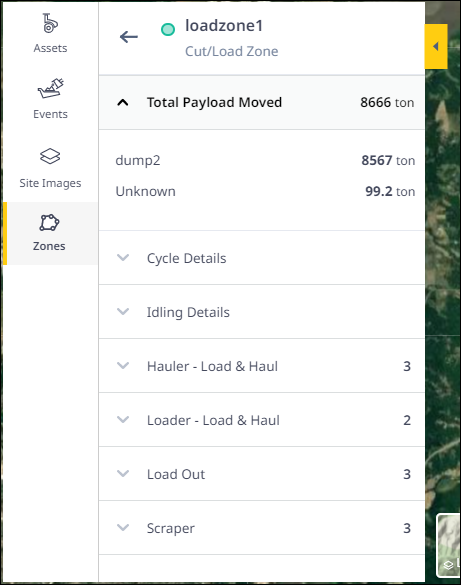
Use Zones to select or unselect created zones under the Cut/Load, Fill/Dump and Exemption zones for the selected site.
The Deleted zones button is enabled only if those zones are available for the selected date range. The zones are represented by the colors chosen when the zone was created.
Refer to Zones in Map (Insights) Tab for more information.
-
Use the Show Site Boundary toggle to view or hide the site boundary of a site. It is enabled only if there is an existing site boundary.
-
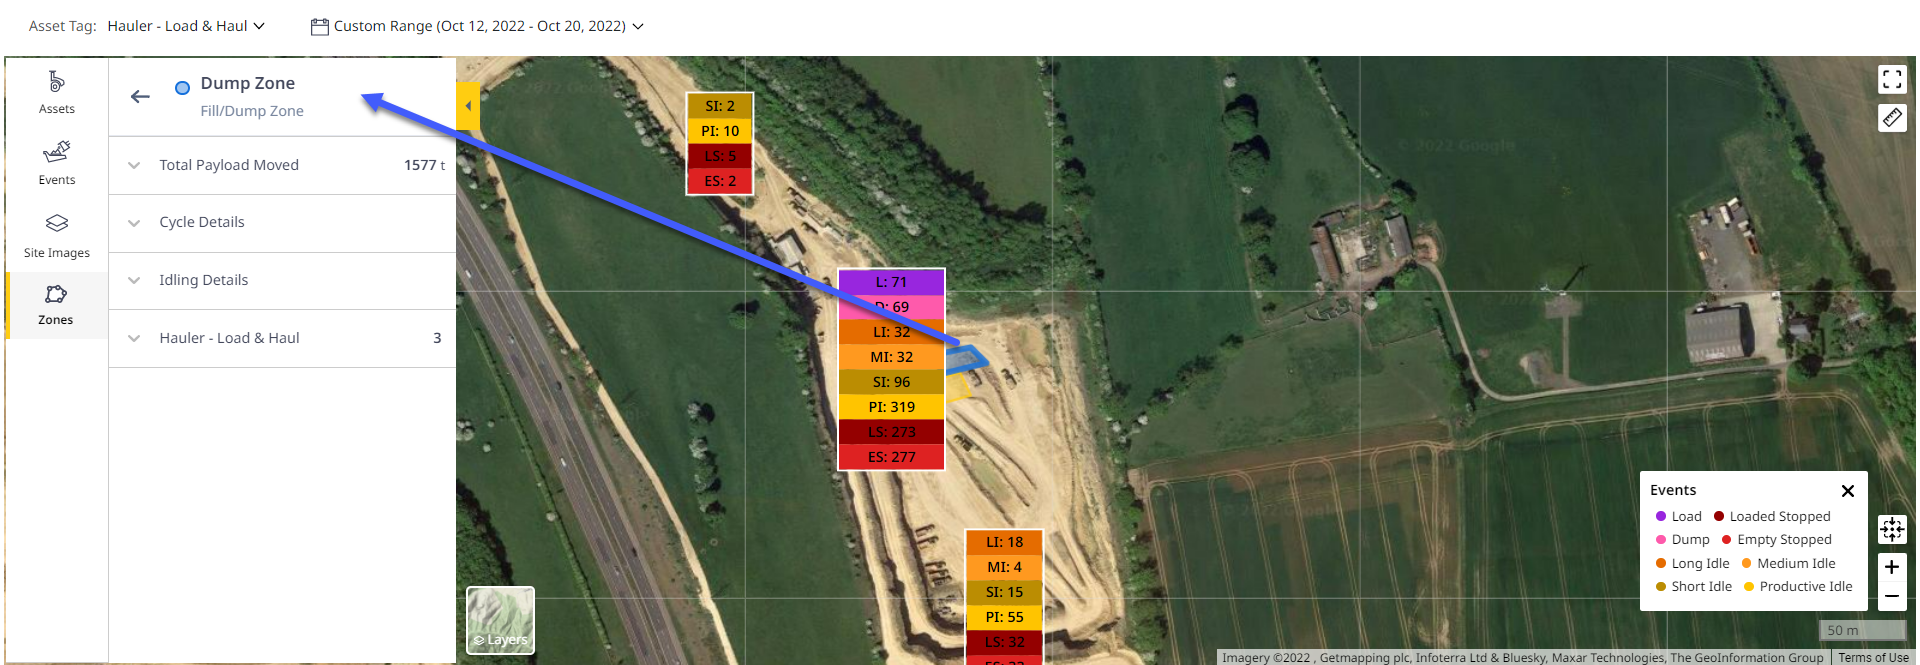
Click on a zone in the map to view its details. The respective zone info card opens in place of Zones.
-
Click next to the metrics or asset tag for a detailed breakdown of the zone data.
-
It includes Payload Details, Cycle Details, Idling Details and Asset Tag-wise data breakdown. For more information, refer to Zone Card Details.
-
-
-
Filters: Filter based on single or multiple asset IDs and design or survey files for the selected date range. The selected assets and files is also displayed as chips next to date range.
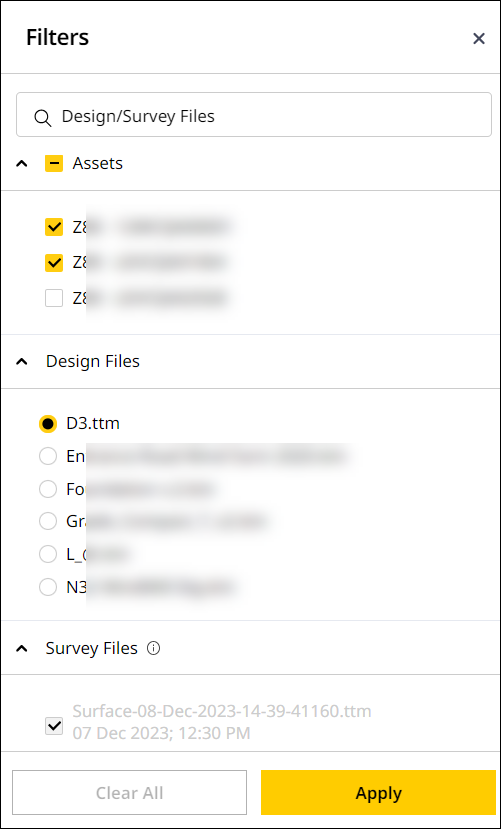
View available surfaces of .xml files to track remaining work. To learn more, refer to Grade and Compact Filters. -
Download: Allows you to download multiple kinds of reports for grade and compact assets.
-
Full Screen View: Expand the map view to a full screen view for an unobstructed site visual. This helps make it easier to track all zones and events.
-
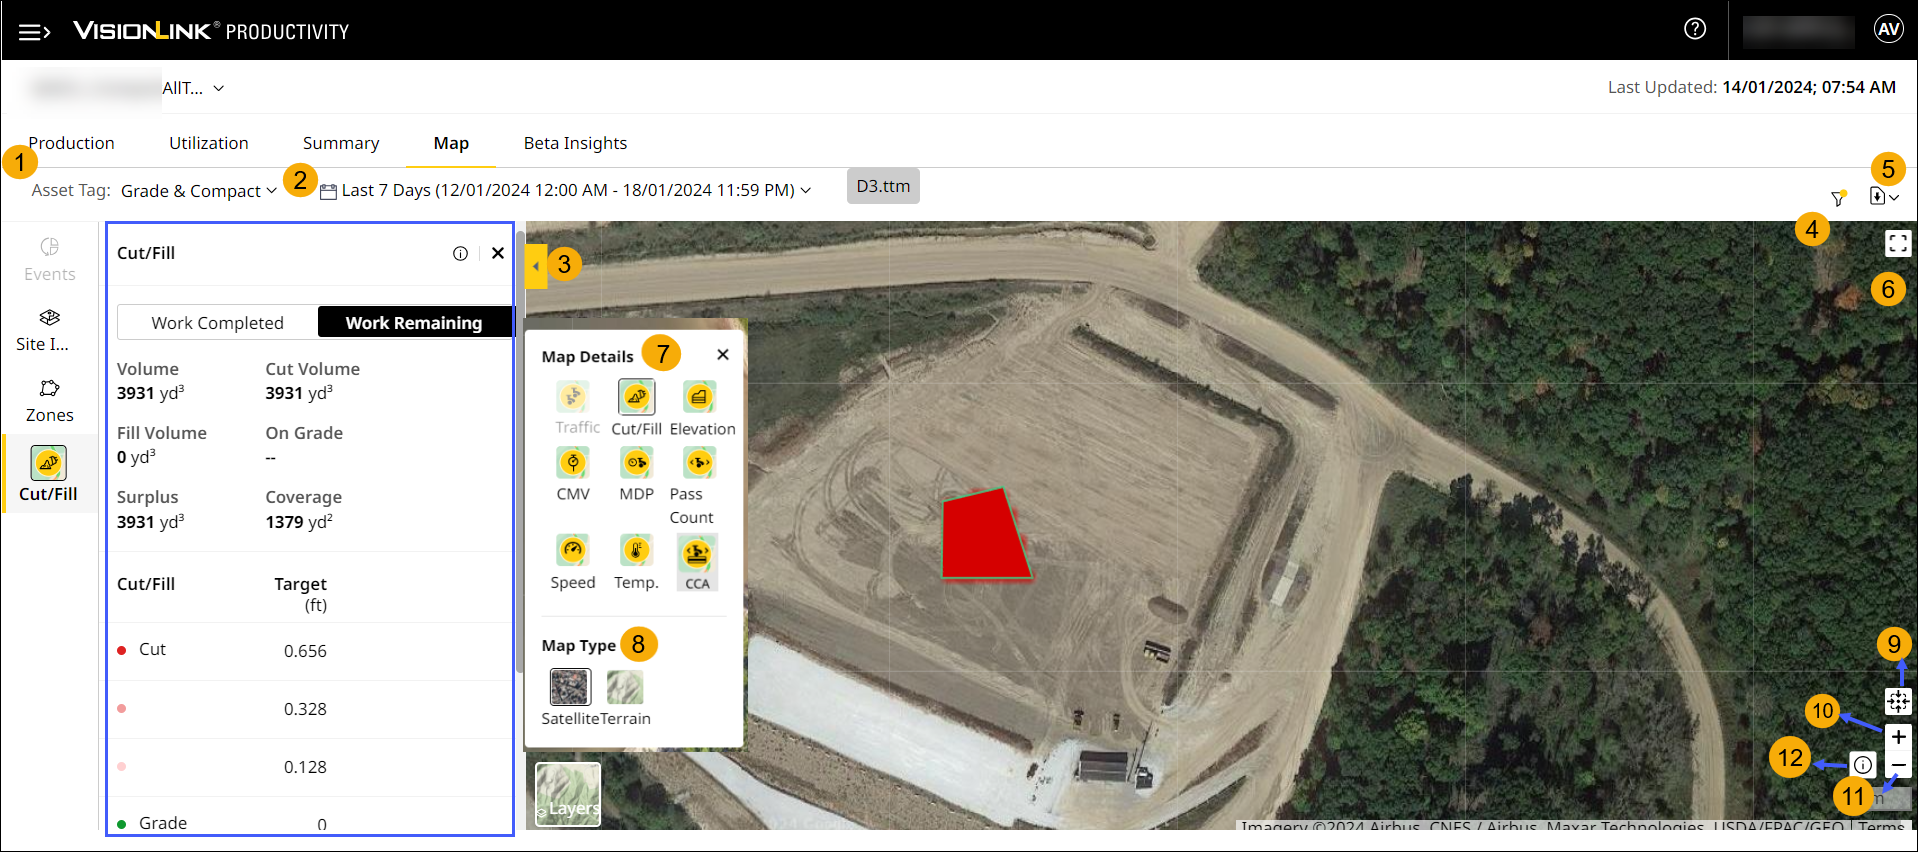
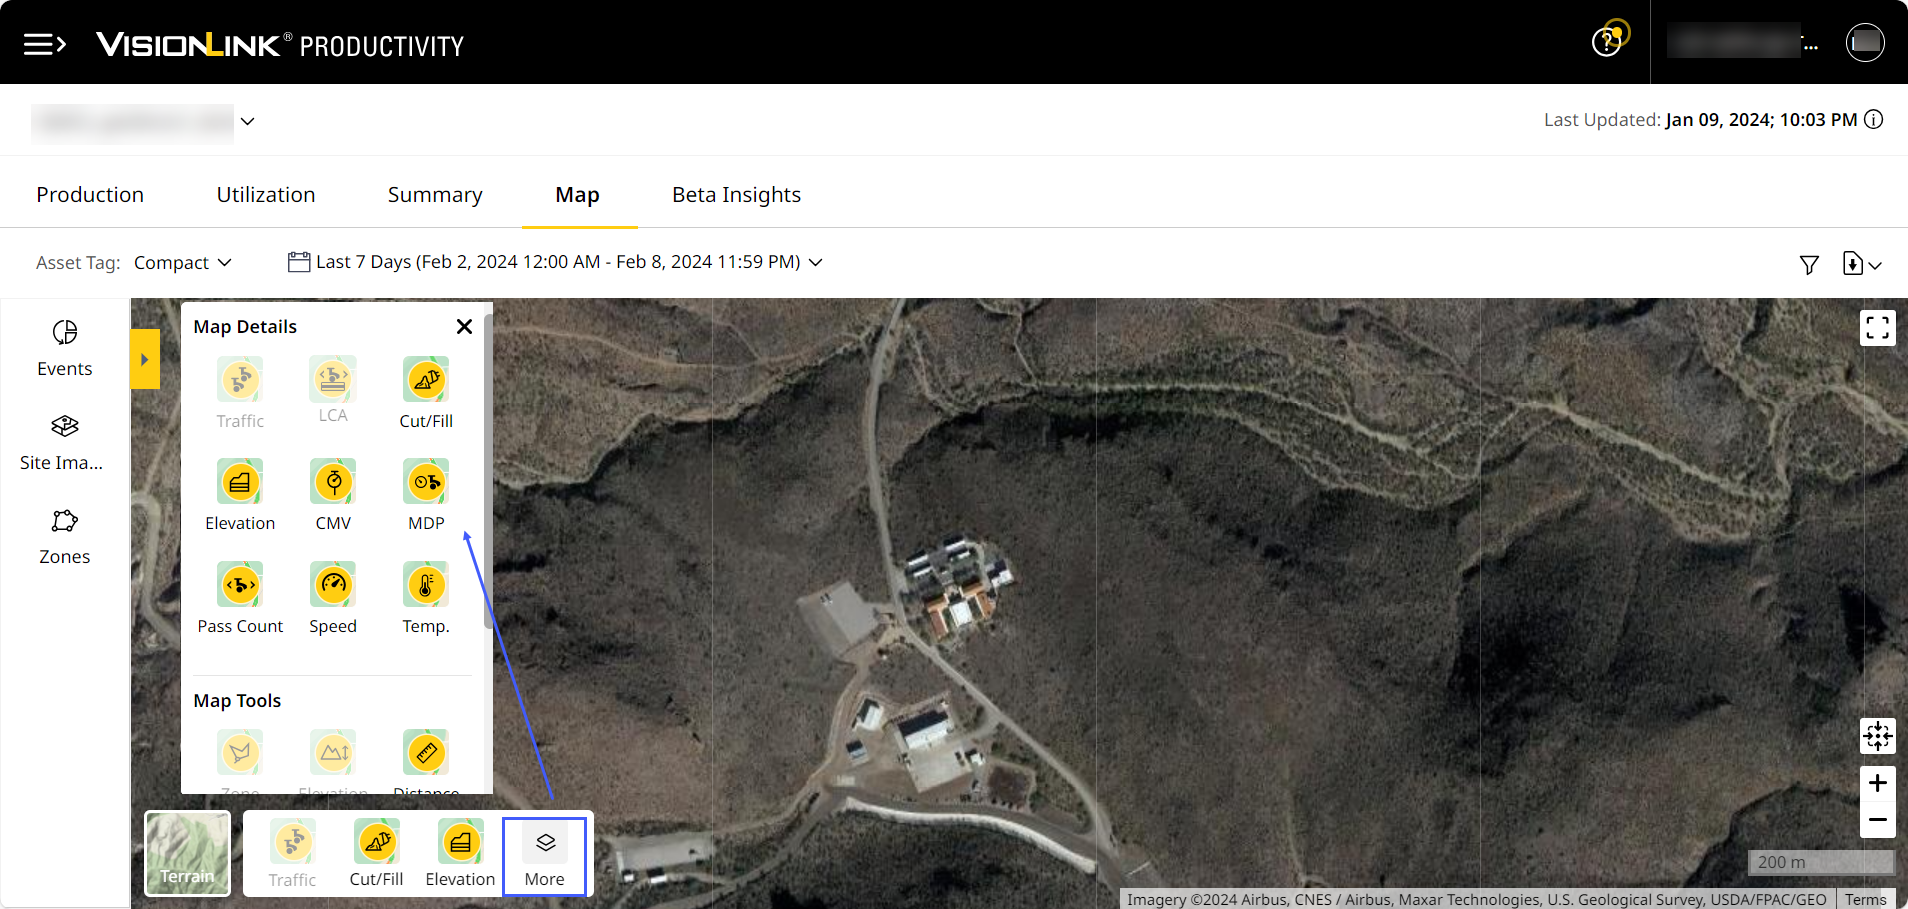
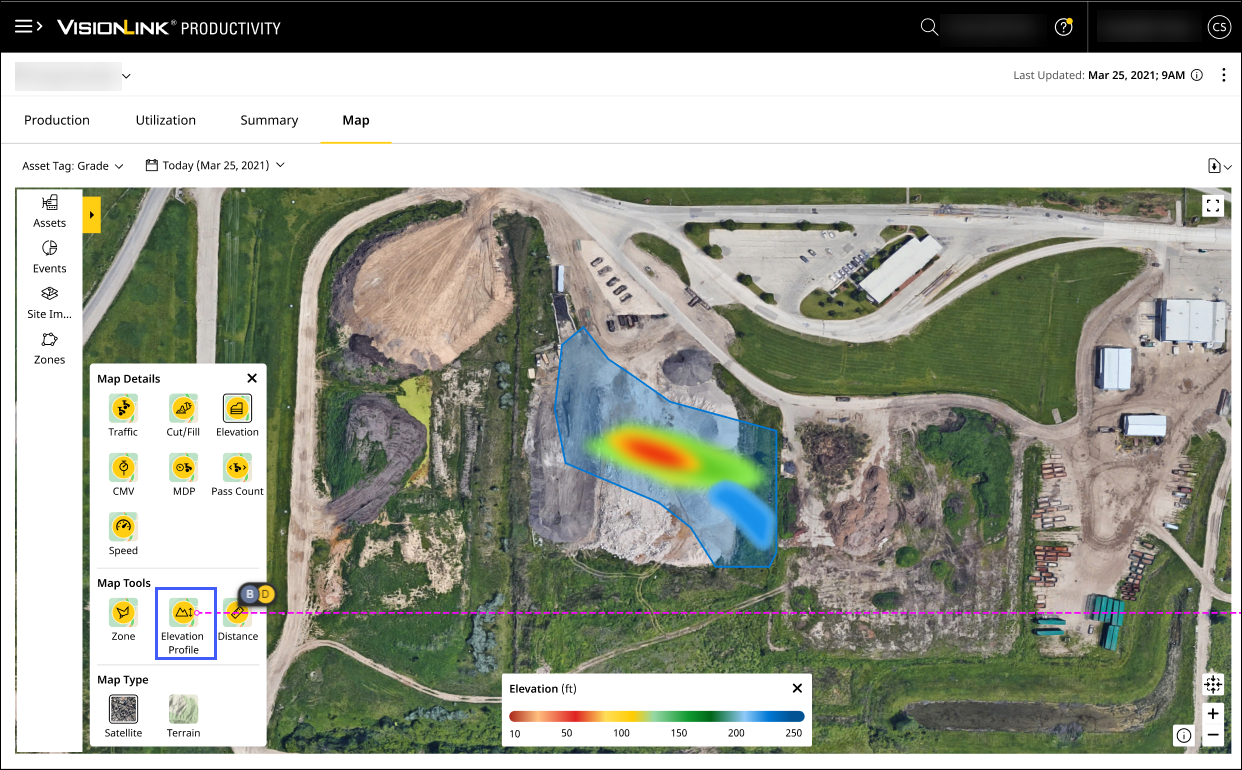
Map Details: View the following map details:
• To learn more about tag files and how they help view and track Map Details for grade assets, refer to Tag File Creation.
• If you’ve selected Grade, Compact or Grade & Compact asset tag, you can schedule a volume report. Refer to Volume & Density to know more.
View ImageView Image
-
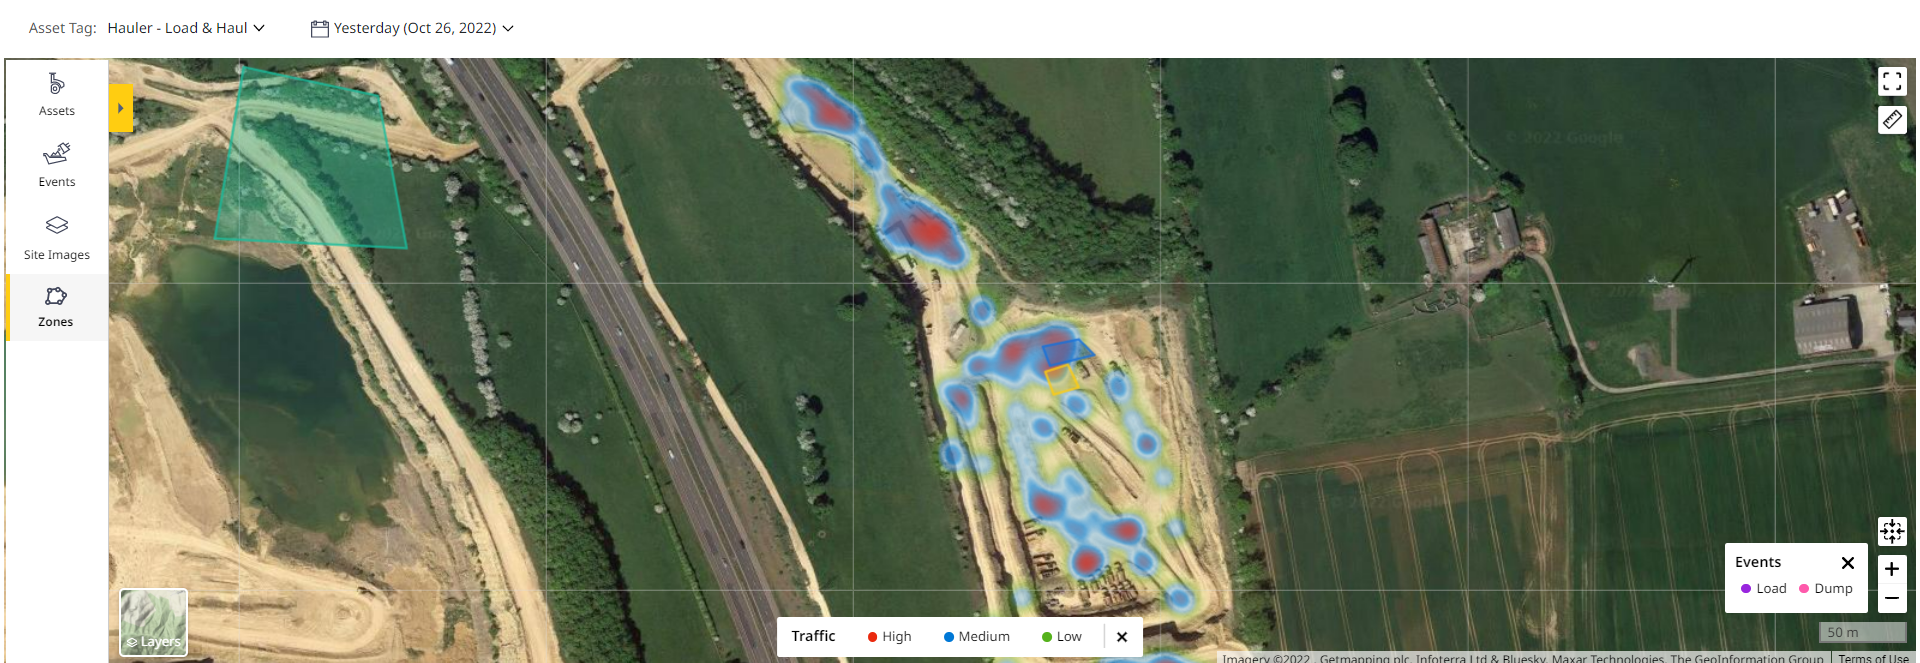
Traffic
 : It provides detailed graphical info where assets spend the most time. This happens by plotting the telematics location of a particular asset, for a single day, as a heat map.
Asset filters can be used to view traffic data for single or multiple assets. Hover the mouse near the Terrain or Satellite button for the Traffic button to be enabled. Click to view traffic.
Depending on how often an asset is reported at a location, the traffic is designated as High, Medium and Low.
-
Haul Road Condition
 : Visualize the quality of road used by hauler assets on the map. Also, view the count of assets using these haul roads along with haul events of varying severity. This helps monitor the condition of haul roads, which have a direct impact on the
performance, productivity and safety of your assets. On Haul Road Analysis, view the following details:

-
Total Reporting Assets
It is applicable only for PerformancePro-subscribed Off-highway Truck and Large Mining Truck asset types. -
Ranges of event severity and total count of events: High, Medium, Low ranges. Click each severity range to view the following:
-
Haul Events
View the following haul events and its counts: -
Count: Shows the count of events of each haul road condition events.
-
Asset Count: Shows the count of assets that reports the respective haul road condition events.
-
-
-
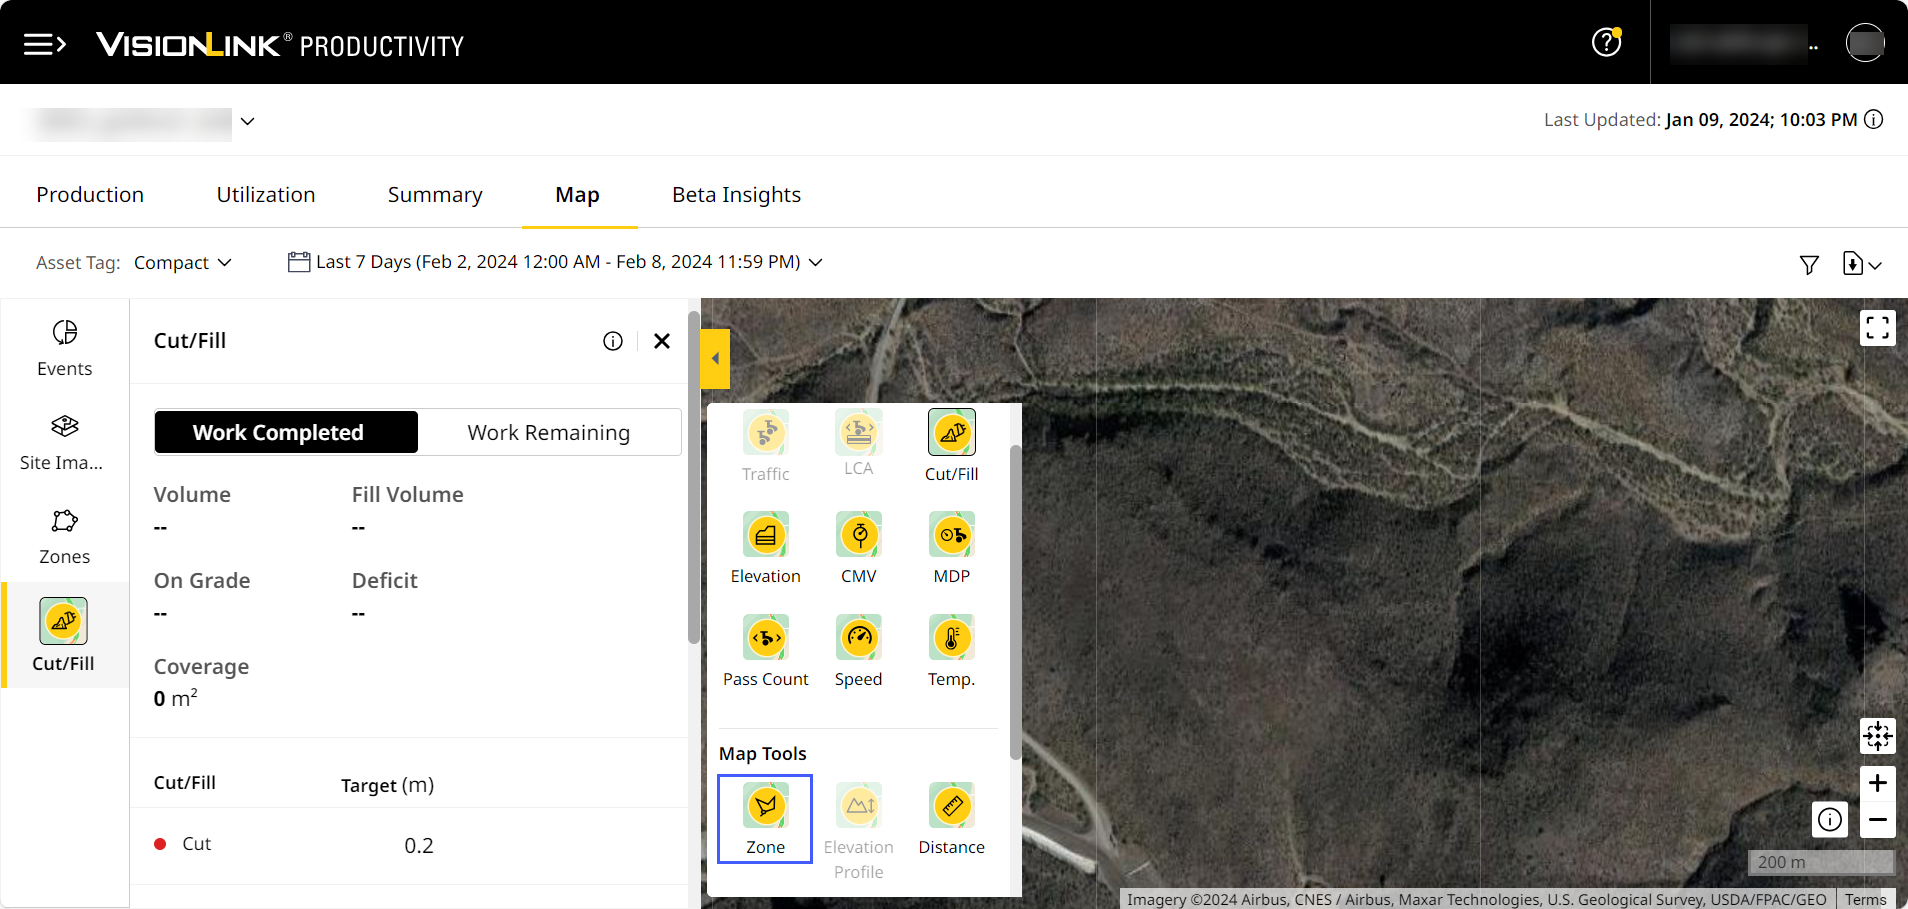
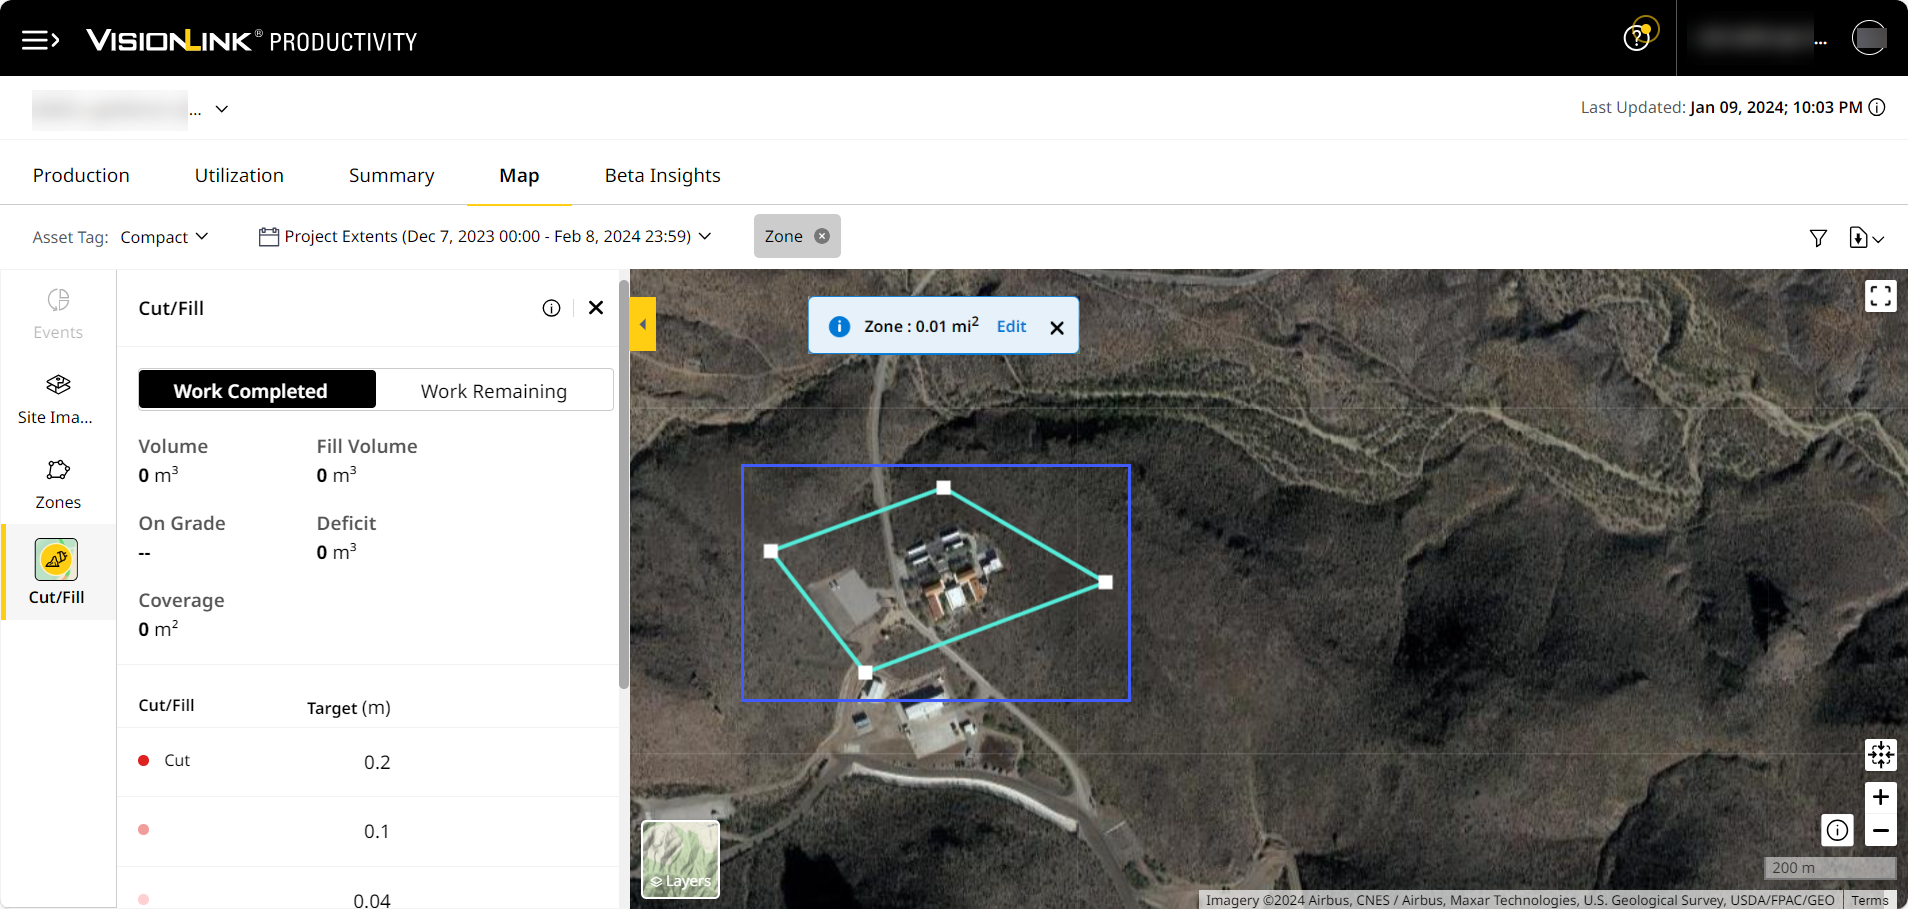
Cut/Fill
 : Track completed and remaining work for selected assets and date range. Select View By as Work Completed or Work Remaining to load relevant data. When you select Grade as asset tag, the Cut/Fill layer shows Work Completed details by default. The Cut/Fill card displays the following KPIs:
The following Map Tools are available on selecting Cut/Fill:
• Zone
• Elevation Profile
• Distance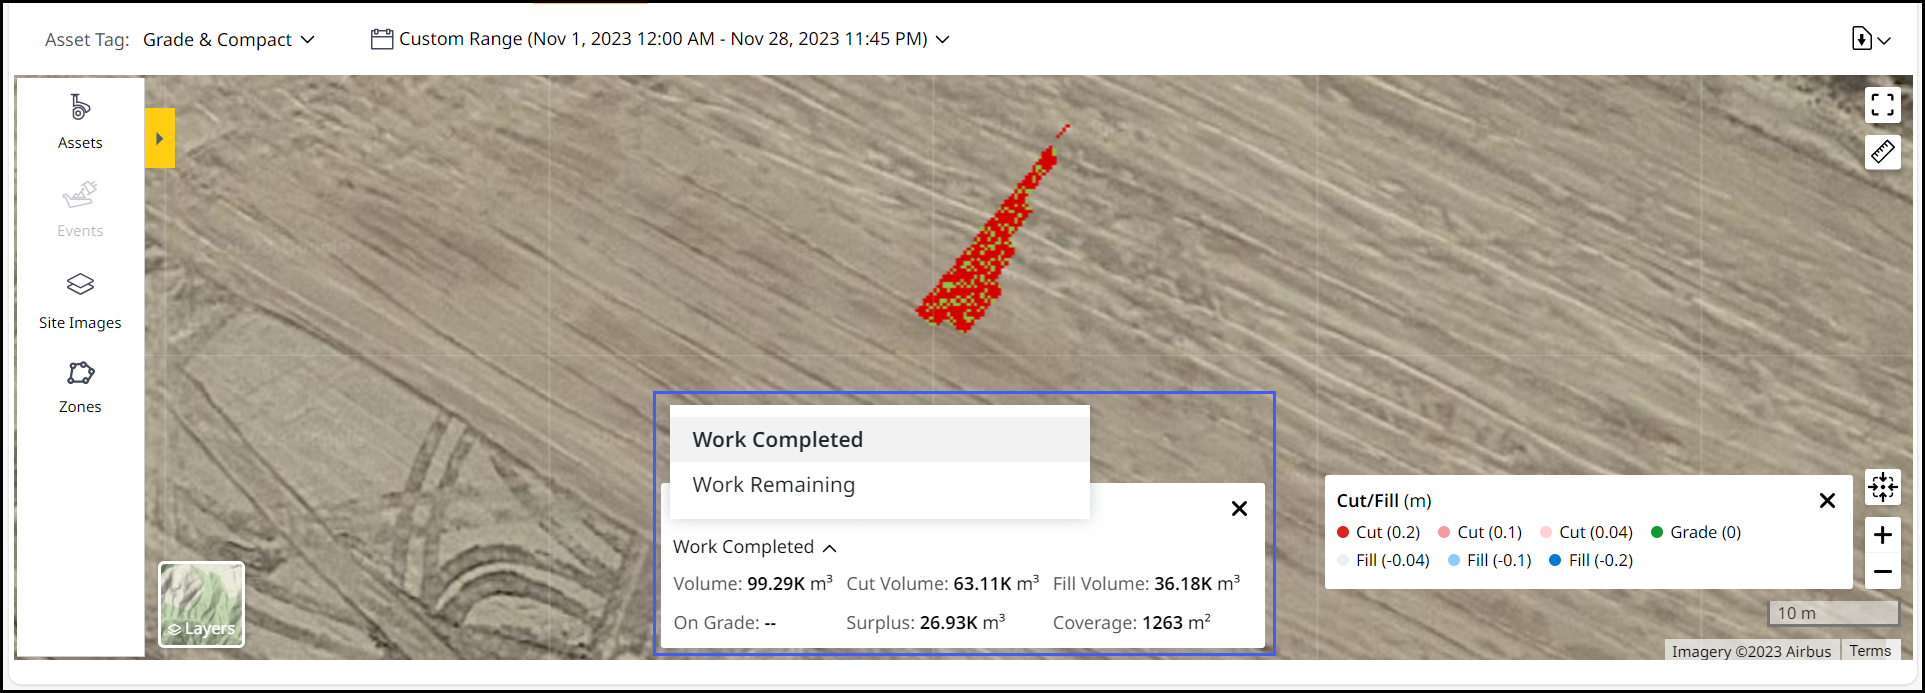
-
Work Completed: Zones are selected by default. Enable and view events data from left panel. This KPI provides the following details:
-
Volume: Total volume cut and filled based on date and asset selections.
-
Cut Volume: Total cut volume based on date and asset selections.
-
Fill Volume; Total fill volume based on date and asset selections.
-
On Grade: This will be '--' for Work Completed.
-
Surplus or Deficit: This label changes based on the value. Surplus implies that the value is positive and Deficit implies a negative value.
-
Coverage: Total area covered based on date and asset selections.
-
-
Work Remaining: Zones and Events are not selected by default. Enable and view Zones and Events data from left panel. You can set and change the default design file you view on Site Summary and Insights. This KPI provides the following details:
-
Volume: Total volume remaining based on the surface reported in the selected date range by the selected assets.
-
Cut Volume: Total cut volume remaining based on the surface reported in the selected date range by the selected assets.
-
Fill Volume: Total fill volume remaining based on the surface reported in the selected date range by the selected assets.
-
On Grade: Percentage of total surface graded in the selected date range by the selected assets.
-
Surplus or Deficit: This label changes based on the value. Surplus implies that the value is positive and Deficit implies a negative value.
-
-
-
Elevation
 : This layer displays elevation data based on surface graded by selected assets and date range. Click on hotspot of available idling events to view the Event Duration (based on long, medium, short or productive idle event) and Fuel Burn for that event.
Refer to Elevation Profile to learn how to draw one and analyze data for haul roads and cut/fill areas.
-
CMV (Compaction Meter Value)
 : Measures material stiffness for vibratory soil and asphalt compactors. Click to view the following (for single and multiple assets):
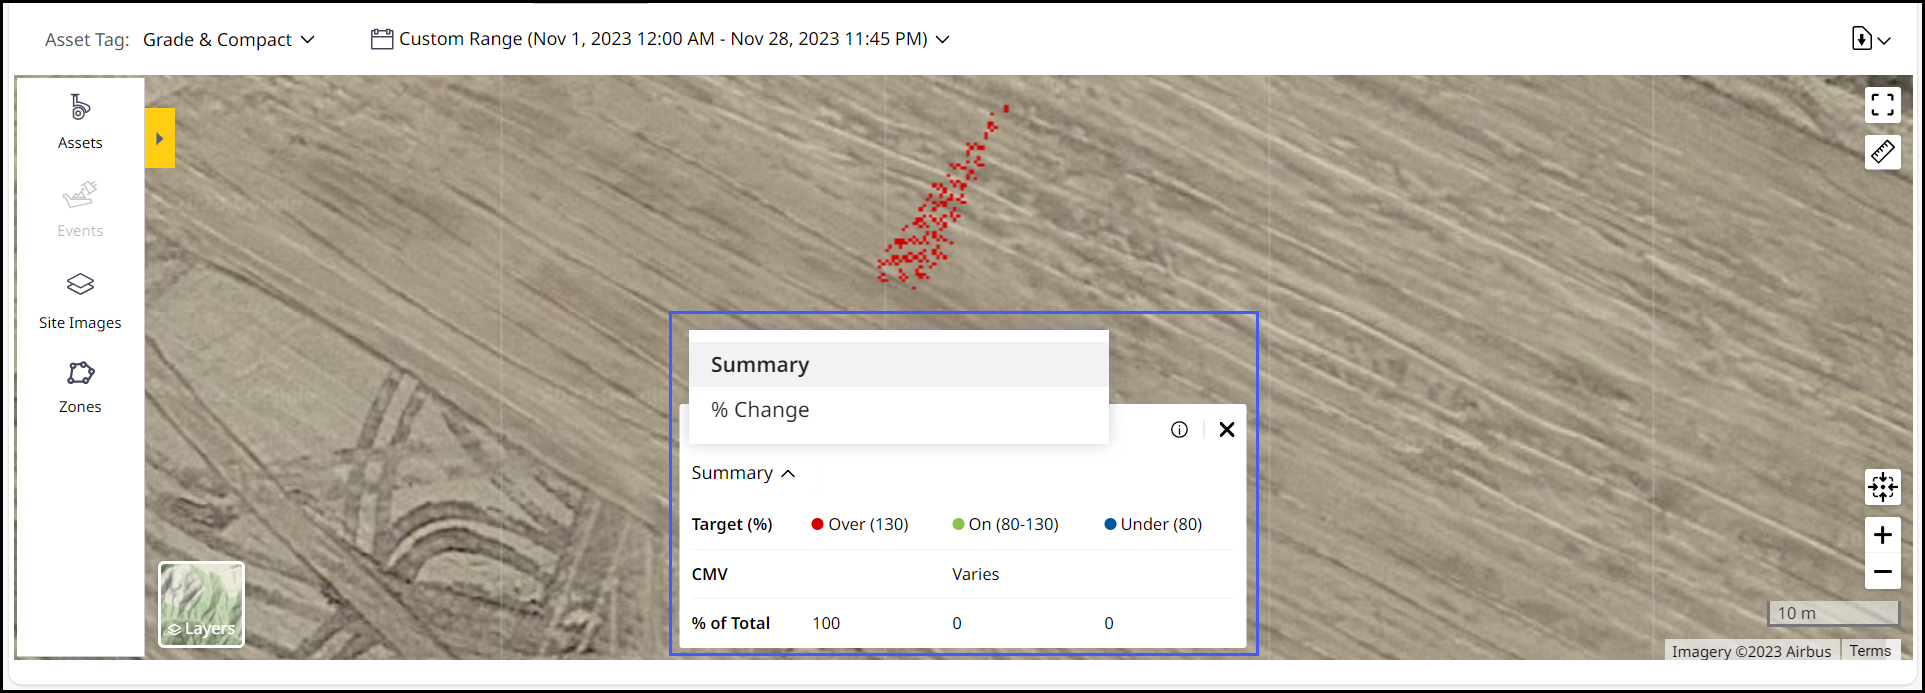
-
Summary (default selection) displays the CMV target percentage and total percentage.
-
Percentage changedisplays the change in target percentage and the total percentage.
-
-
MDP (Machine Drive Power)
 : Measures roughness of surface and drive power required to compact material. It is applicable only for soil compactors. Click to view the following (for single and multiple assets):
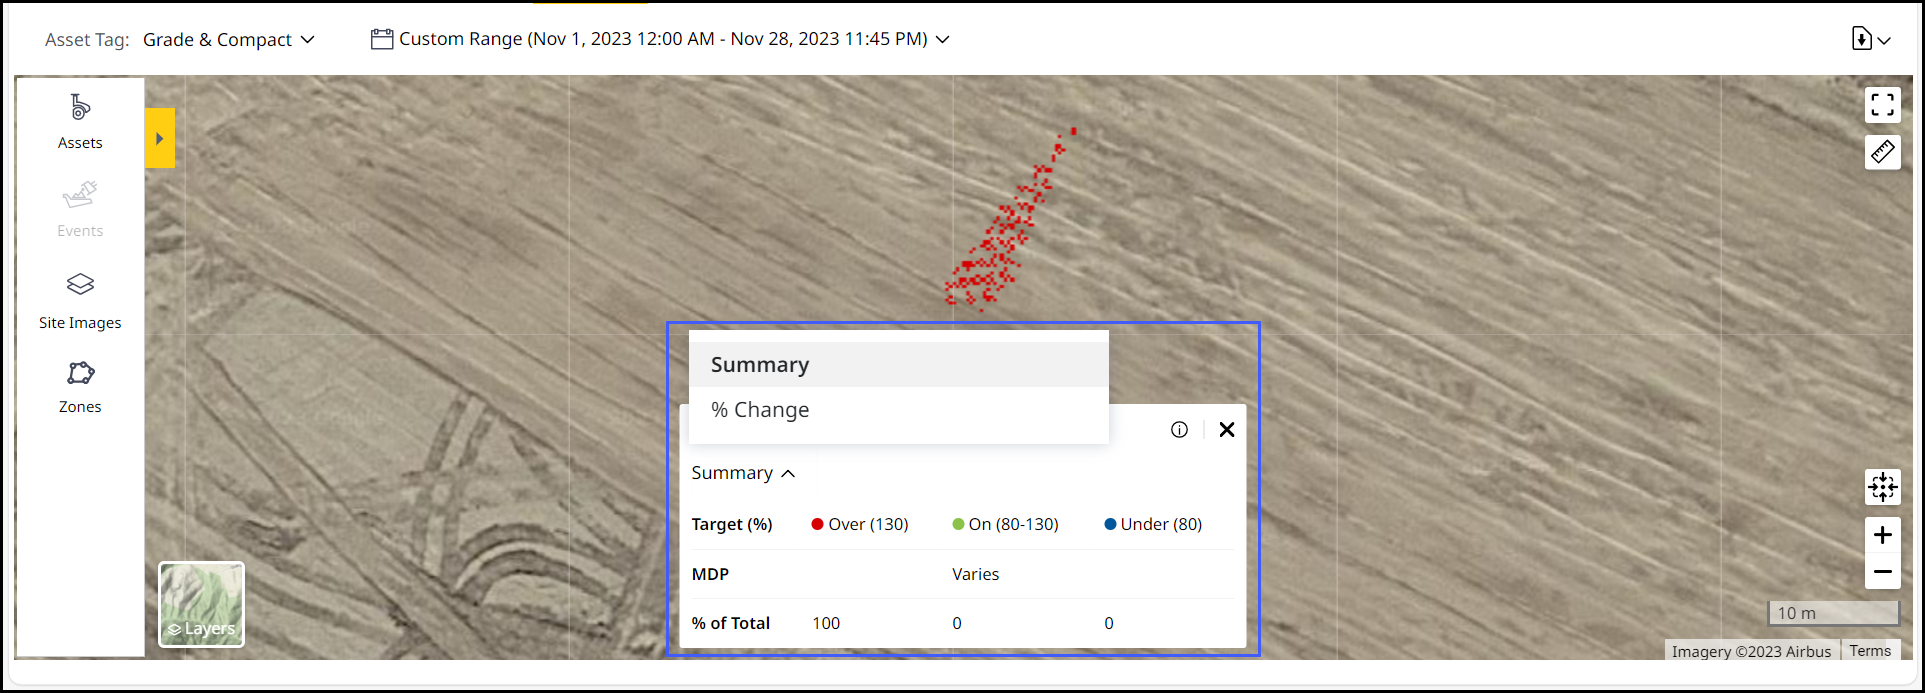
-
Summary (default selection) displays the MDP target percentage and total percentage for single asset. When you select multiple assets, this displays data for last reported asset.
-
Percentage change displays the change in target percentage and the total percentage.
-
-
Pass Count
 : View the number of times an asset has passed over the surface.
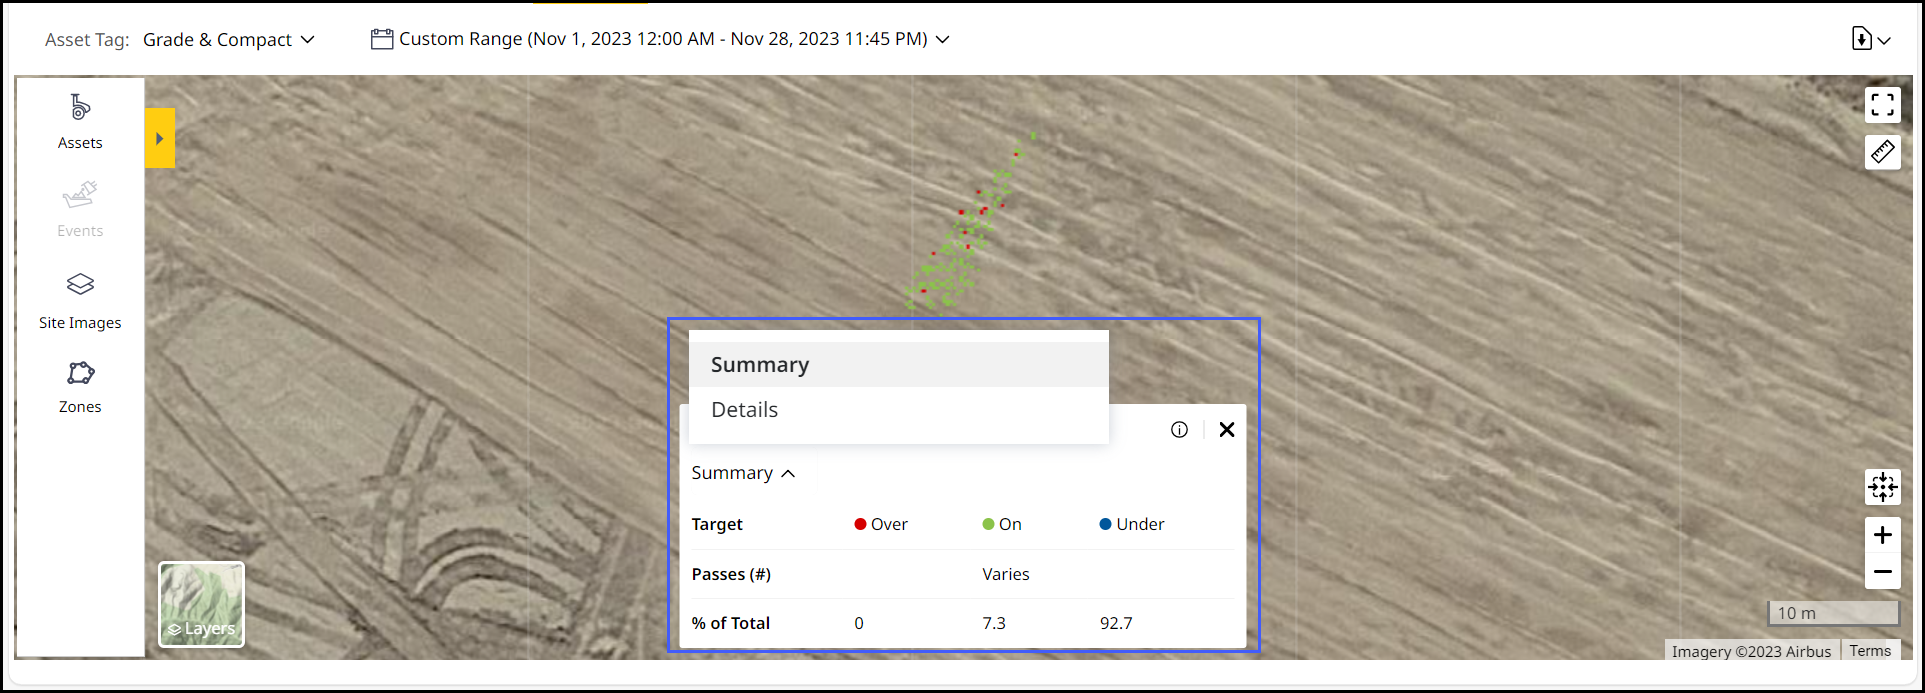
-
Summary(default selection) displays pass count target and total percentage.
-
Varies displays the last reported data for multiple assets.
-
Select Details from the drop down to view the total percentage for each pass count.
-
-
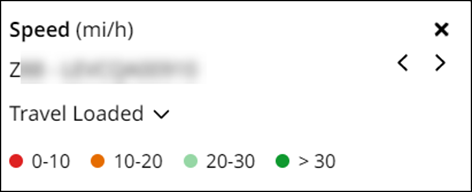
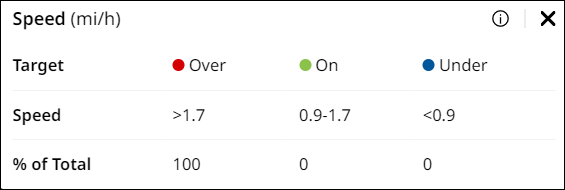
Speed
 : View speed information of the selected asset for a particular day. It is applicable only for these four asset tags: Hauler – Load & Haul, Scraper, Grade and Compact.
• For hauler and scraper assets, speed values are indicated in red and orange (unfavorable), light and dark green (favorable).
View ImageView Image
• For grade and compact assets, it provides the following crucial information on the asset’s summary values:
° Over the set speed range
° On the set speed range
° Under the set speed range
View ImageView Image
• You can view data in mi/h or km/h based on your set preferences. Caution: This feature is not available for date ranges greater than a single day.
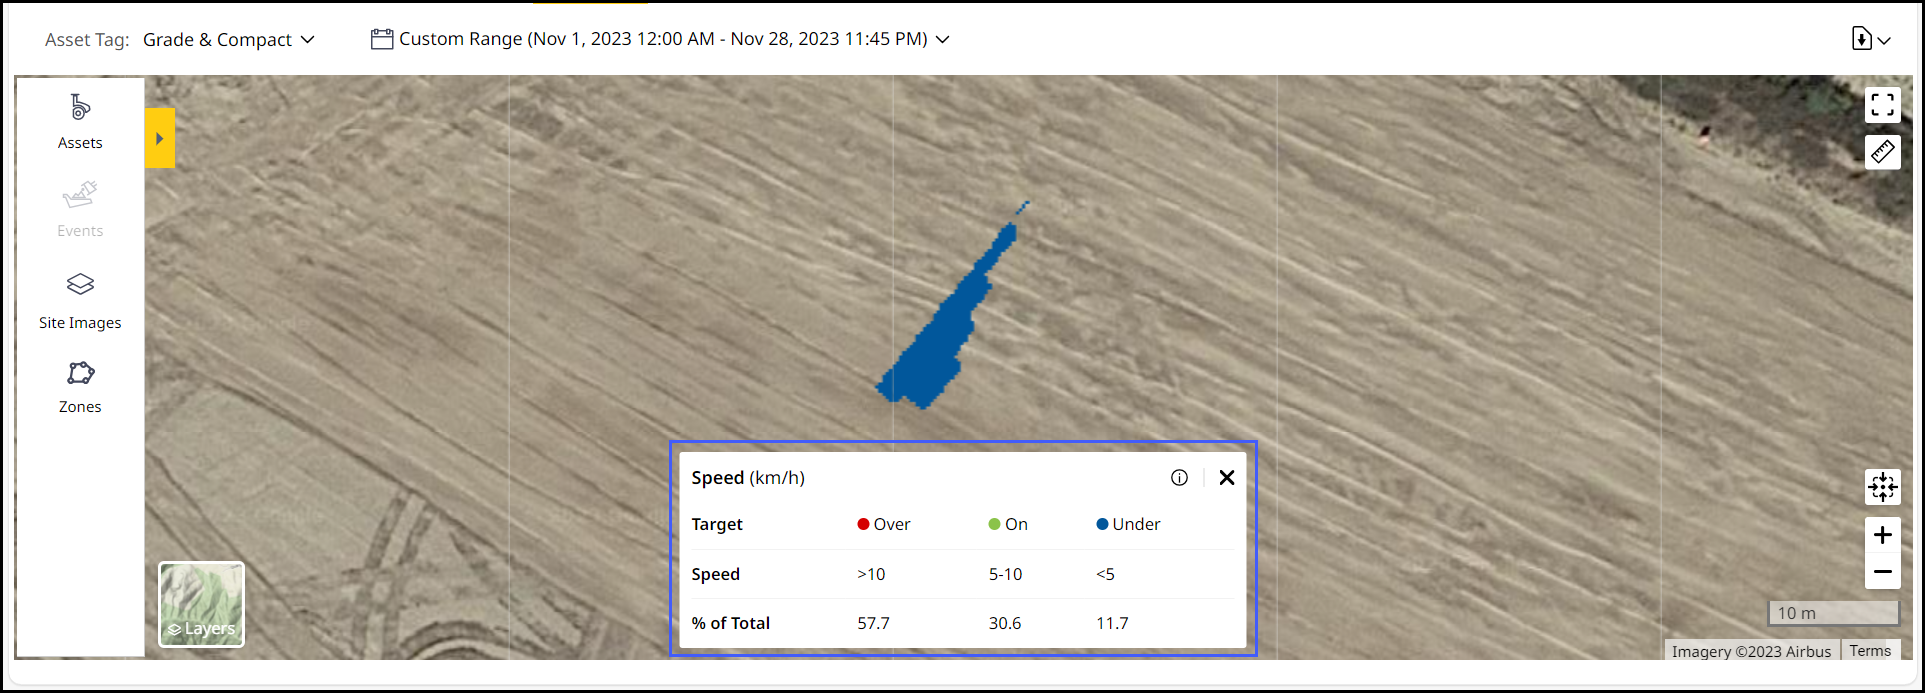
-
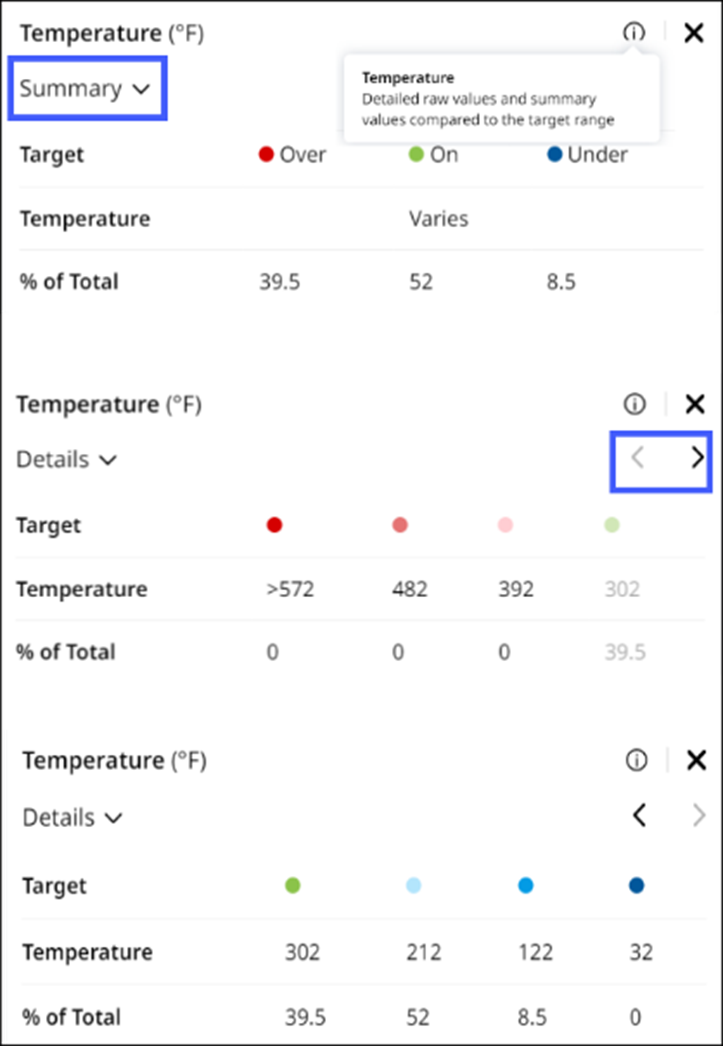
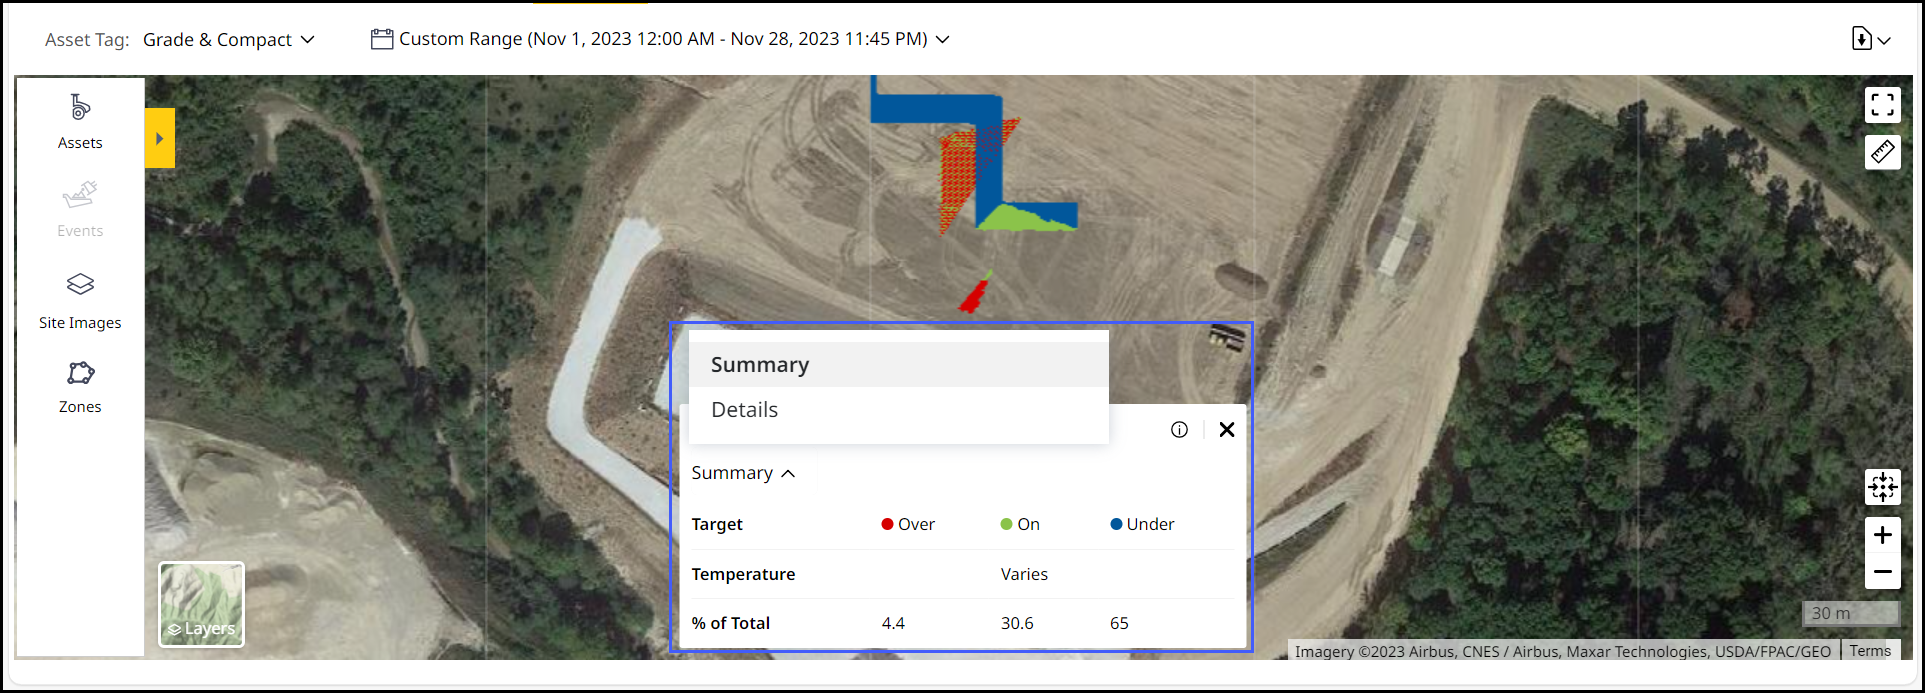
Temperature
 : It provides temperature data for compact assets that carry out compaction.
• View the following crucial information based on the target temperature set for compaction:
° Over the set temperature.
° On the set temperature.
° Under the set temperature
• You can view data in Fahrenheit (F) or Celsius (C) based on your set preferences.
View ImageView Image
-
Landfill Compaction Algorithm (LCA)
 : Monitor your compact assets and see when a layer is compacted using LCA.
Select one day and view the following information for single or multiple compact assets:
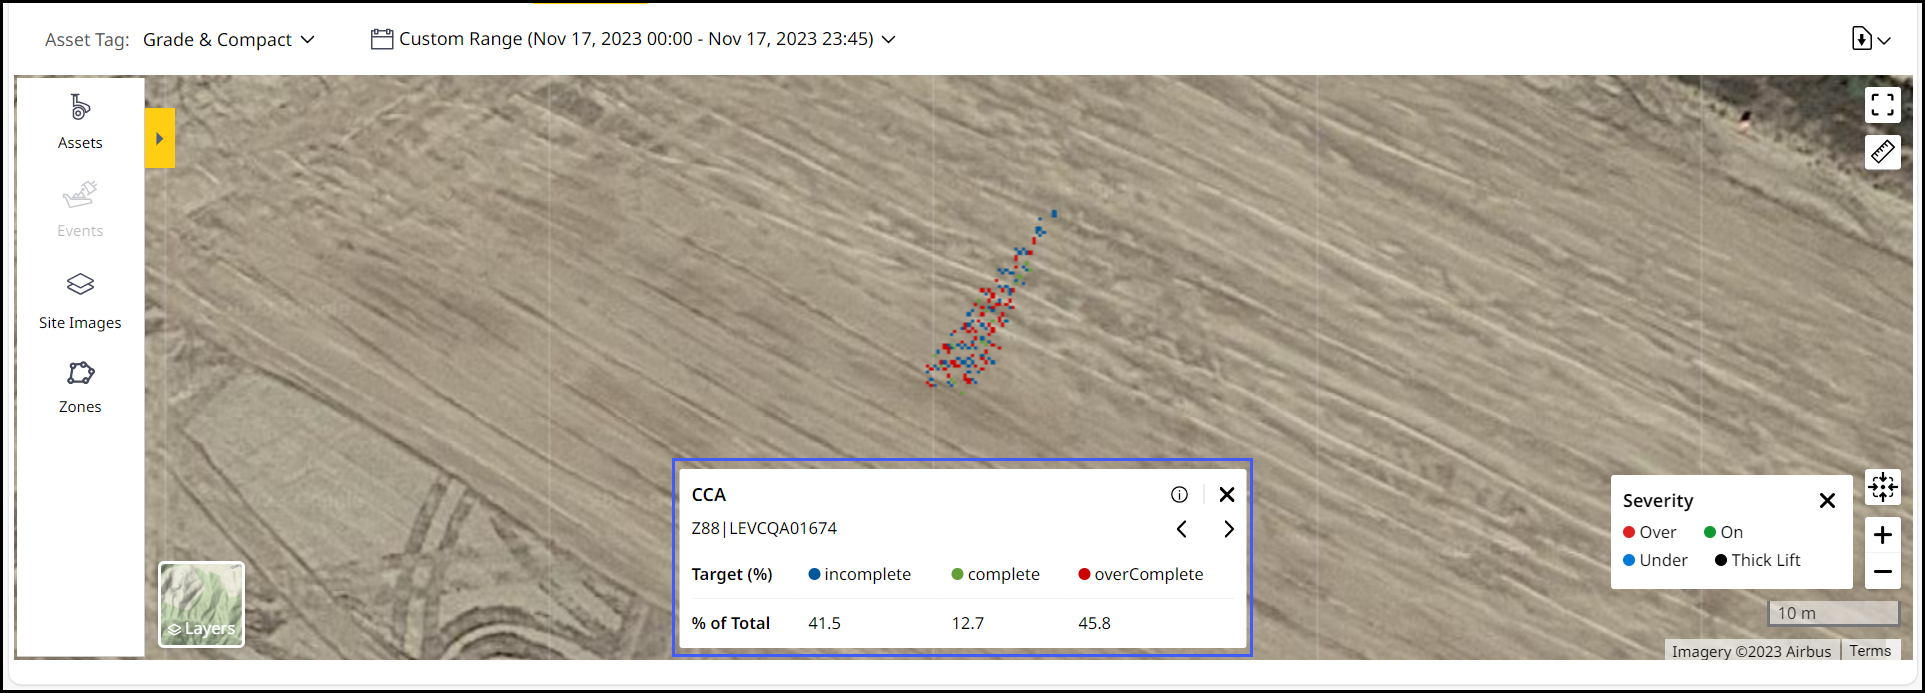
Landfill Compaction Algorithm (LCA) is an update to the previous Cat Compaction Algorithm (CCA) KPI. All other calculations to derive this KPI remain the same as before.-
Over the set target
-
On the set target
-
Under the set target
-
-
Lift (Layer)
Icon.png) : Monitor the thickness of the compacted material layer. It is applicable only for a single day selection for Grade and Compact asset types. To configure the lift threshold and view the details, follow the steps:
: Monitor the thickness of the compacted material layer. It is applicable only for a single day selection for Grade and Compact asset types. To configure the lift threshold and view the details, follow the steps:
If you select Lift (Layer) for the first time, you will be prompted to configure the lift threshold with the following message:
View ImageView Image

On Lift (Layer), you can view the following details:
-
In Lift Layer (Threshold), enter the threshold value. You can also change the unit of measurement to your preference.
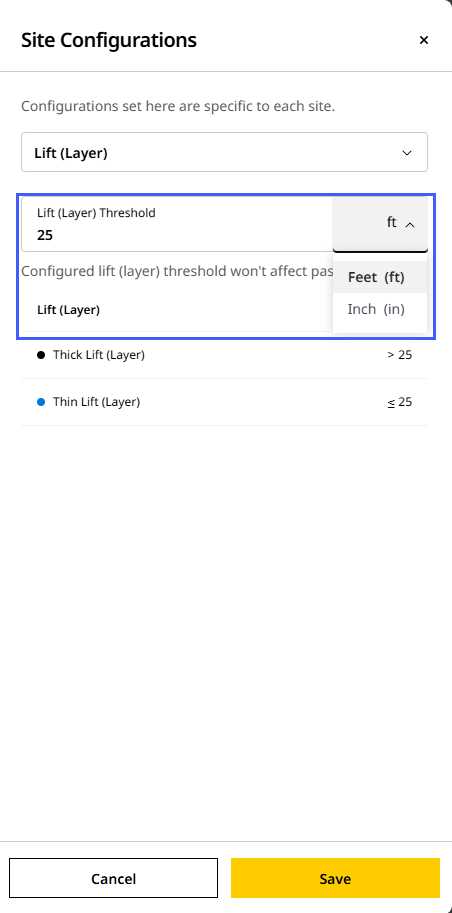
The displayed units of measurements are based on your selected preference i.e., either US Customary or International System of Units (SI Units). To modify this, refer to Preferences. -
Click Save to retain your preferences.

Any changes you make to the Lift (Layer) threshold values will take effect immediately. Also, note the following:
• The updated threshold values won’t be re-processed for past dates.
• Threshold value updates apply only to the current date and future dates.
-
Lift (Layer) Threshold: Displays the set threshold value.
-
Lift (Layer): Lists out the types of lifts: Thick Lift (Layer) and Thin Lift (Layer).
-
Area: Shows the total area covered by thick or thin lift conditions.
-
% of Total: Shows the lift area percentage.
Subscription Configuration
EC520 Grade Control Device (GCD) Capabilities
% of Total
[Area of thick or thin lift (layer) ÷ Total area covered by the asset] * 100
-
-
Map Type: Click to switch between Satellite
 and Terrain
  views respectively. The Satellite view uses high resolution images derived from satellites to display the map view.
The Terrain view shows a digital map of the site and surrounding areas.
-
Coordinates: Right-click anywhere on the map to view latitude and longitude details. Click copy
 next to it to copy the coordinates.
 -
Recenter: Focus back on the selected asset after panning.
-
Zoom In: View the desired event and zone details.
-
Zoom Out: View all the available event and zone details.
-
Cut/Fill Legend: Click to view a legend of work completed and work remaining.
-
Map Tools: View the following map tools:
-
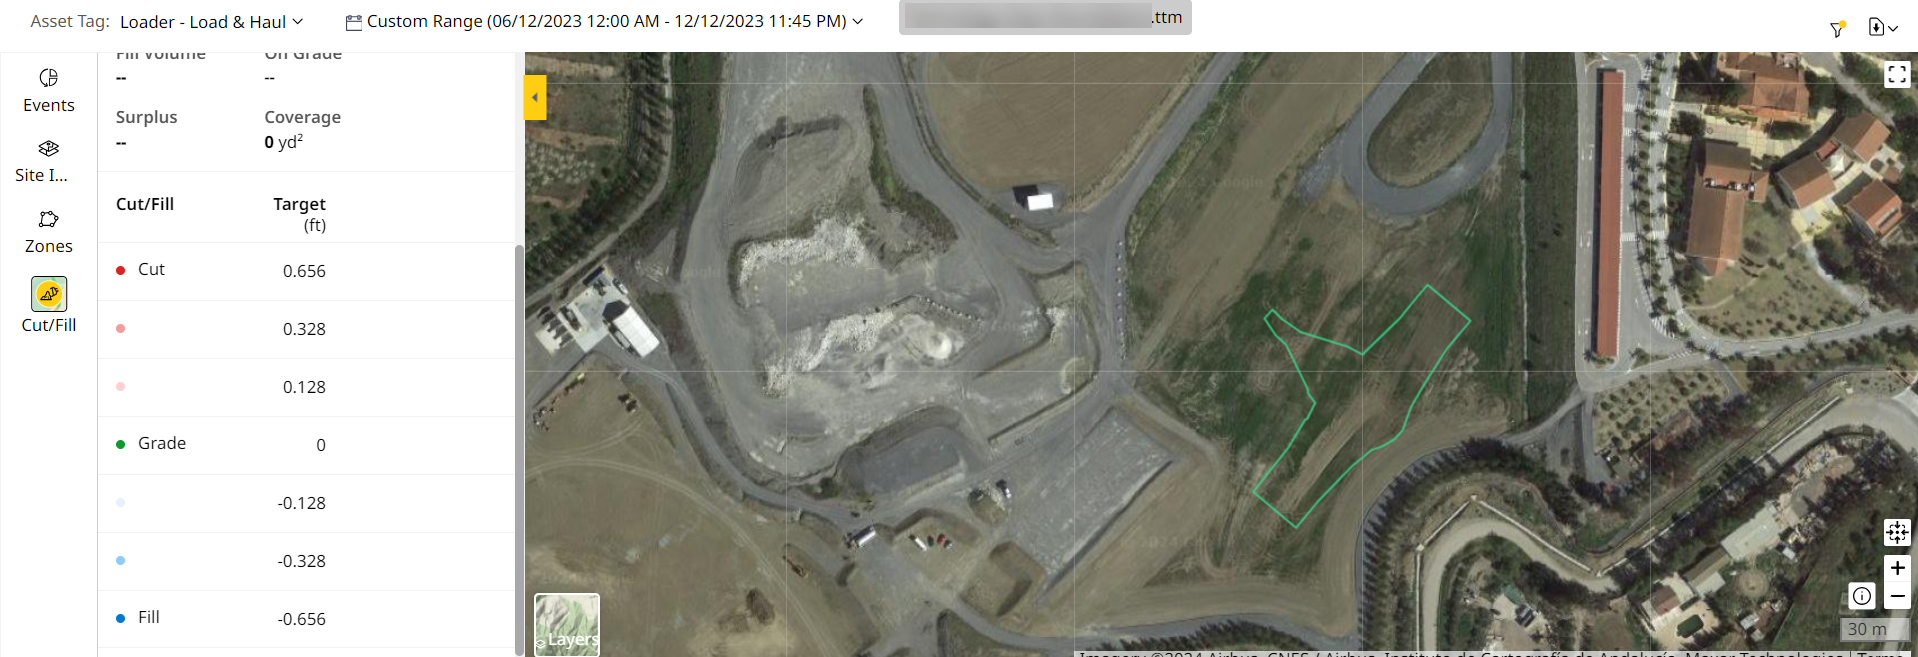
Zone: Draw a single closed polygon on the map. Analyze specific calibration (.cal) file-enabled KPI data within that zone.
To draw a zone for your site:
-
Hover over Layers > select More > choose the KPI you want the zone details for.
-
Navigate to Layers > More > Map Tools > select Zone.
-
Click three or more points on the map and double-click to finish creating the zone.
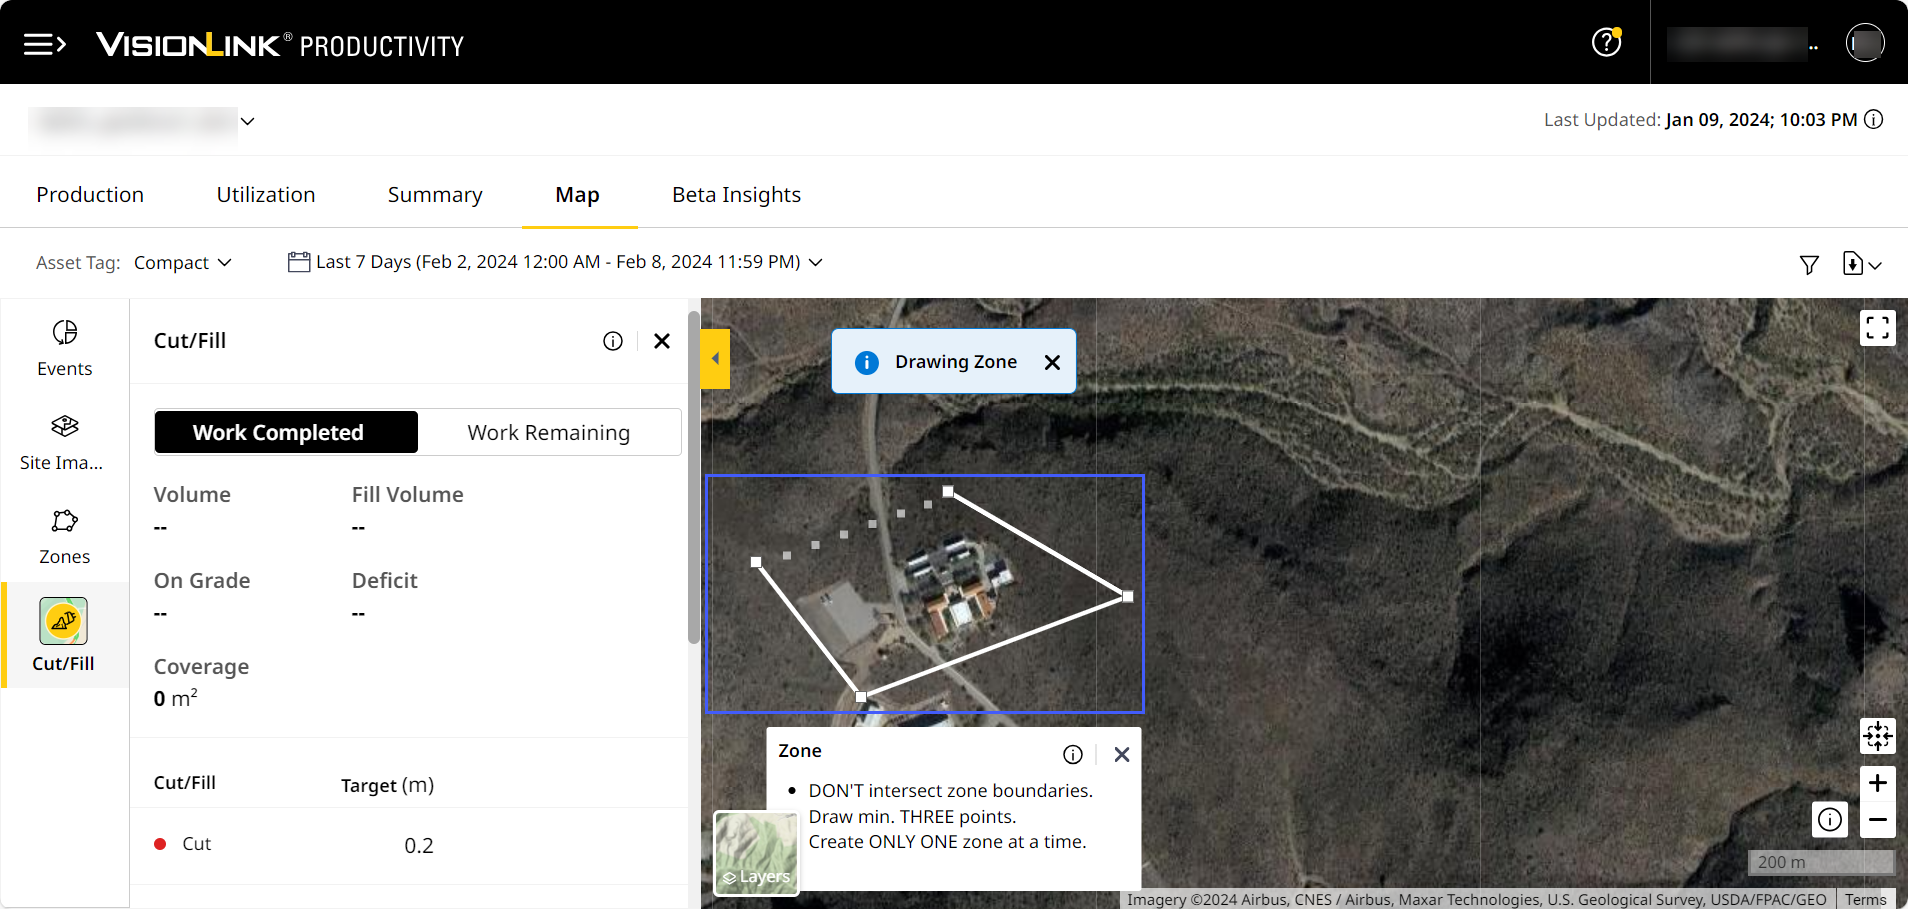
-
This displays the selected KPI data calculated for only that drawn zone. You can also view the total area selected.
• Click Edit to make any further changes to the zone.
• Click close to delete the zone.
• The larger the selected zone area, the longer it will take for the map view to load.
• Once you create this zone, you can download the volume and density data of the zoned area as a .csv file. Refer to Volume & Density to know more.
• You can also schedule a report for the created zone’s volume and density data. Refer to Volume & Density to know more.
View ImageView Image
• Zone is available for the following Map Details:
◦ Cut/Fill
◦ CMV
◦ MDP
◦ Pass Count
◦ LCA
◦ Temperature Caution: The data displayed is temporary and may disappear if you
• switch to another map detail that doesn't support Zone,
• exit the page,
• switch to another Asset Tag or
• change to another Insights tab.
-
-
Elevation Profile: With Elevation Profile, click two or more points on the map and generate an elevation profile between selected points. This helps you visualize KPI data for the profiled path.
This is applicable only for the following:
• Grade, Compact or Grade & Compact asset tags.
• Selection of Map Details > Elevation or Cut/Fill KPIs.View first, last, highest and lowest pass information and generate elevation profile for haul roads and cut/fill areas.
To draw an elevation profile for your site:
-
Click Layers > navigate to Map Tools > select Elevation Profile.
-
Click two or more points on the map and double-click to finish creating the elevation profile path.
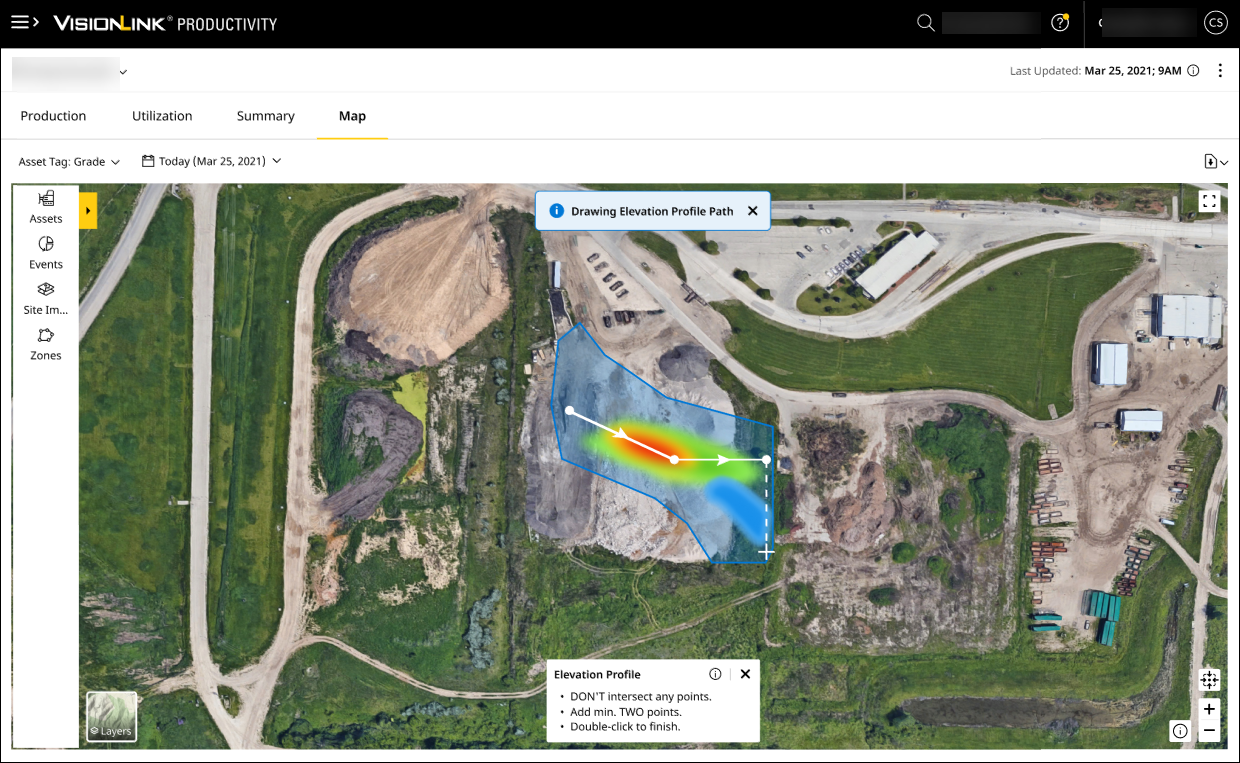
-
The elevation profile displays as line chart with available data.
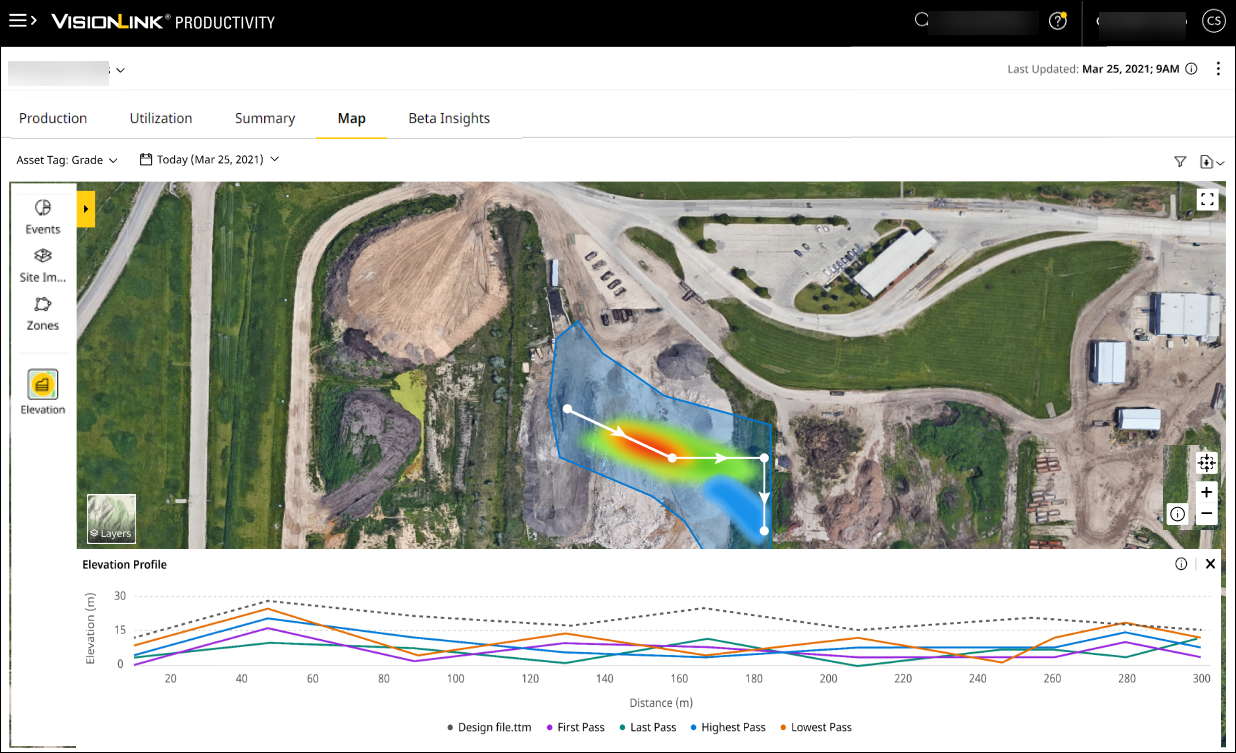
In some instances, only parts of data will be available and there may be data missing from the line chart. Caution: The data displayed is temporary and may disappear if you
• switch to another map detail that doesn’t support Elevation Profile,
• exit the page,
• select another Asset Tag or
• change to another Insights tab.
-
-
Distance: Click to draw lines for measuring distance and area. It is also useful in connecting lines through points to draw polygons on the map. The map displays length of each line as it is traced.
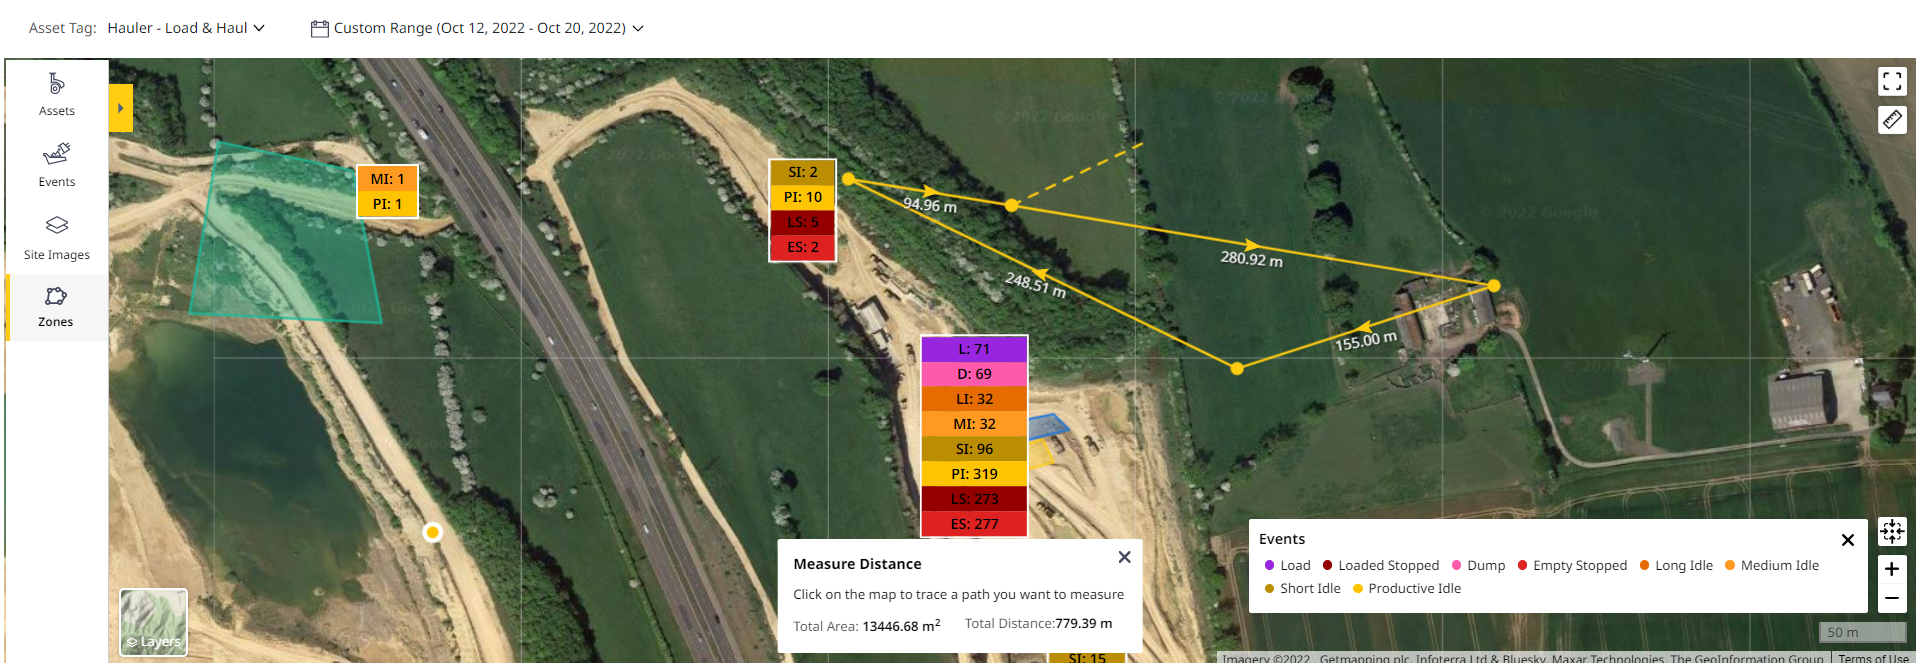
-
Click twice to finish drawing a line and delete the line by clicking on a specific point.
-
On clicking distance
 , a Measure Distance pop-up is displayed on the map. It displays the auto-calculated Total Distance and Total Area of the traced path.
 -
Multiple lines can be drawn on a map using the polyline tool and the cumulative total distance will be displayed in the Measure Distance pop-up.
-
The polyline measure can be turned off by clicking the close
 .
.
-
-

Tag File Creation
Grade assets generate tag files that are added to Insights Map to help view and track Map Details.
Upload the following files and configure as mentioned below to generate and share a .tag file:
-
Site calibration (.cal) file to the asset.
-
Site design (.ttm) file to the asset.
-
Site geodata files to the asset.
-
Apply Global Navigation Satellite System (GNSS) Real Time Kinematics (RTK) corrections to the asset using RTK or Universal Total Station (UTS) and not GPS.
-
Create a valid site boundary on VisionLink Productivity to display the created .tag files.
Supported Tag Files
Currently, we process tag files generated using RTK and UTS machine control corrections.
• Calibration file project must have the same calibration (.cal) file uploaded to the VisionLink Productivity project as used by the asset.
• Tag files generated outside of the site boundary won’t be processed.