August 2021
View All Assets’ Productivity Details at a Glance
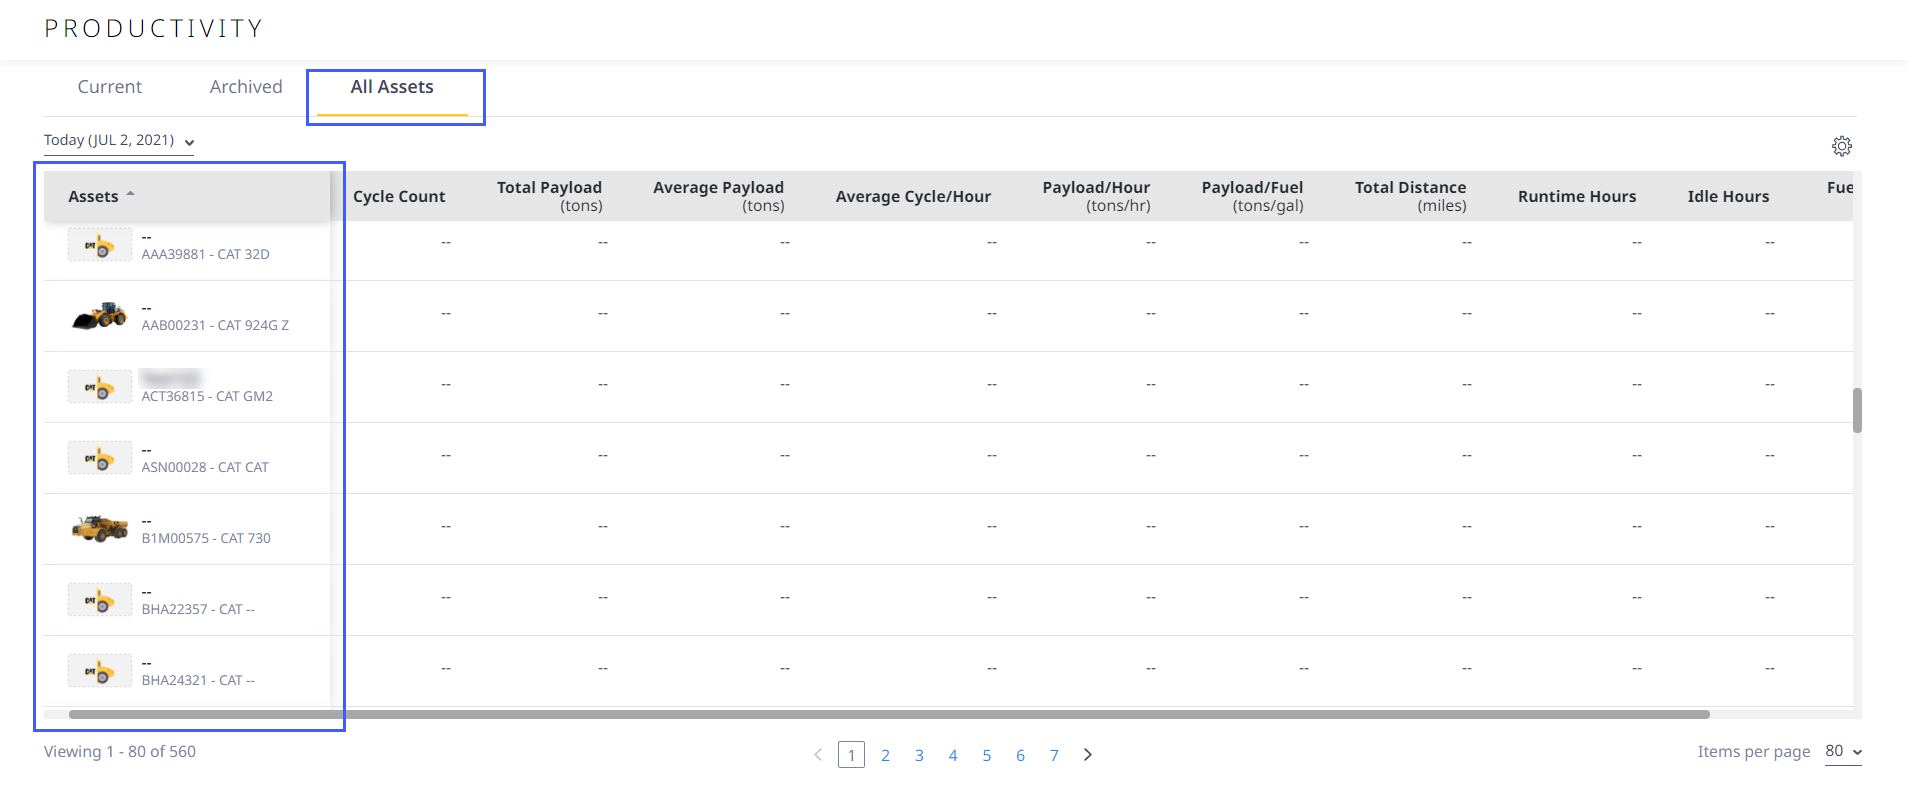
Under All Assets in Sites Dashboard, you can now not only view all their assets at one place, but also see many of their productivity KPIs. With configure columns ![]() , customize the table with the available parameters.
, customize the table with the available parameters.
Scheduling Shifts Gets More Detailed and Flexible
In Assign Schedule, now add multiple shifts for a single day, set different shifts for different days of the week or add a shift for all days of the week. You can not only select shift timings on an hourly basis from the drop down, but also edit the minutes manually.

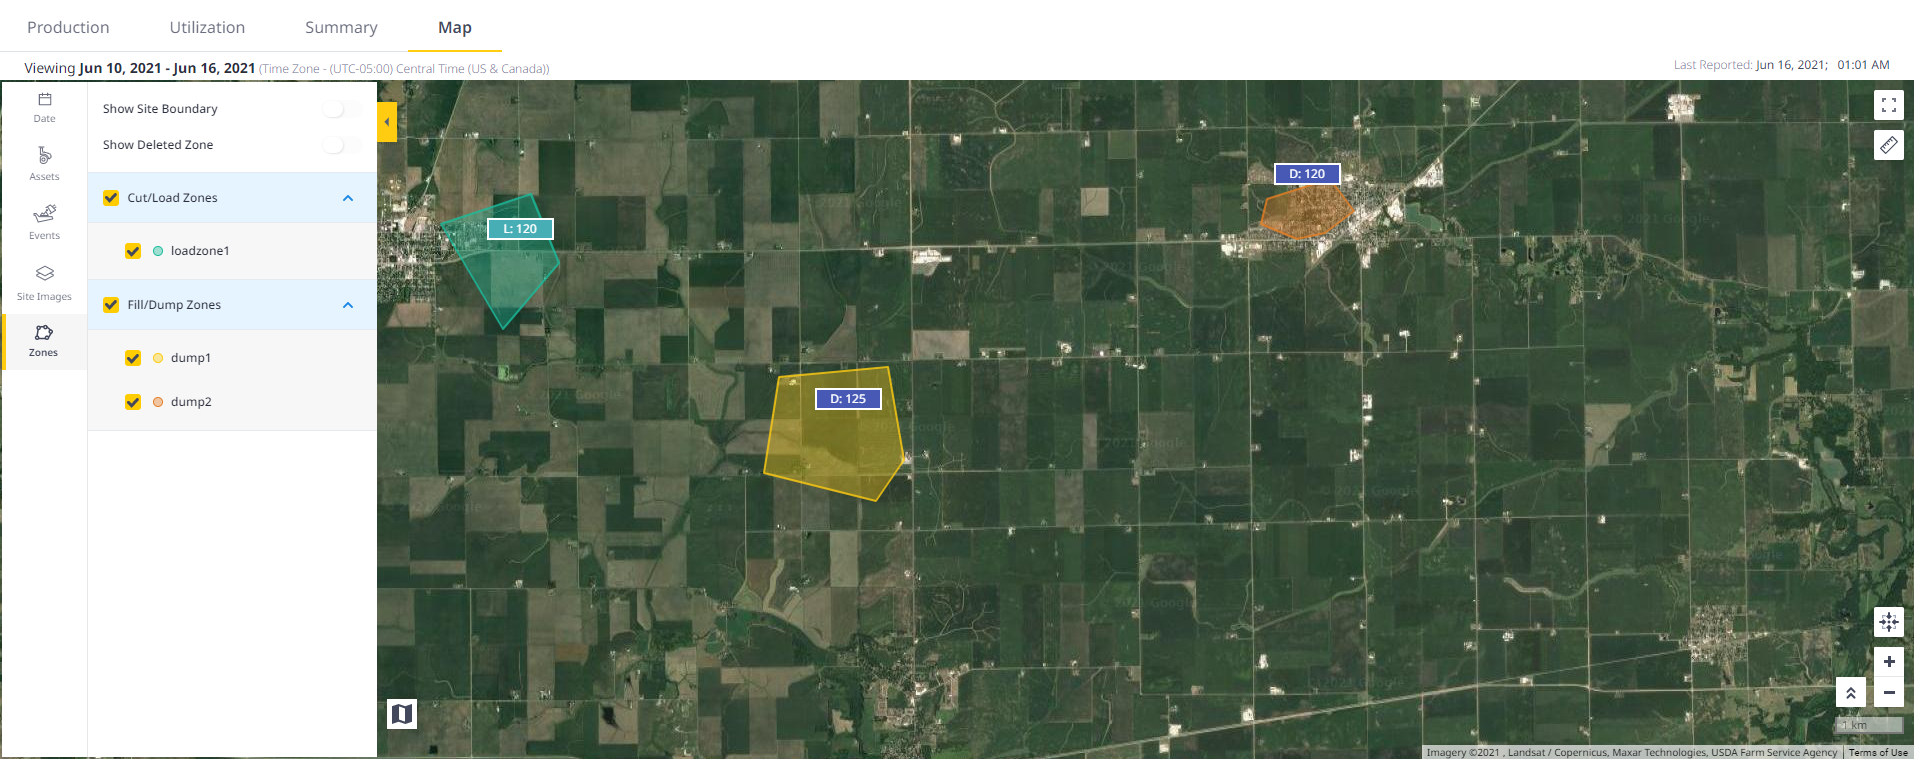
Visualize Sites Better with New Map View
Get to know you sites more clearly with the all new Insights Map. Details about the different assets, zones, site images and events are easily displayed alongside the latest uploaded images of the site.
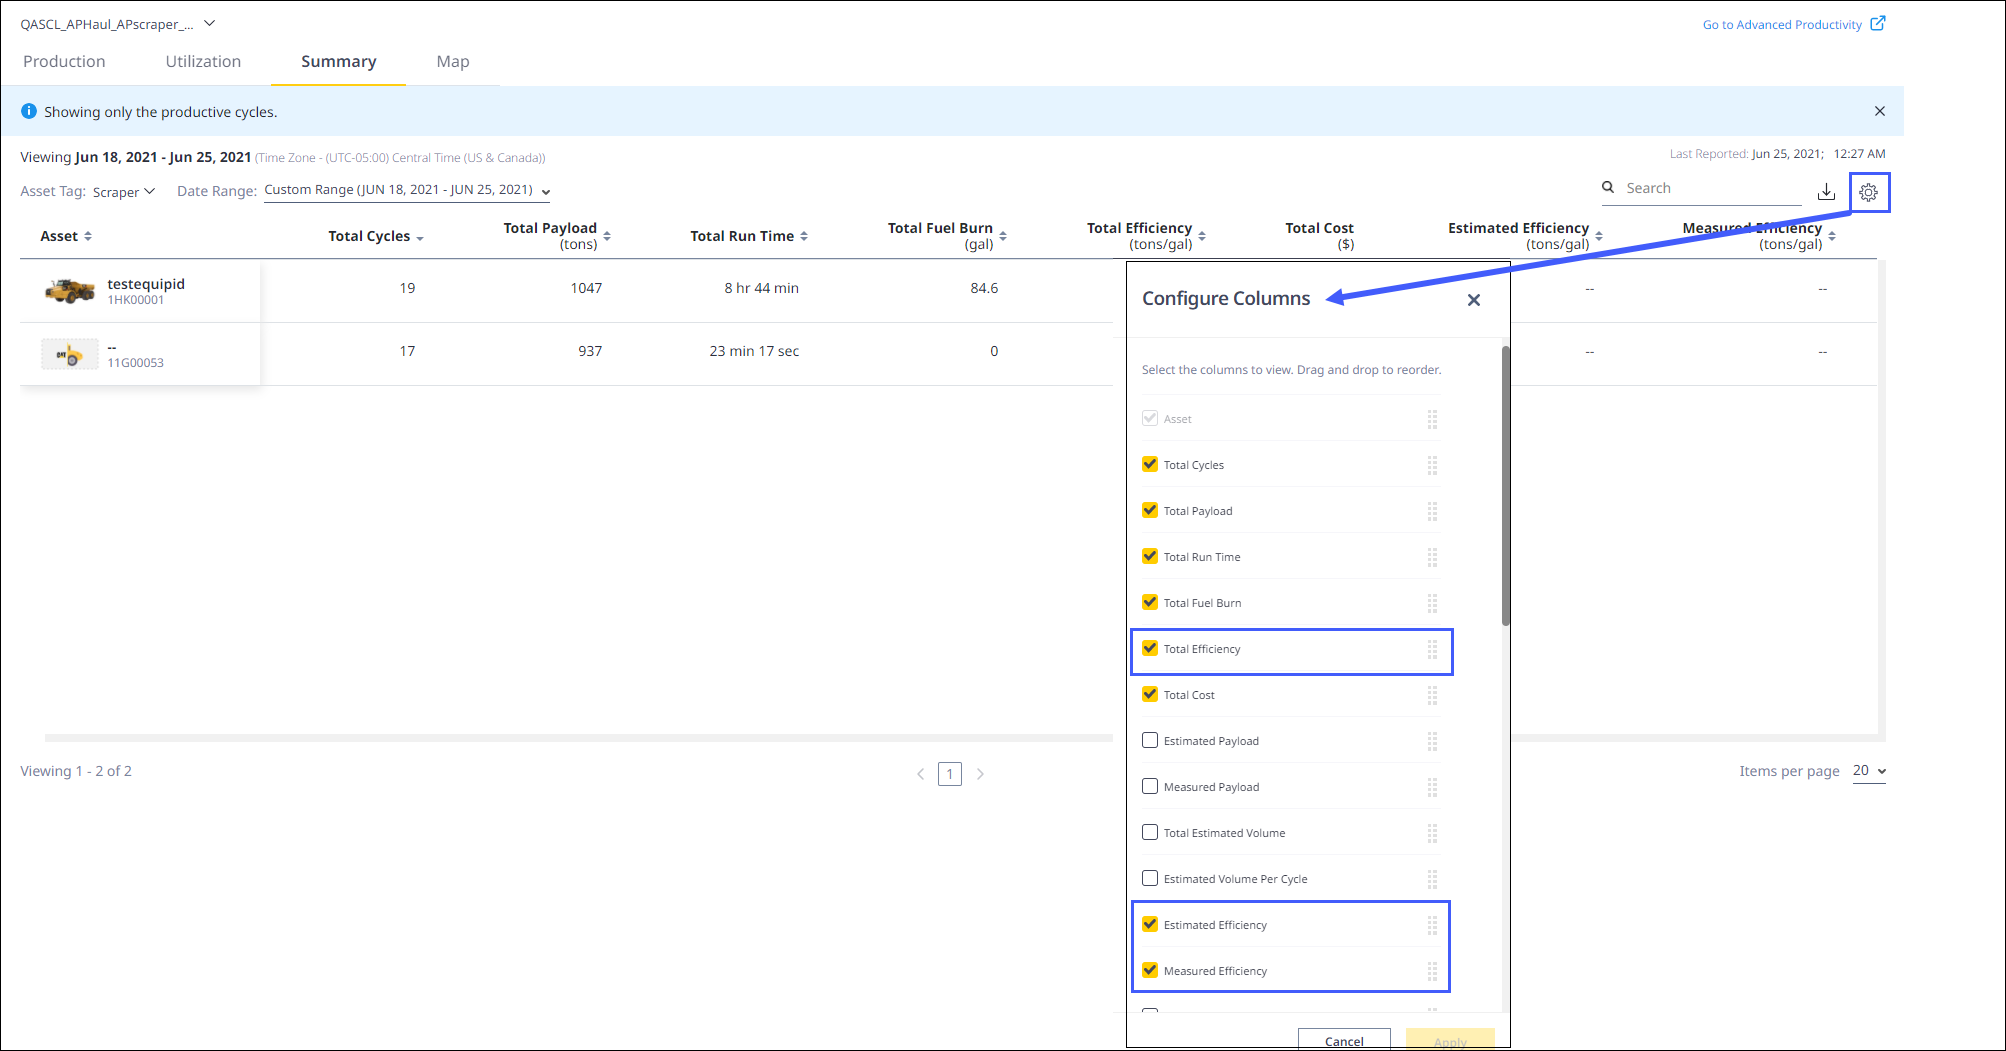
Efficiency KPIs Now Available Under Productivity Insights Summary
The efficiency KPIs in the Summary of Productivity Insights will help you analyze the operational efficiency of an asset based on the payload it moves and the amount of fuel it consumes in the process. Add these KPIs from the icon ![]() under Summary.
under Summary.
High Cycle Time in Site Management Resolved – CPI 484512
Sorting the output data and adding Engine Off as a new segment Key On-Engine Off provides greater clarity on long cycle duration; it resolves the issue of long segment durations assigned to Loaded Stopped and Empty Stopped events.
High Fuel Burn Rate Utilization Variations Resolved - CPI 494936
[Difference in Fuel Burn rate utilization between MCC, VL and Advanced Productivity]
Revisions in the calculation methods and data extraction process for Fuel Burn Rate help to neutralize the variations in the utilization data during some runs.