- + jobsite
- acceptable use policy
- account
- add user
- android
- answer
- april 2020
- archive
- asset tags
- assets
- assign schedule
- august 2020
- august 2021
- august 2022
- Average
- body up switch
- browser
- carbon footprint
- card error
- change KPI
- chrome
- CO2 emitted
- cookie
- copy site
- copyright
- cost kpi
- cost setup
- cost tab
- create
- currency
- custom list
- cut/fill
- dashboard
- december 2019
- december 2020
- december 2021
- delete site
- delete user
- digital offering
- dollar
- edit site
- edit targets
- edit user
- euro
- exemption
- FAQ
- favorite
- february 2020
- fill/dump
- filter
- firefox
- fleet
- frequently asked questions
- geofence
- getting started
- grid
- guide
- help
- ID
- insights reports
- introduction
- ios
- january 2020
- january 2021
- january 2022
- july 2020
- june 2022
- KPI
- KPI hierarchy
- landing page
- legal
- list
- list summary views
- load site
- login
- logout
- machine
- map tab
- march 2021
- march 2022
- material
- material list
- may 2020
- may 2021
- may 2022
- measurement
- more option
- november 2021
- october 2020
- october 2021
- october 2022
- overview
- playback view
- policy
- preferences
- primary KPI
- production tab
- productivity
- productivity insights
- question
- remove site
- renminbi
- report management
- report type
- restore site
- review
- safari
- schedule
- select assets
- september 2020
- set name and location
- shift
- shift comparison report
- step 1
- step 2
- step 3
- step 4
- step 5
- stockpile
- summary tab
- support
- telematics
- total cost
- user
- visionlink
- walkthrough
- zones
Utilization (Site) Tab
With Utilization on Site Summary, you can track all utilization KPIs such as:
-
Working & Idle Hours
-
Runtime
-
Distance
-
Working & Idle Fuel Burn
Learn how your assets are being utilized. Optimize for wastage and maximum productivity. Find out how far your asset has traveled and for how long.
Use utilization data to plan downtime, maintenance, and more.
-
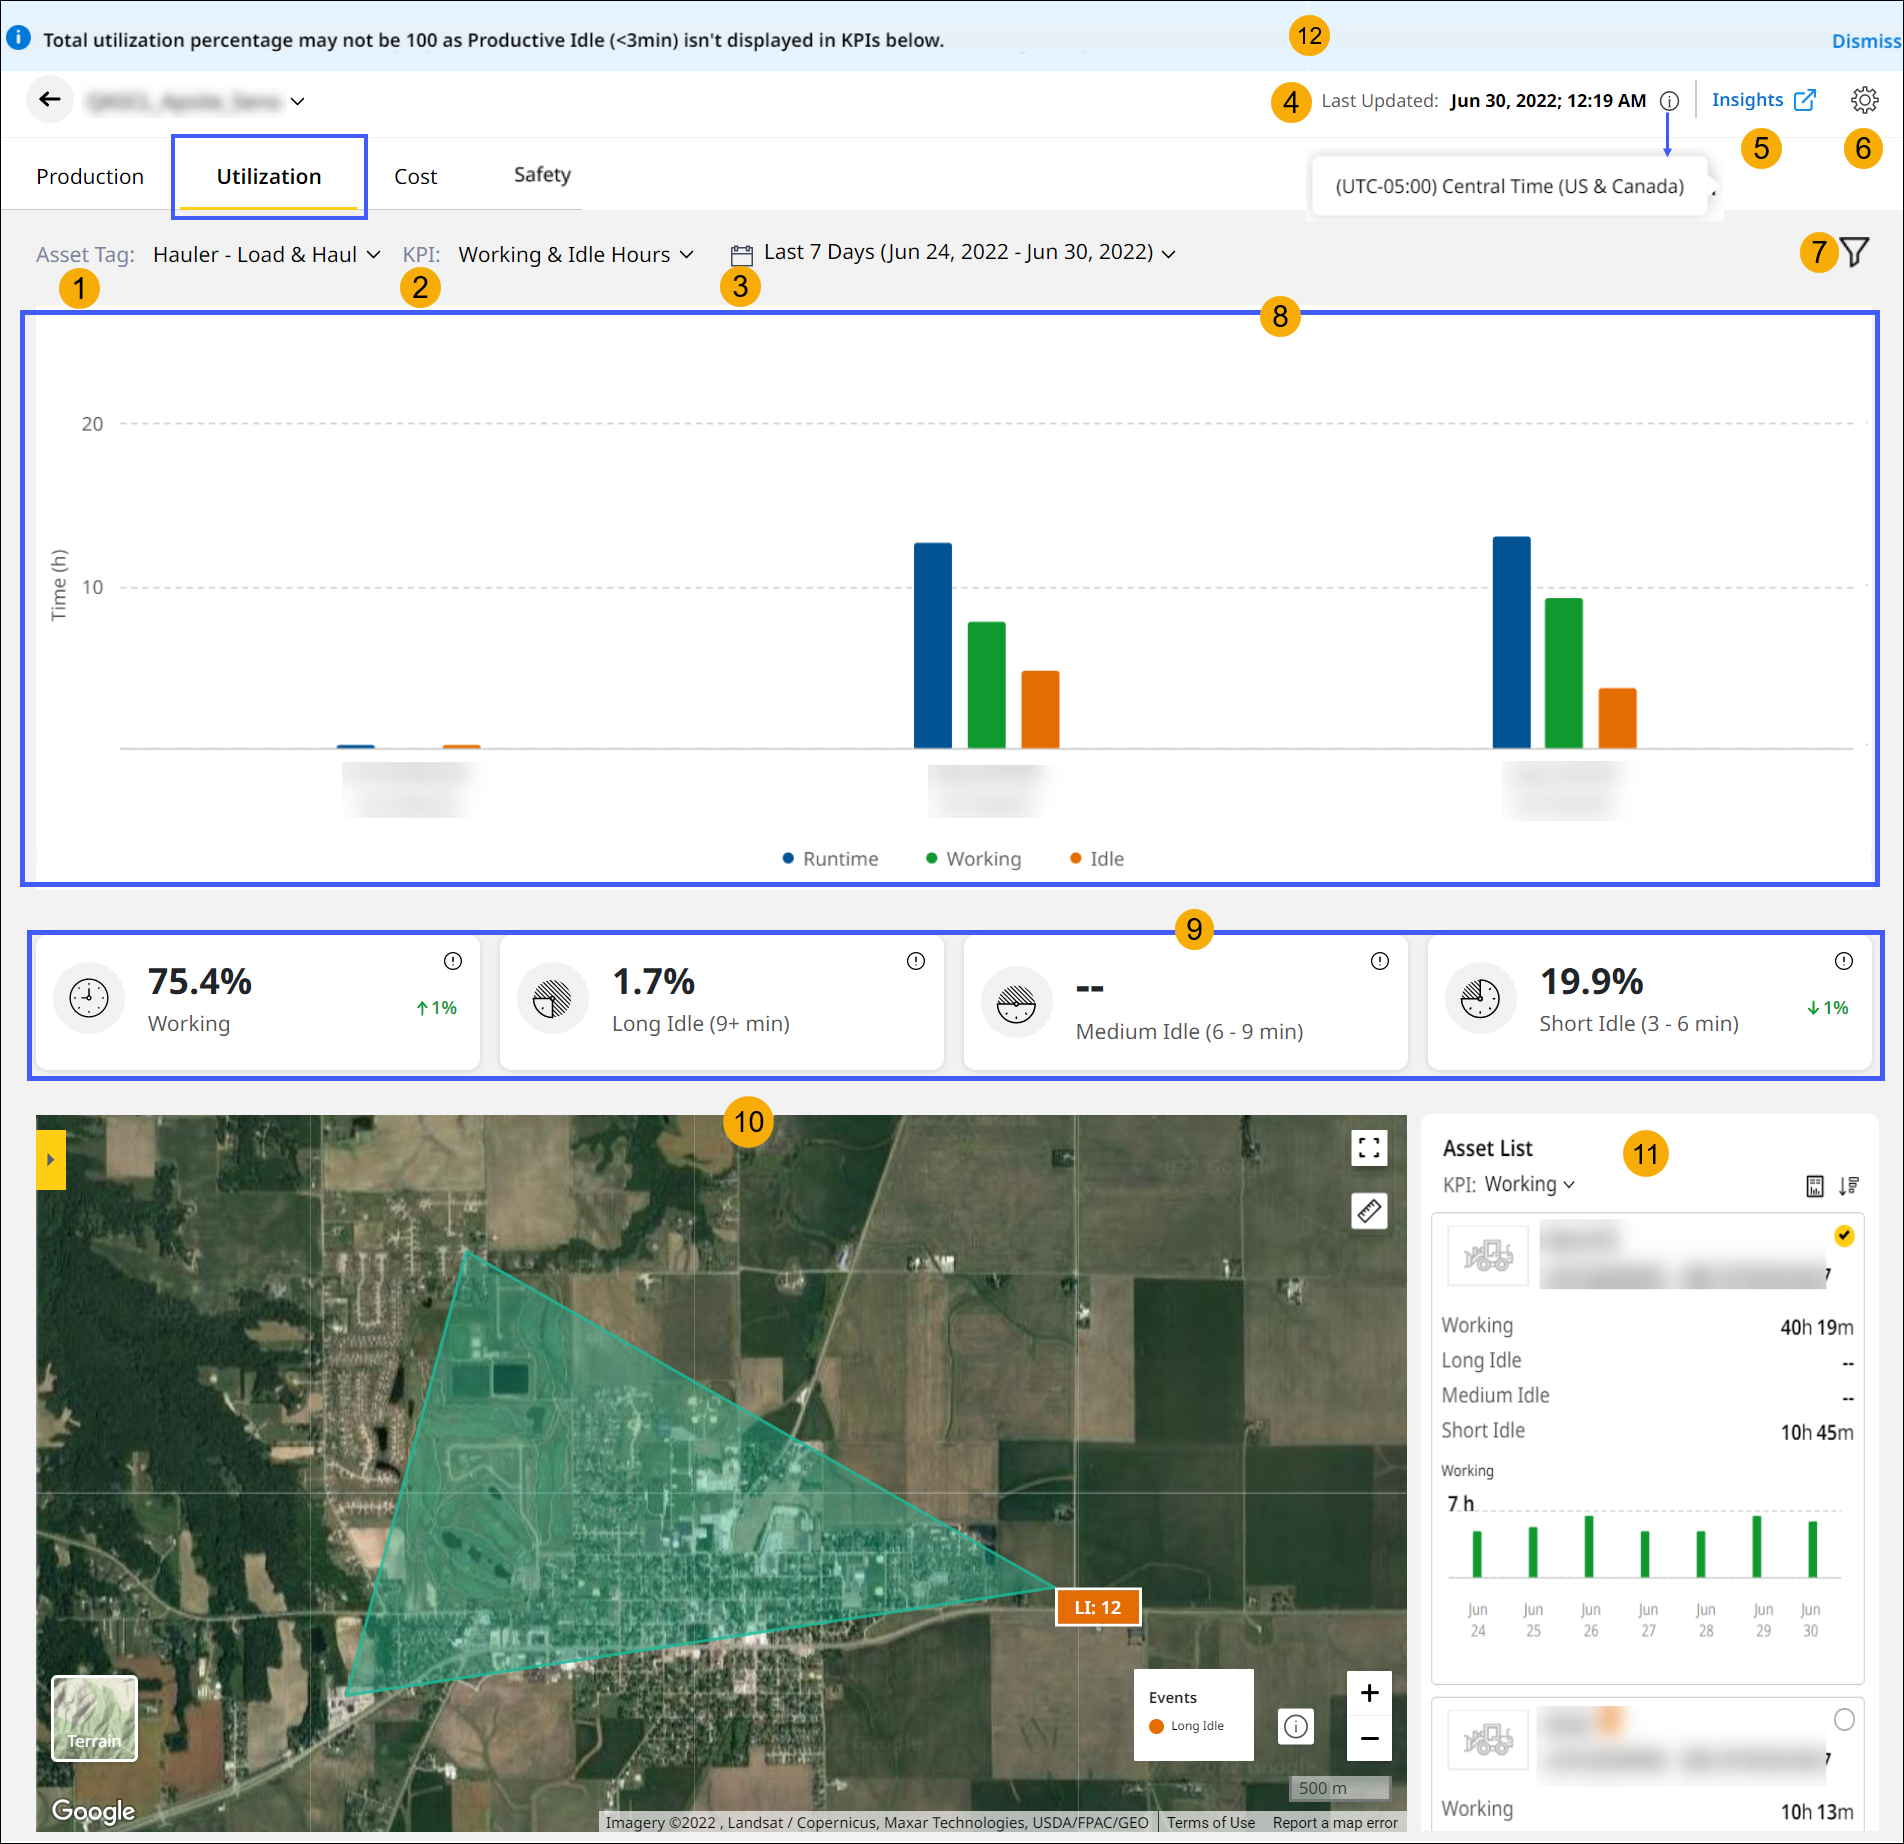
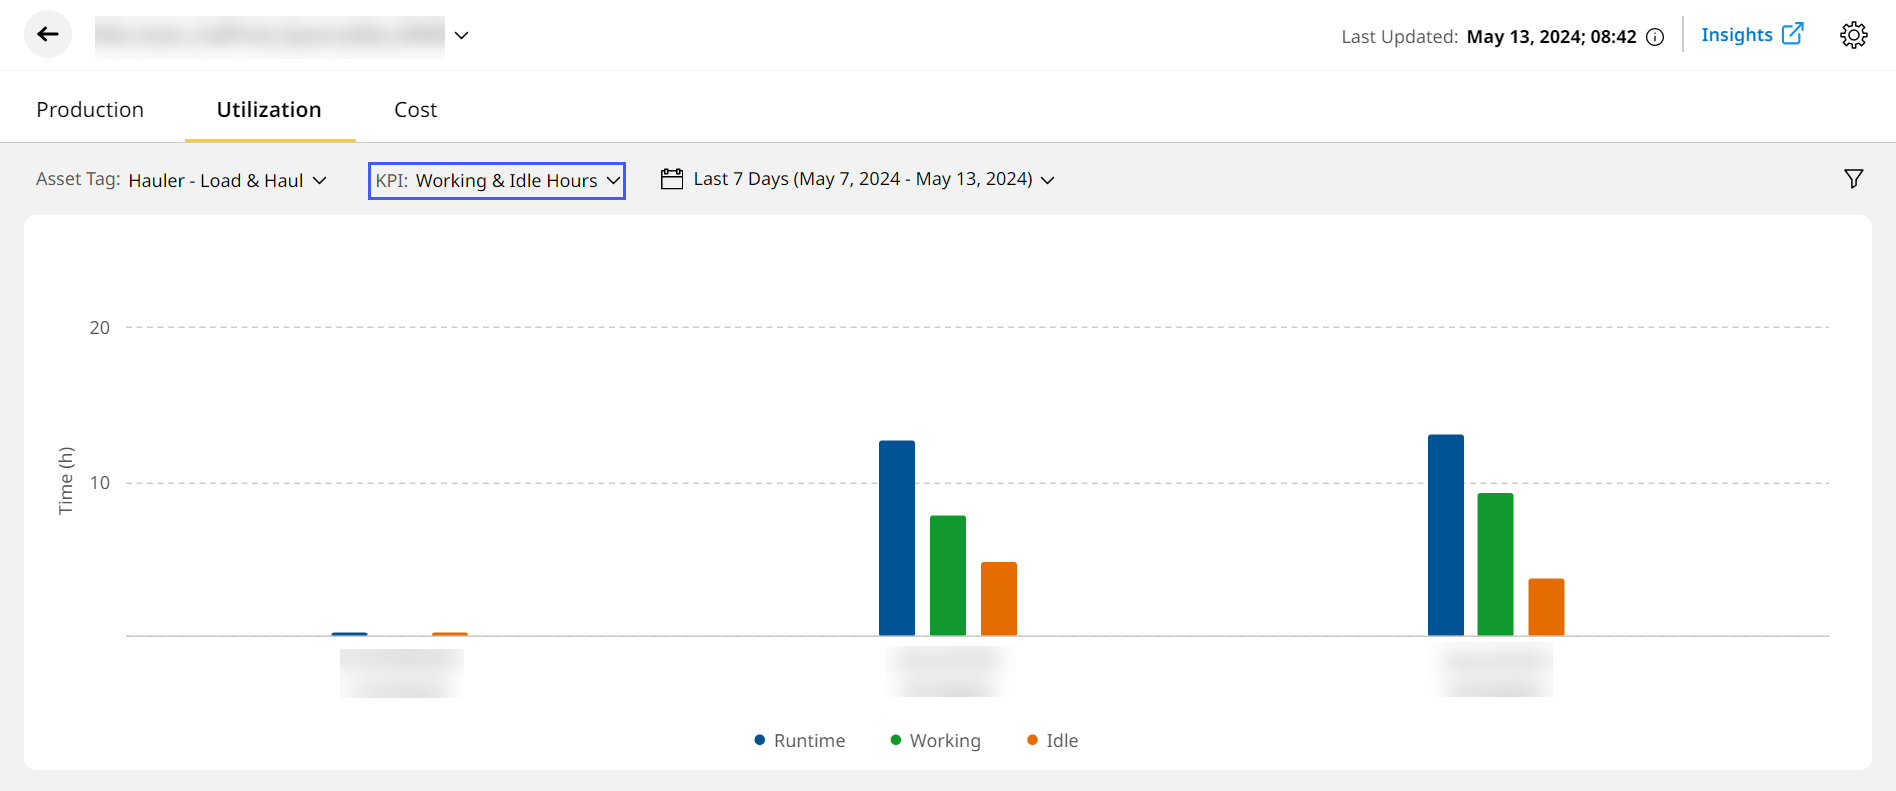
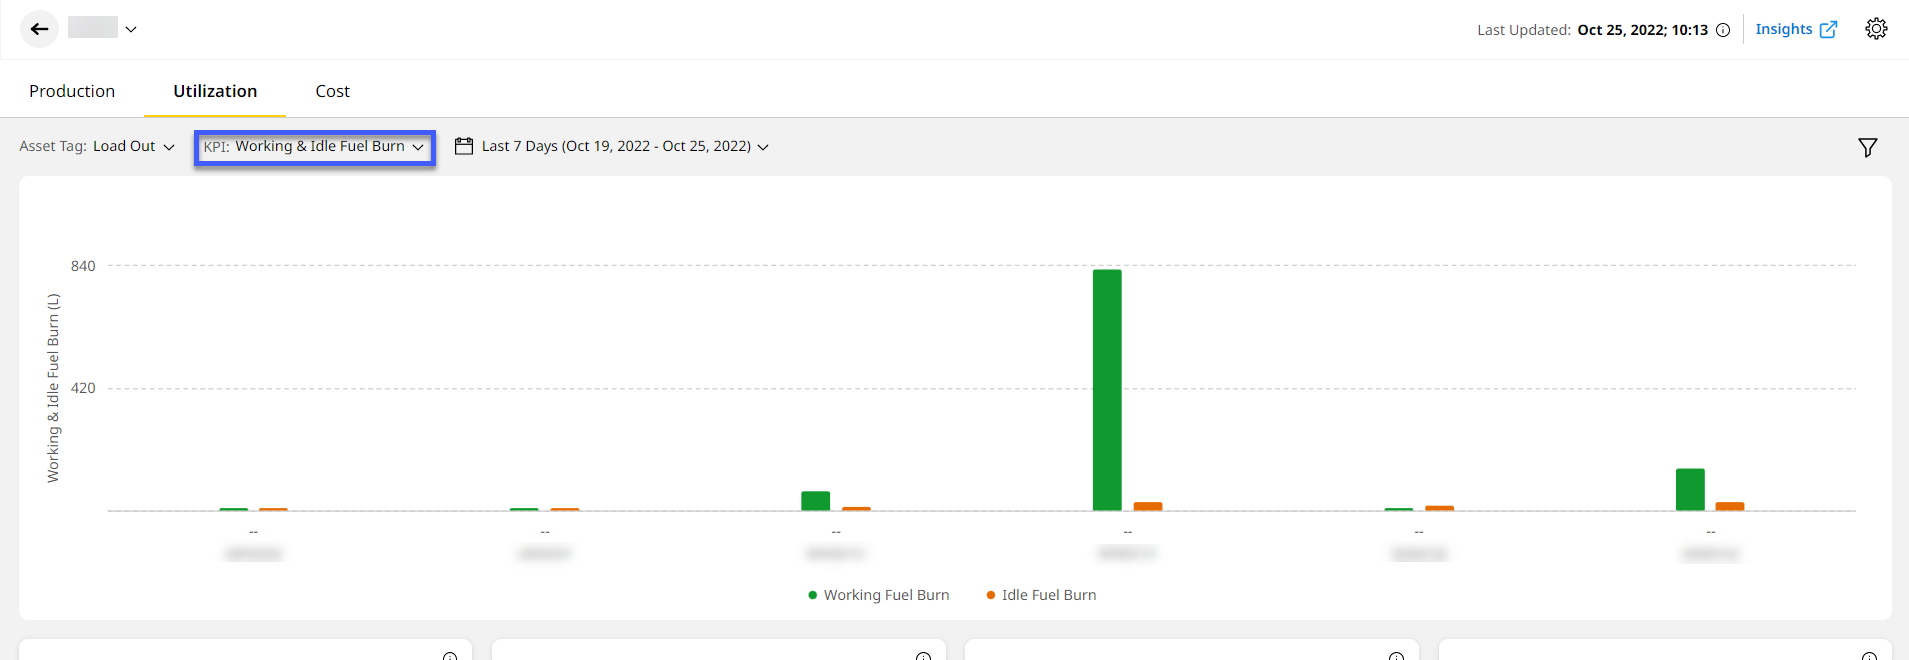
Asset Tag: Select an asset tag.
-
KPI: Select a utilization KPI to view the following data:
-
Working & Idle Hours: Displays comparison of total runtime, working and idling time of the site and asset tag for the chosen date range.
In case neither working nor idling time data is available, the columns on the chart view will display runtime data.Here, the values are calculated as follows:
-
Movement-based utilization logic for Hauler – Load & Haul and Scraper asset tags.
-
Machine-based utilization logic for Loader – Load & Haul, Load Out, Grade, Compact and Support asset tags.
-
-
Working & Idle Fuel Burn: Know how much fuel your asset(s) burn through while working versus idle within the site for the chosen date range.
-
-
Date Range: Set the date range to get data for Today, Yesterday, Last 7 Days or a Custom Range.
-
Last Updated: View the timestamp of the last reported data. Click info
to view the time zone (country/city) of the selected site.
-
Insights: Click
to open Insights.
-
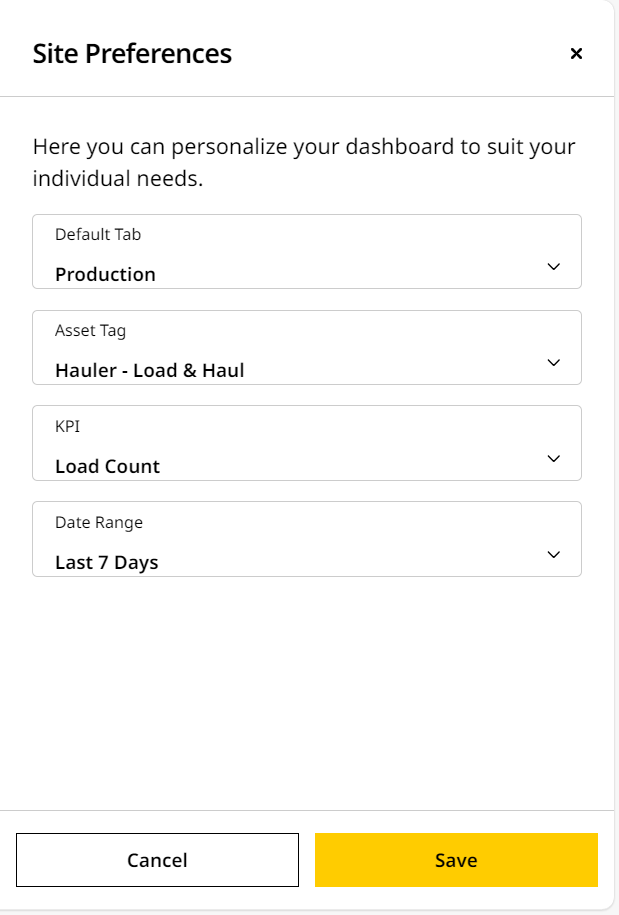
Site Preferences: Customize Site Summary to fit your needs. You can change the Default Tab, Asset Tags, KPI, and Date Range.
-
Filters: Filter based on single or multiple asset IDs and shifts for a selected date range, asset tag and KPI.
-
Chart View: Displays the data as charts based on selected KPI, asset tag and date range.
-
KPI Cards: The KPI cards display data for the asset tags based on the KPIs selected. The default KPIs are:
Working & Idle Hours
Working & Idle Fuel Burn Working Time Fuel Burn Rate Long Idle Time Idle Fuel Percentage Short Idle Time
Idle Fuel Burn Medium Idle Time Total Fuel Burn -
Map View: Displays Events and Zones plotted on a map. The common events are Long Idle and Medium Idle.
-
Open the slider pane to select or deselect any zones or events to view. Events are clustered by default for locations where multiple events occur.
-
Click on the cluster to zoom in and view individual event hotspots.
-
Click on a hotspot to view the info card that has the Asset Icon, Asset ID, Serial Number, KPI data, timestamp, and Playback View.
-
Use the navigation arrows on either side of the info card to view details of other events in the same location.
-
If you're confused about which icon represents, the following table makes each icon's functionality clear:
Items
Features
Description
Zoom In
Zoom in the map for viewing the desired asset’s load and dump events in map. Zoom Out
Zoom out the map for viewing all the available asset’s load and dump events in map. Satellite View the map in satellite mode. Terrain View the map in terrain mode. Slider
• Check and visualize events (dump, load, etc.).
• Select and visualize Site Images.
• Select or deselect Zones (if created) on map view.
• Toggle on/off site boundary.
• Toggle on/off deleted zones.
Double Up Arrow
View legend events on the map. Full Screen
Expand entire screen of map view. Polyline Draw lines on the map for measuring distance and area. Connect lines through points to draw polygons on the map.
• When you click the polyline measure icon, the following measure distance pop-up is displayed on the map:
View Image
• The auto-calculated distance and area are displayed for the traced path on the map and measure distance pop-up.
• The drawn line can be completed by double-click on the plotted point and can be deleted by a single clicking on the specific point.
• The polyline measure can be turned off by clicking the closed icon of the measure distance pop-up.
-
-
Asset List: Find list of all the configured assets in the site and a brief overview of each.
-
Notification: Displayed only if the summation of four KPI values for Hauler – Load & Haul and Scraper does not equal 100 percentage. This occurs due to non-availability of productive idling calculation.
-
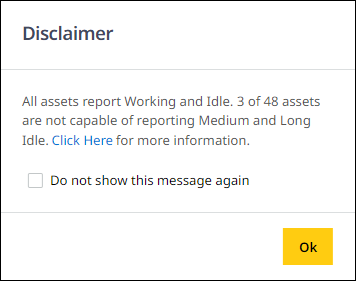
Disclaimer: This indicates the number of assets for which KPI values are calculated based on cumulative utilization logic. This does not report Short, Medium and Long Idle for chosen date range.