Cost (Site) Tab
View and estimate overall cost breakdowns of a selected site on Cost tab of Site Summary.
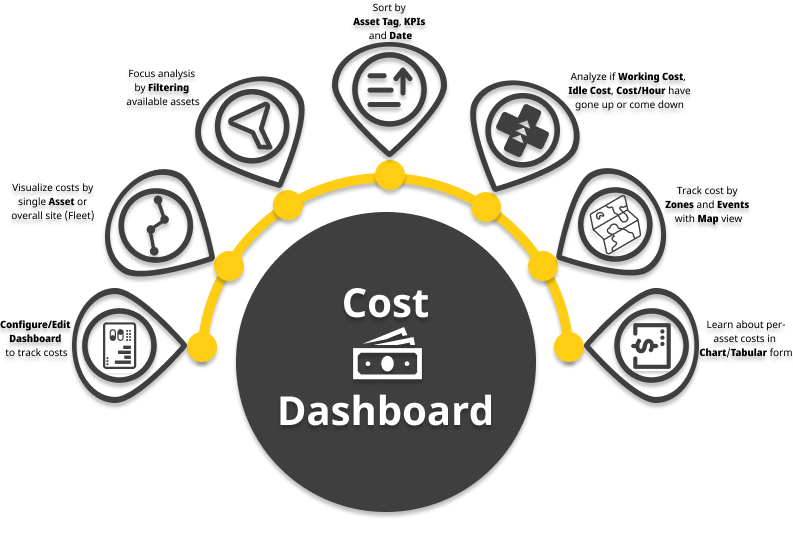
After configuring the cost dashboard, you can view here displays the site's Cost KPIs in chart and map view. View and select KPIs from the drop down.
The application calculates cost values using utilization data and current cost configurations.
So, historical data will be based on the cost configurations at that time and any changes made to the configuration will reflect on the calculations from then onward.
-
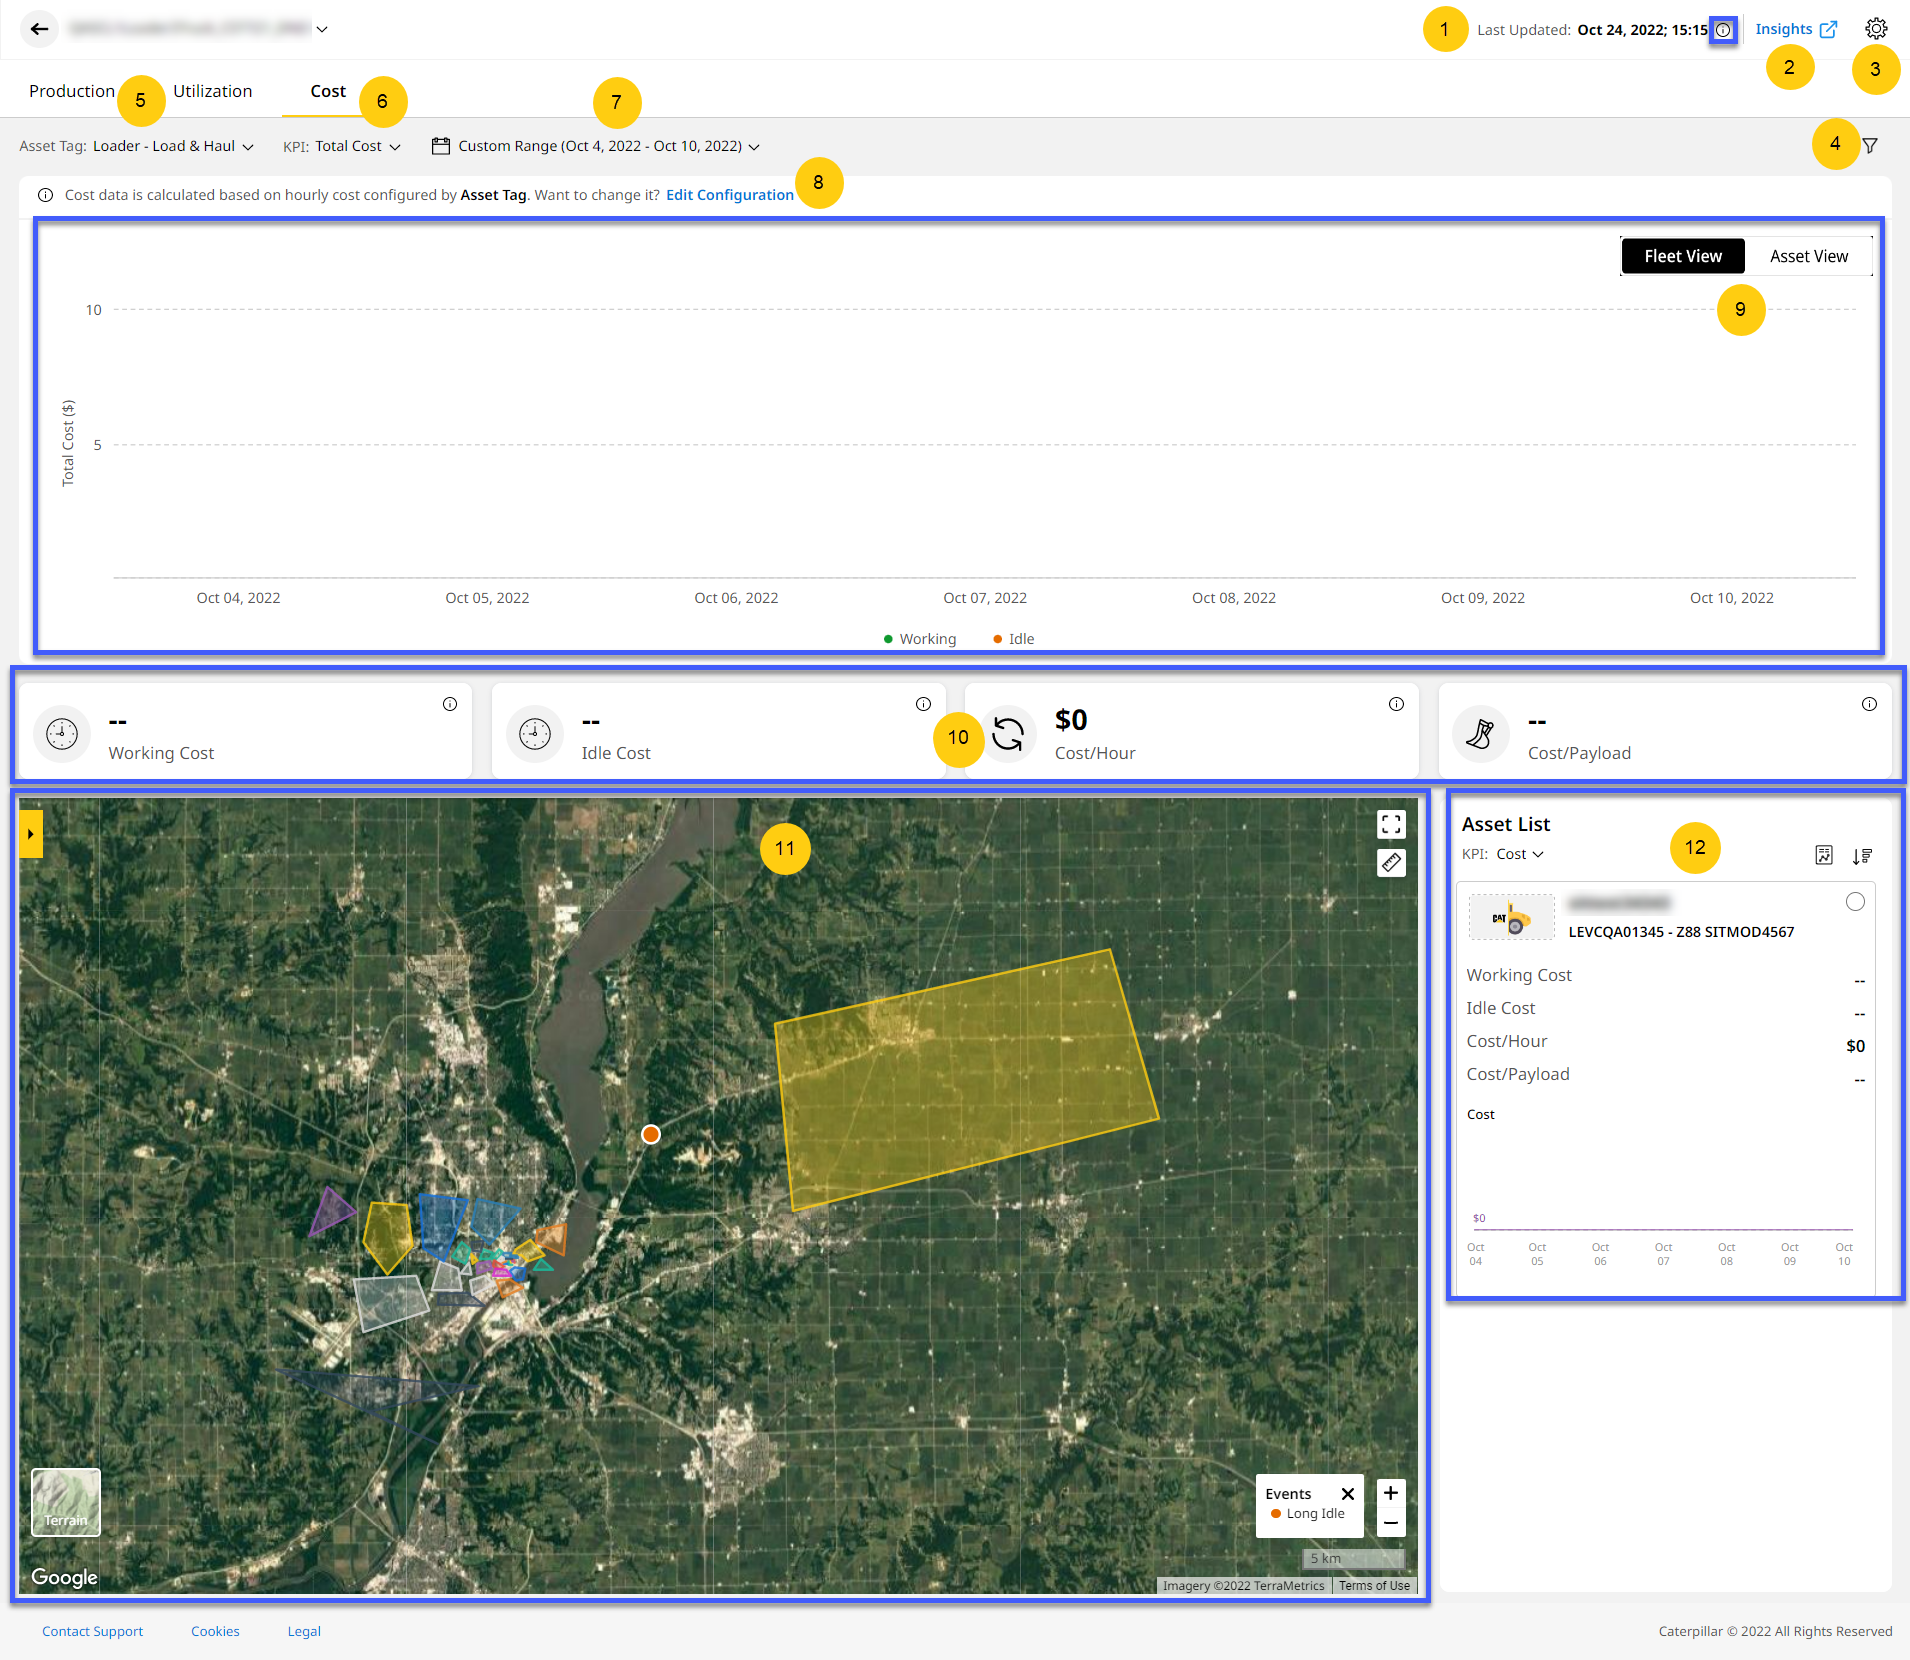
Last Updated: View timestamp of the last reported data or change. Click info
 to view the time zone (country/city) of the selected site.
 -
Insights: Click
 to open Insights.
 -
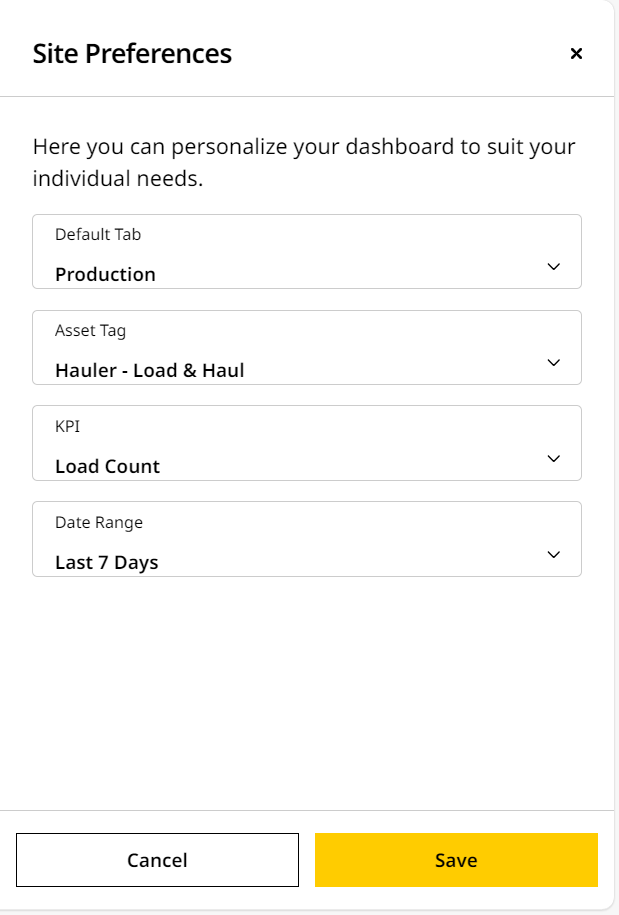
Site Preferences
 : Customize Site Summary dashboard to your needs. Change the Default Tab, Asset Tags, KPI, and Date Range.
-
Filters: Filter based on single or multiple asset IDs and shifts for a selected date range, asset tag and KPI.
-
Asset Tag: Select an asset tag for which the above KPI data is required.
-
KPI: Selects the following KPI:
-
Total Cost: Sum of costs incurred on the site across various operations.
-
-
Date Range: Choose the date range to view the KPI data for the asset tag.
-
Edit Configuration: Informs the basis for configuring the cost dashboard. Want to change it to Asset Model or Asset ID? Click the Edit Configuration option.
-
Asset/Fleet View Dashboard: View site KPI data in Asset/Fleet View, based on selected asset tags and date range.
-
Asset View displays the KPI data as charts. Values set when you configure the cost dashboard show up here as line graphs.
-
Fleet View displays the KPI data as charts. Values set when you configure the cost dashboard show up here as line graphs, demarcated by date.
-
-
KPI Cards: The KPI cards display total cost data for the asset tags selected. The default KPIs are:
-
Map View: Visualize selected KPIs on the map view, alongside their asset IDs, serial numbers, and additional details.
-
Asset List: Find list of all the configured assets in the site and a brief overview of each.