Insights Filters
Filter data by specifying criteria to narrow down the list of records in asset and cycle details [on Production (Insights) and Utilization (Insights)] or multiple asset IDs and design or survey files [on Map (Insights)] for the selected date range. The values of selected filter columns are loaded based on the selected site and date range.
Production (Insights) and Utilization (Insights)
Use ![]() to narrow down the list of records in asset and cycle details. This is especially useful when want to quickly find relevant data across multiple sites, linked assets and time periods.
to narrow down the list of records in asset and cycle details. This is especially useful when want to quickly find relevant data across multiple sites, linked assets and time periods.
The values of selected filter columns are loaded based on the selected site and date range.
You can refine filter results based on time format settings in Preferences and operators such as:
-
Equals to
-
Greater than or Equals to
-
Less than or Equals to
-
Between

• The Filters option displays only on Production (Insights), Utilization (Insights) and Map (Insights).
• If you change asset tags, tabs or date range, you can find the selected filters cleared and displayed in default mode.
• Use Between operator to enter two values for comparison based on selected time range.
• For the Shifts filter, the following applies:
° Filter Shift(s) by single or multiple days.
° You can select shifts only if chosen date range contains supporting shift data.
° If your site contains no shifts data, set up shifts in the Add Shifts step when creating or editing a site.
View ImageView Image 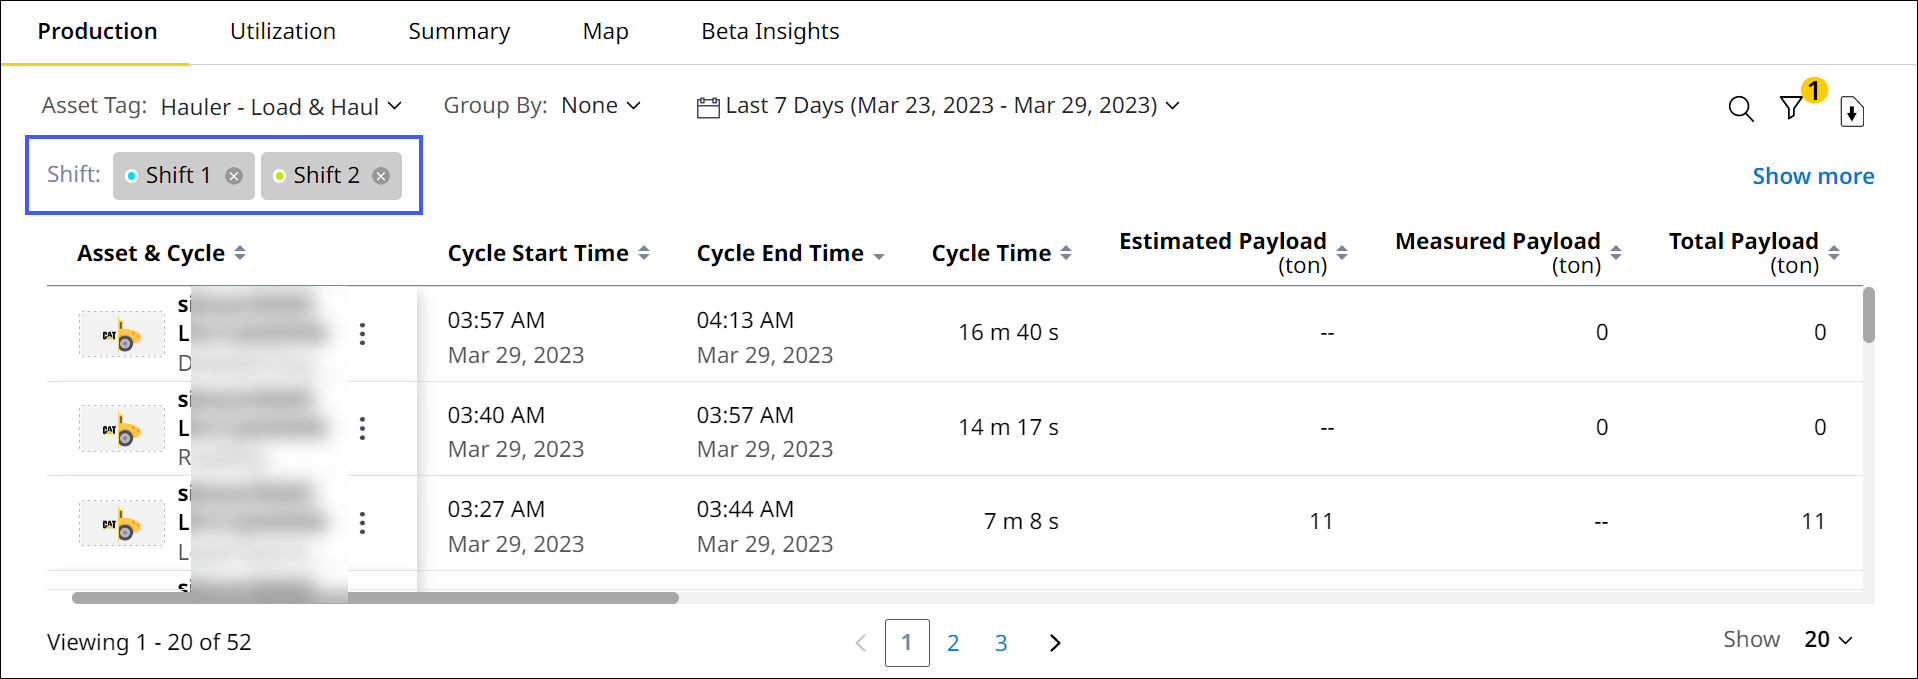
• The filtered results can also be downloaded in .csv format using download ![]() on Insights.
on Insights.
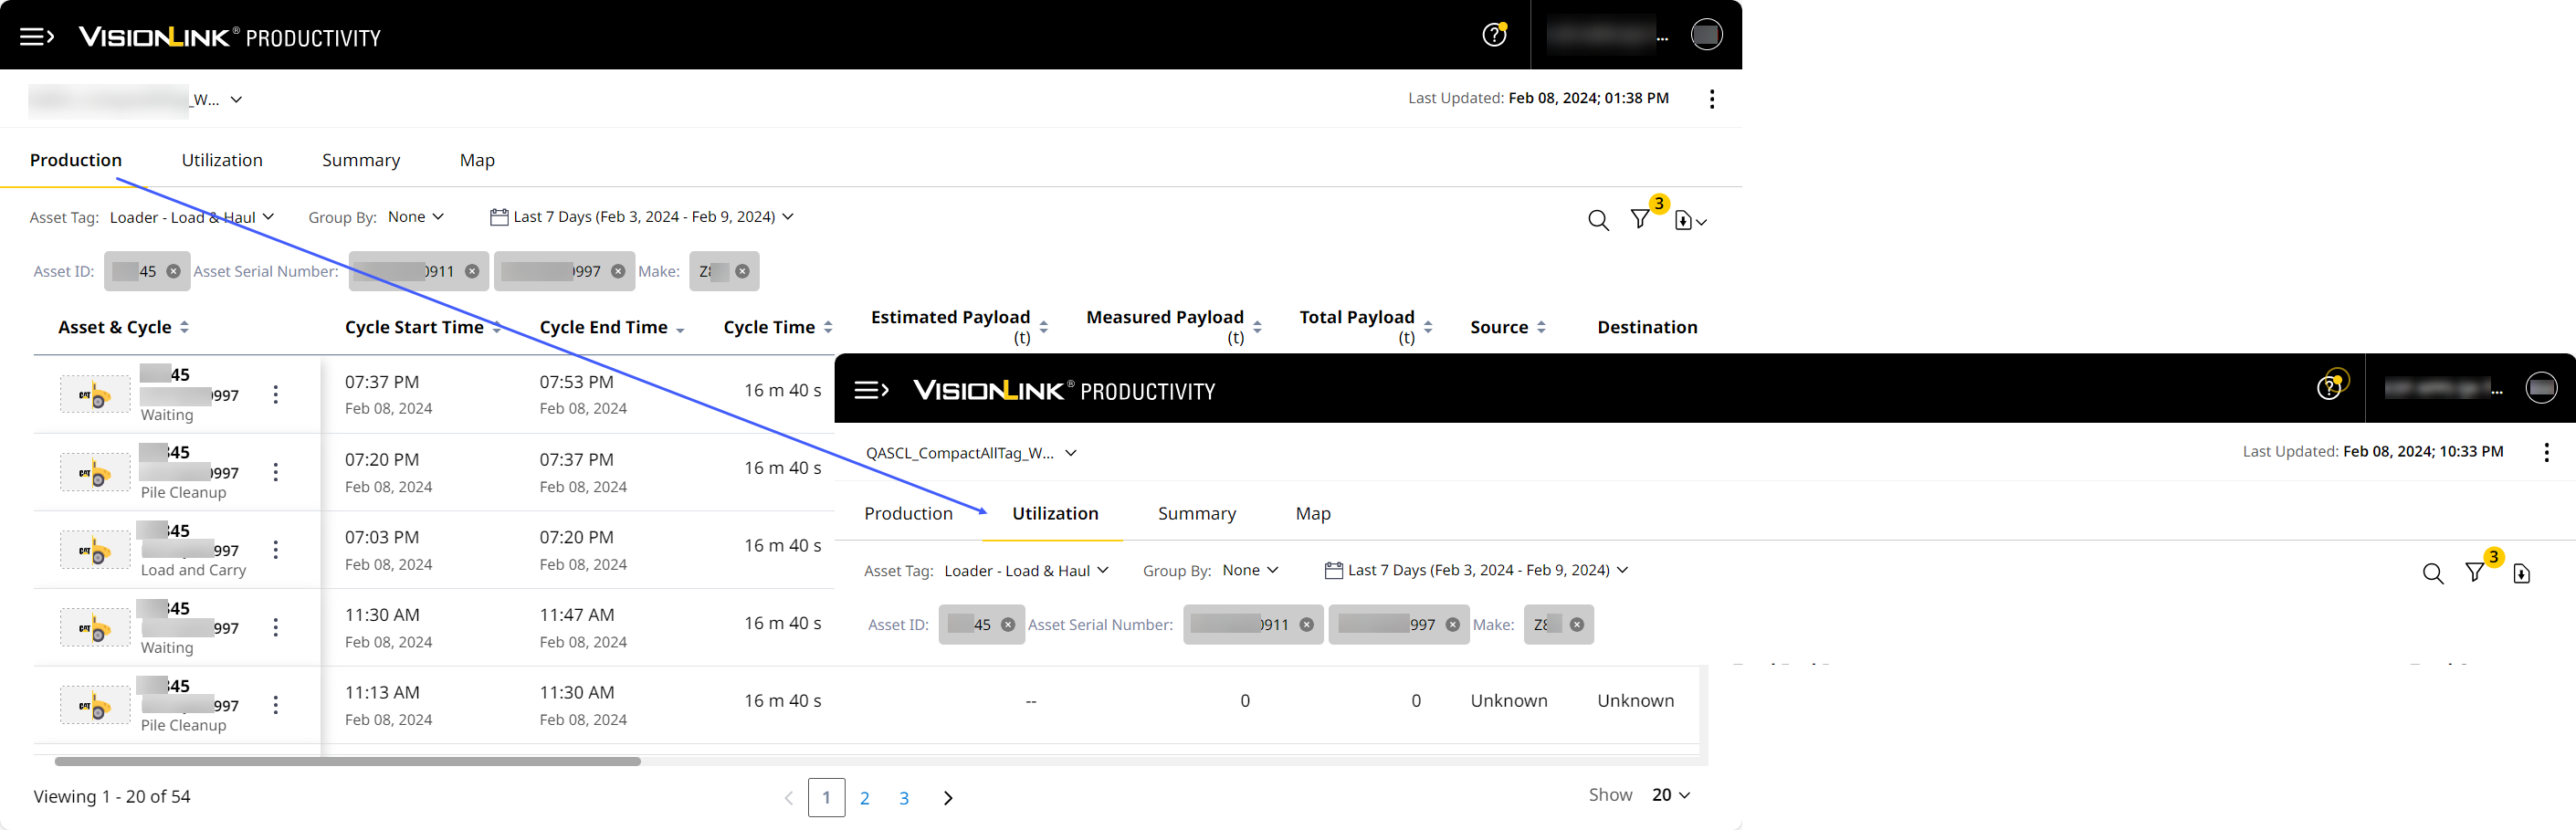
• If you select the following filter type on Production (Insights) or Utilization (Insights) for any asset tag, the same carries forward to the other Insights tab:
° Asset ID
° Asset Serial Number
° Make
° Model
° Shift
Use this to quickly track asset-tag related info across Production (Insights) and Utilization (Insights) tabs.
View ImageView Image
To filter asset details on Insights:
-
Click
 at the upper-right corner.
This displays the Filter by Column pop-up.
-
The Asset ID, Cycle and Cycle Start Time are the filter columns for Production (Insights) listed by default.
-
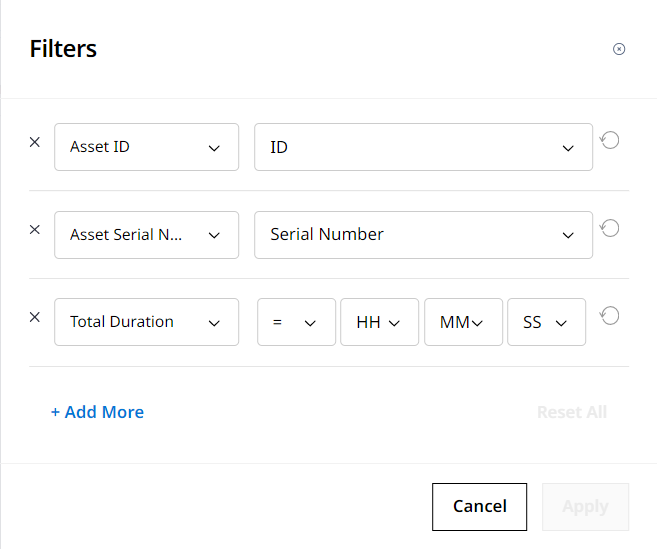
The Asset ID, Asset Serial Number and Total Duration are the default listed filter columns for Utilization (Insights).
-
You can change these default filter columns.
-
-
Select the required fields and its value from the respective drop-down lists:
-
Multi-selection of checkbox is allowed for all KPI except for time based KPIs (e.g., Cycle Time).
-
The Cycle Time KPI of the Production (Insights) auto-populates with operator and average cycle time of productive cycles for the selected date range. You can see an info icon near the Cycle Time KPI. Info
 disappears when you change the operator and average cycle time value.s
 -
If you select a KPI for the first filter column, then you cannot select the same KPI again for another filter column.
-
Use reset
 is available to clear the filter selection.
 -
Use close
 to remove respective KPI from the filter pop-up. The close is disabled, when only one KPI is listed in the filter pop-up.
-
-
Click
 to add more filter columns:
-
You can filter a maximum of six fields.
-
The Reset All option clears all KPI values and displays only the default filter columns.
-
-
Click Apply. The details are displayed on Insights based on filter selection:
-
You can find the applied filter count above the the filter icon to indicate the filter is applied in the table.
-
The applied filter information is displayed above the Production (Insights) and Utilization (Insights) table.
-
You cannot download when there is no data for the selected filter. Change the filter terms and try again.
-
Map (Insights)
For asset tags (except grade and compact), filter down data across multiple assets by selecting only the preferred ones.
For grade and compact assets, refer to Grade and Compact Filters to learn more about the displayed filter options.