Production (Site) Fleet and Asset Views
Data for selected KPIs and asset tags on Production (Site) can be viewed in two formats. Depending on the selected KPIs for the asset tags, the Fleet and Asset Views will vary.

Looking for Grade and Compact asset tag-specific views? Refer to Production (Site) Volume and Density.
-
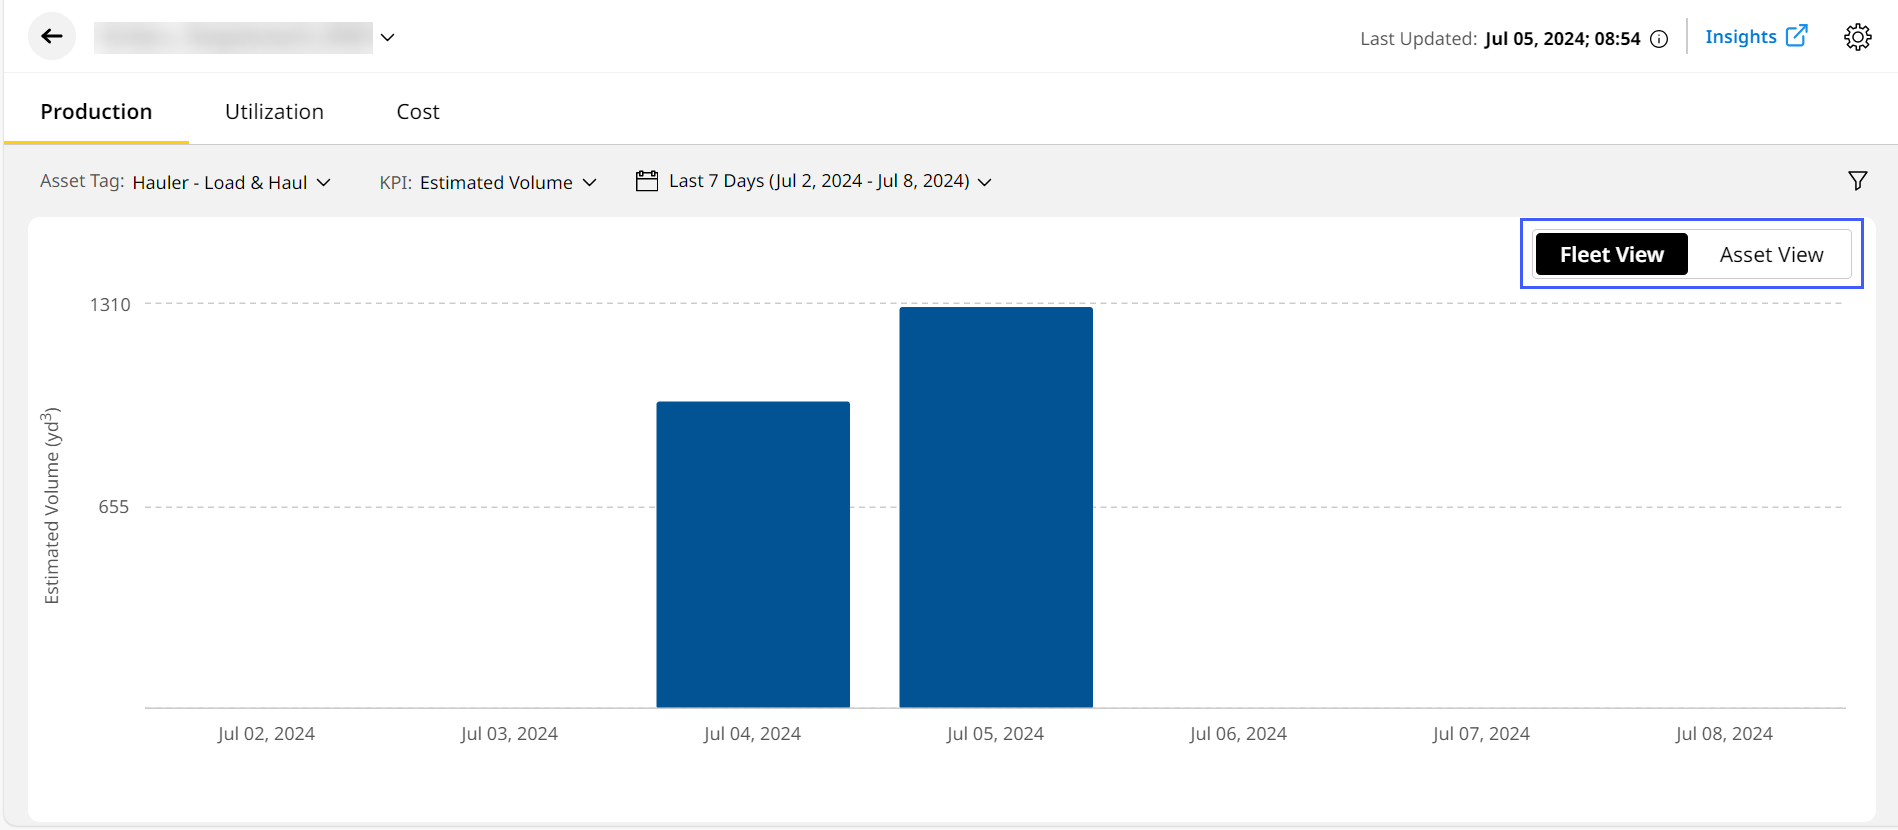
Fleet View
Displays data as charts and shows selected KPIs against set Targets. Click on the bars or lines in the charts to get its specific details. Targets are represented as a line in the chart.
Refer to Summary View Options on Fleet View for more information.
-
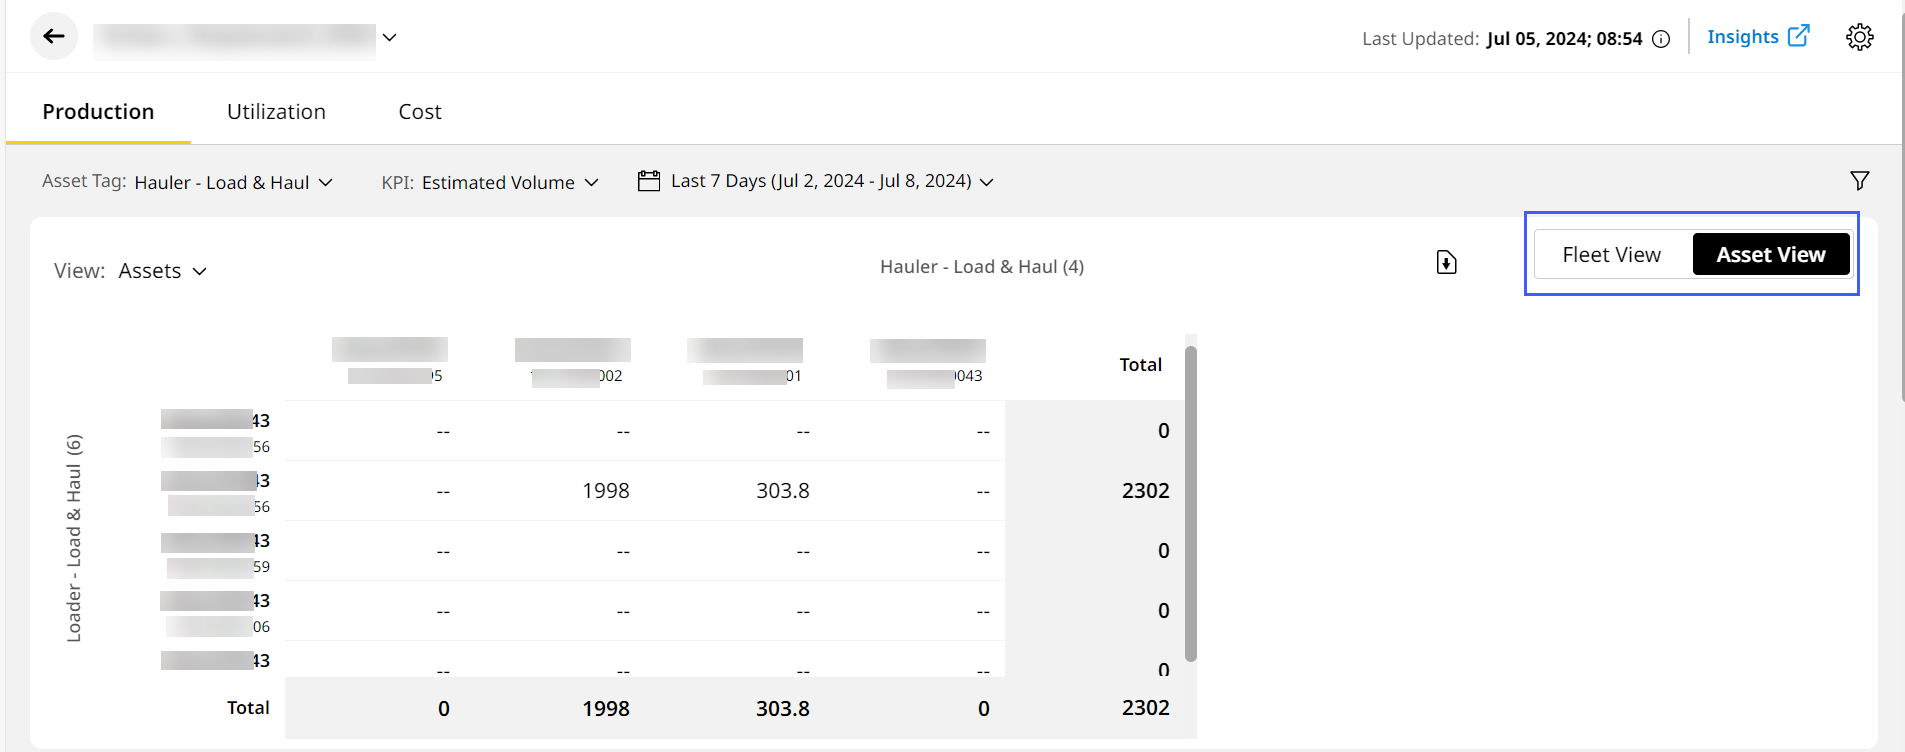
Asset View
Displays data in a tabular format and offers easier data comparison. Based on selected criteria, additional filters and options may be provided for more in-depth data arrangements. The Fleet View table can be downloaded directly as an .csv file using download
 next to the View toggle. It is easier to upload and copy the information into billing systems and make data analysis much easier and quicker.
Use List Summary View options to sort data even further.
Refer to Summary View Options on Asset View for more information on KPIs and how they impact the data representation.
Target Payload Overload
Maintaining asset health extends its lifespan by reducing downtime plus delays and helping maximizing production. Cycles that exceed the entered value result in Target Payload Overload events, tracked on the application. Here, you can track event counts of payload exceeding 100%, 110% and 120% of the Target Payload for hauler assets.
Target payload tracking and overloading is only available to hauler assets subscribed to PerformancePro with Advanced Productivity.
View these instances on Production (Site) > Fleet View and Asset View.
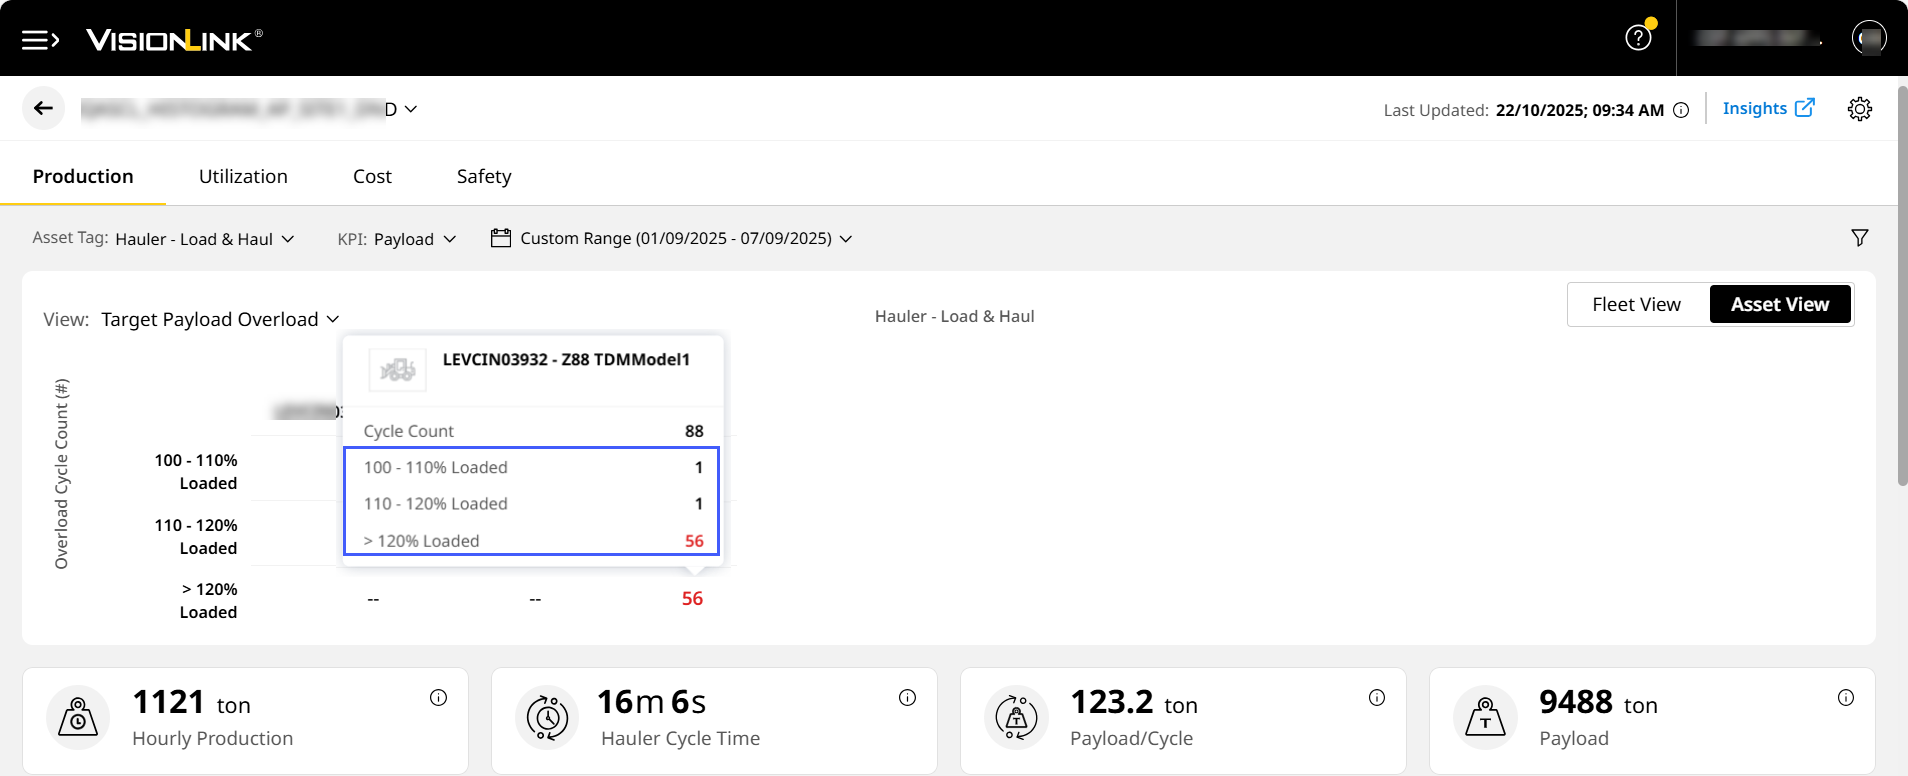
• Understand how Target Payload Overload works with an easy example. A hauler truck has a target payload limit of 100 tons. The following scenarios will trigger a target payload overload event:
◦ 115% of the target payload of 100 tons equals 115 tons. If the payload for a given cycle exceeds 110 tons but is less than 120 tons, it will appear in the 110-120% row.
◦ 125% of the target payload of 100 tons is 125 tons. If the payload for a given cycle exceeds 120 tons, it will appear in the > 120% row.
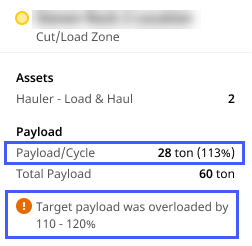
• Payload/Cycle data displays the payload percentage alongside the absolute value. In case of overloading instances, the following message displays:
View ImageView Image
• View events where an asset exceeded 100%, 110%, 120% of its target payload. With this, monitor critical stresses on asset performance.
View ImageView Image
