March 2022
Now Download List Summary on Summary View
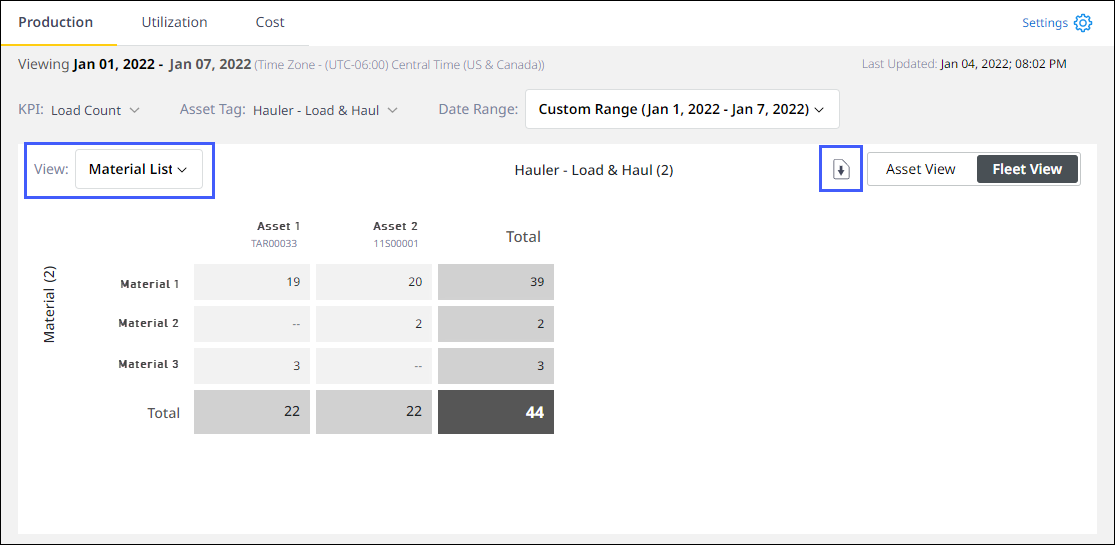
You can now download and save the List Summary data offline for further analysis. This feature is available for all asset tags with supporting data.
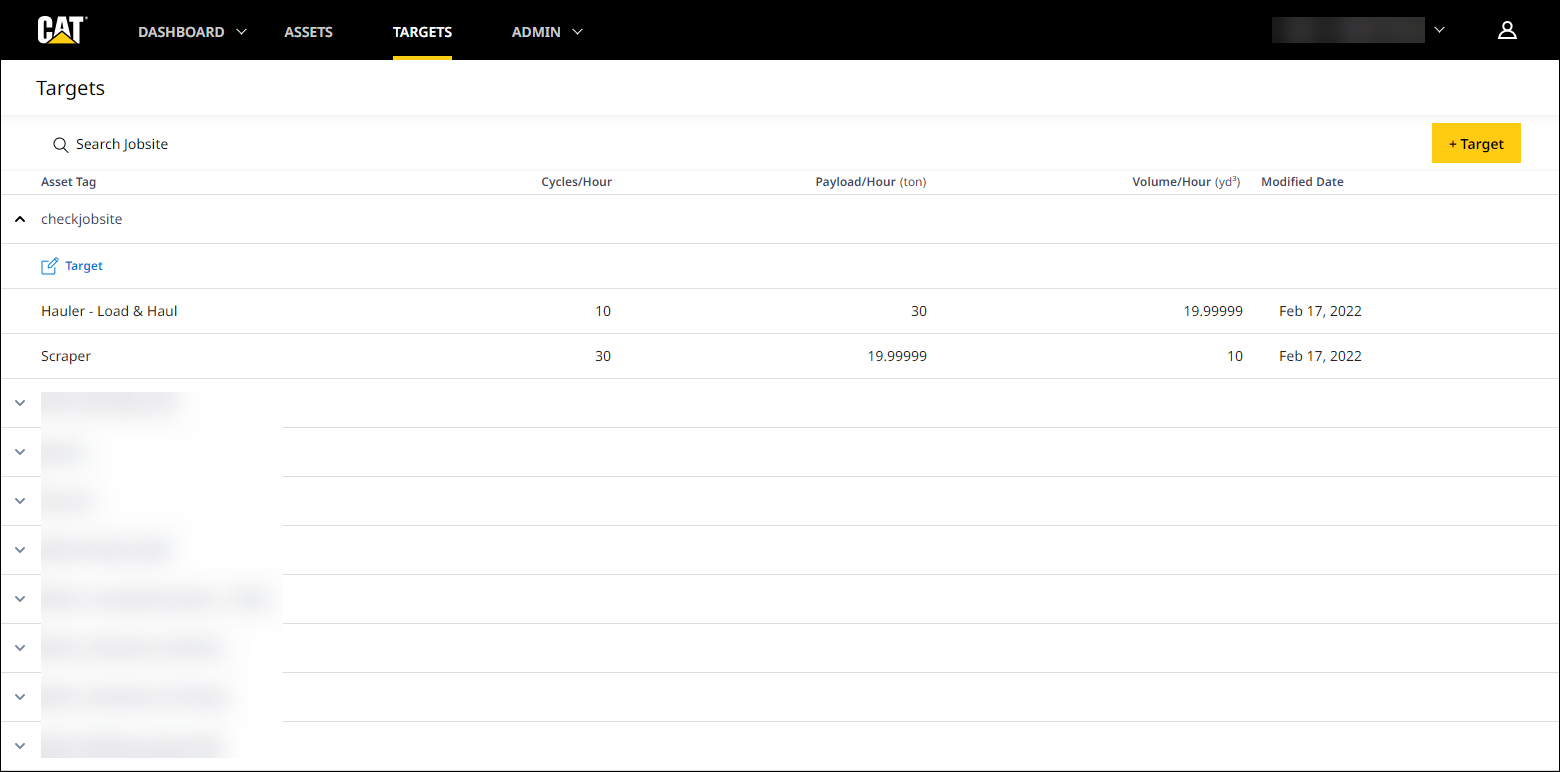
Set Separate Targets for Haulers - Load & Haul and Scrapers for a Site
In Targets, set different targets for Hauler - Load & Haul and Scraper asset tags.
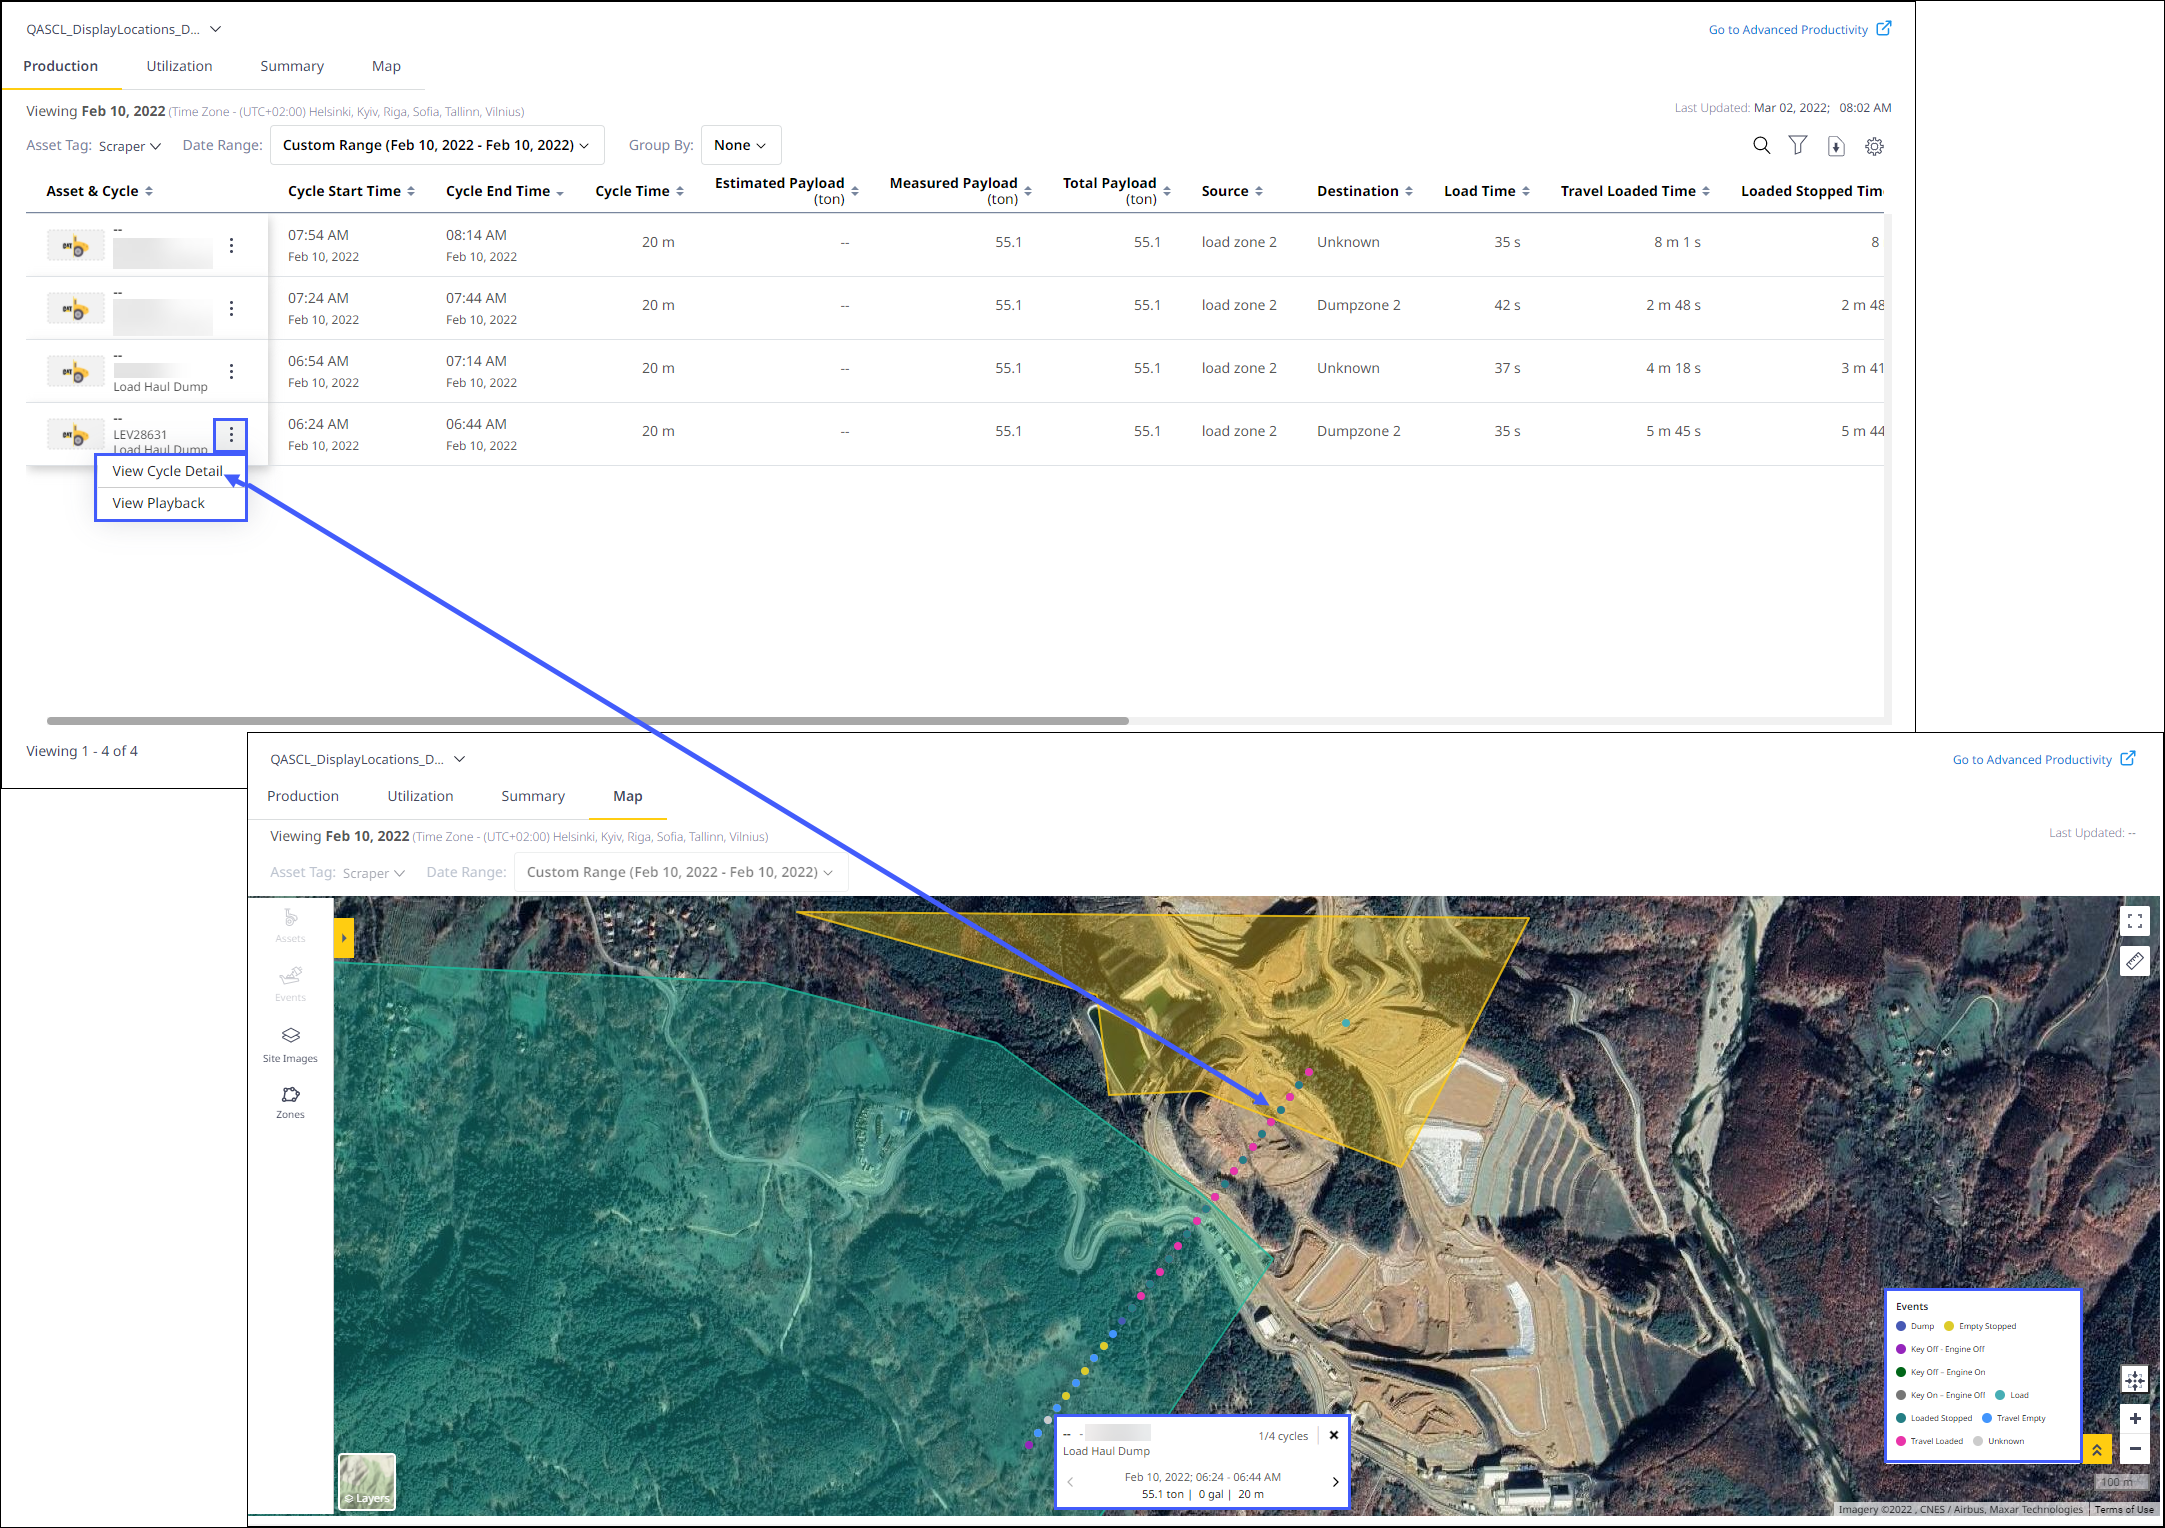
View Plotted Segment Locations to Analyze Cycles from Advanced Productivity Assets
On Productivity Insights, under Production, view detailed segment locations of a single cycle in the map using View Cycle Detail. It is currently available only for assets subscribed to Advanced Productivity.
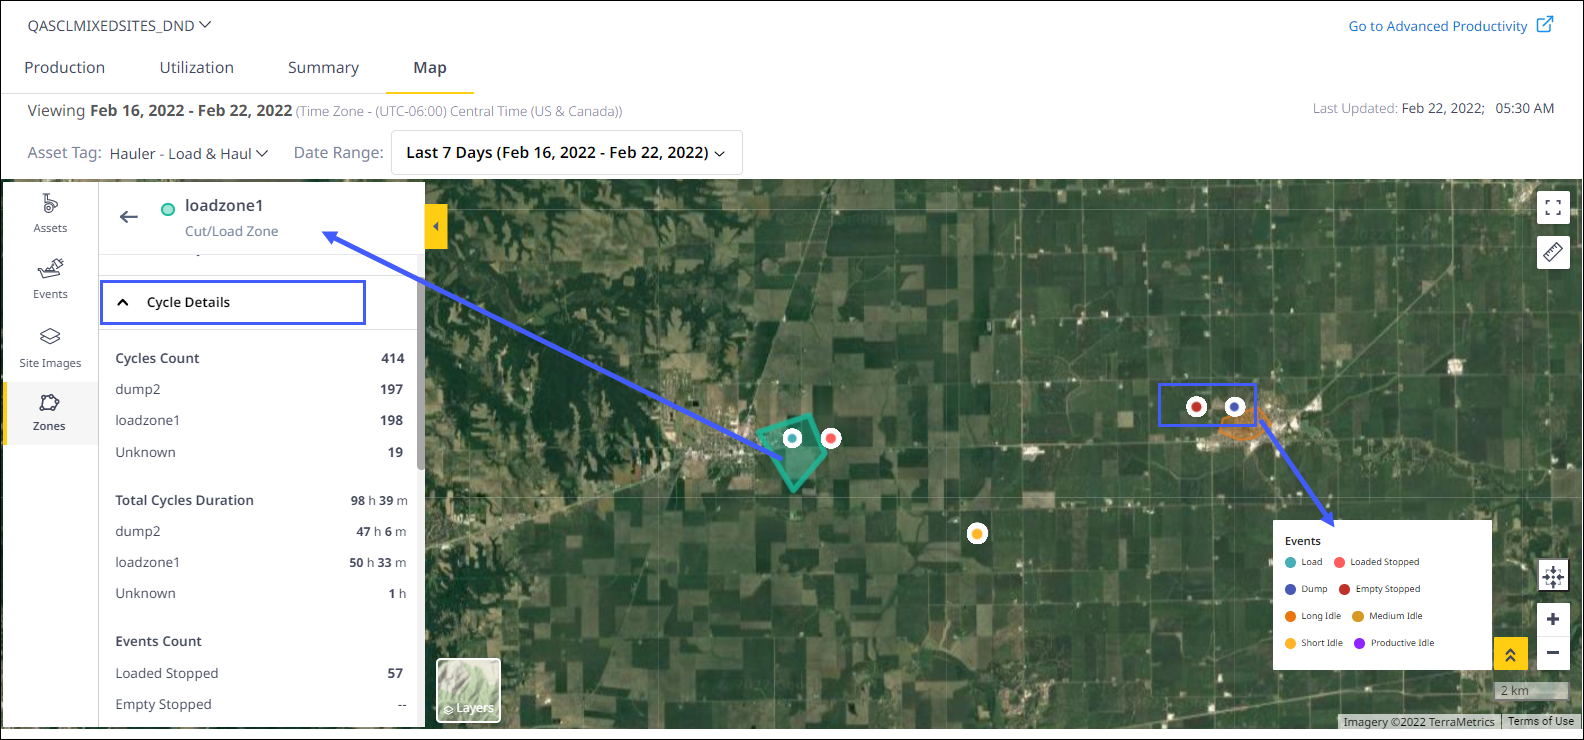
Enjoy New and Improved Features of Insights Map View
Use cluster view of events or turn cluster view off to view the specific locations where the events occurred. Also, you can analyze a zone's cycle details more effectively with the improved categories on Zone section of the Insights Map slider panel.
Disruptions caused by unplanned changes in report schedule time fixed – CPI 501020
[Schedule time for the reports is getting changed in Advanced Productivity]
A backend fix has corrected the conversion of time displayed to report specific time zone in the reports. Reports are now being generated at the time specified by the user.
Missing Engine Start Time in Runtime Report Resolved – CPI 495306
[Runtime report: Missing engine start time]
By introducing a new event called Engine Start, Runtime Report now displays complete data for all assets that use cumulative method to report utilization data. The new event is available on Insights for assets that follow cumulative utilization logic.
Incomplete Report Data in Advanced Productivity Reports Rectified – CPI 504694
[Report is showing less than two hours cycle data for TZE00173 in AP]
A corrective action made in the backend has fixed the issue of partial data missing for productive hours. Reports are now working as expected.