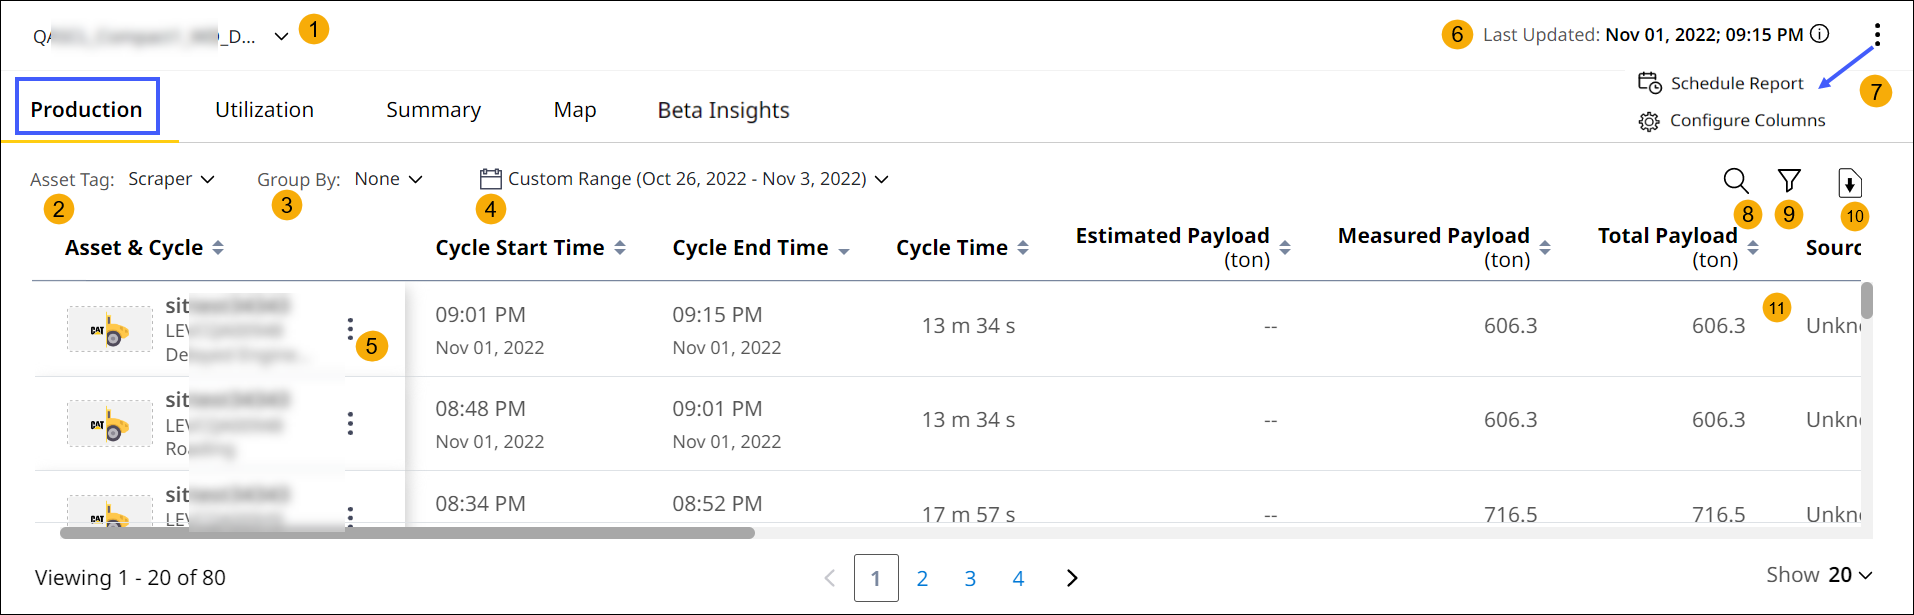
Production (Insights) Tab
Production (Insights) displays the cycle and asset production data of the selected site based on selected asset tag and date range.
-
Site Drop-down List: Select the preferred site to view its production and utilization details. Refer to Create Site for more information on creation of site.
-
Asset Tags: Select the asset tag for which the production details are to be displayed in the table. The available asset tags are:
-

Support asset tags are currently not supported.
-
Group By: Allows you to sort production cycles into groups based on selected asset tags. You can change the selection to group the data respectively. The selected option remains the same even when you switch between tabs or changes asset tags.
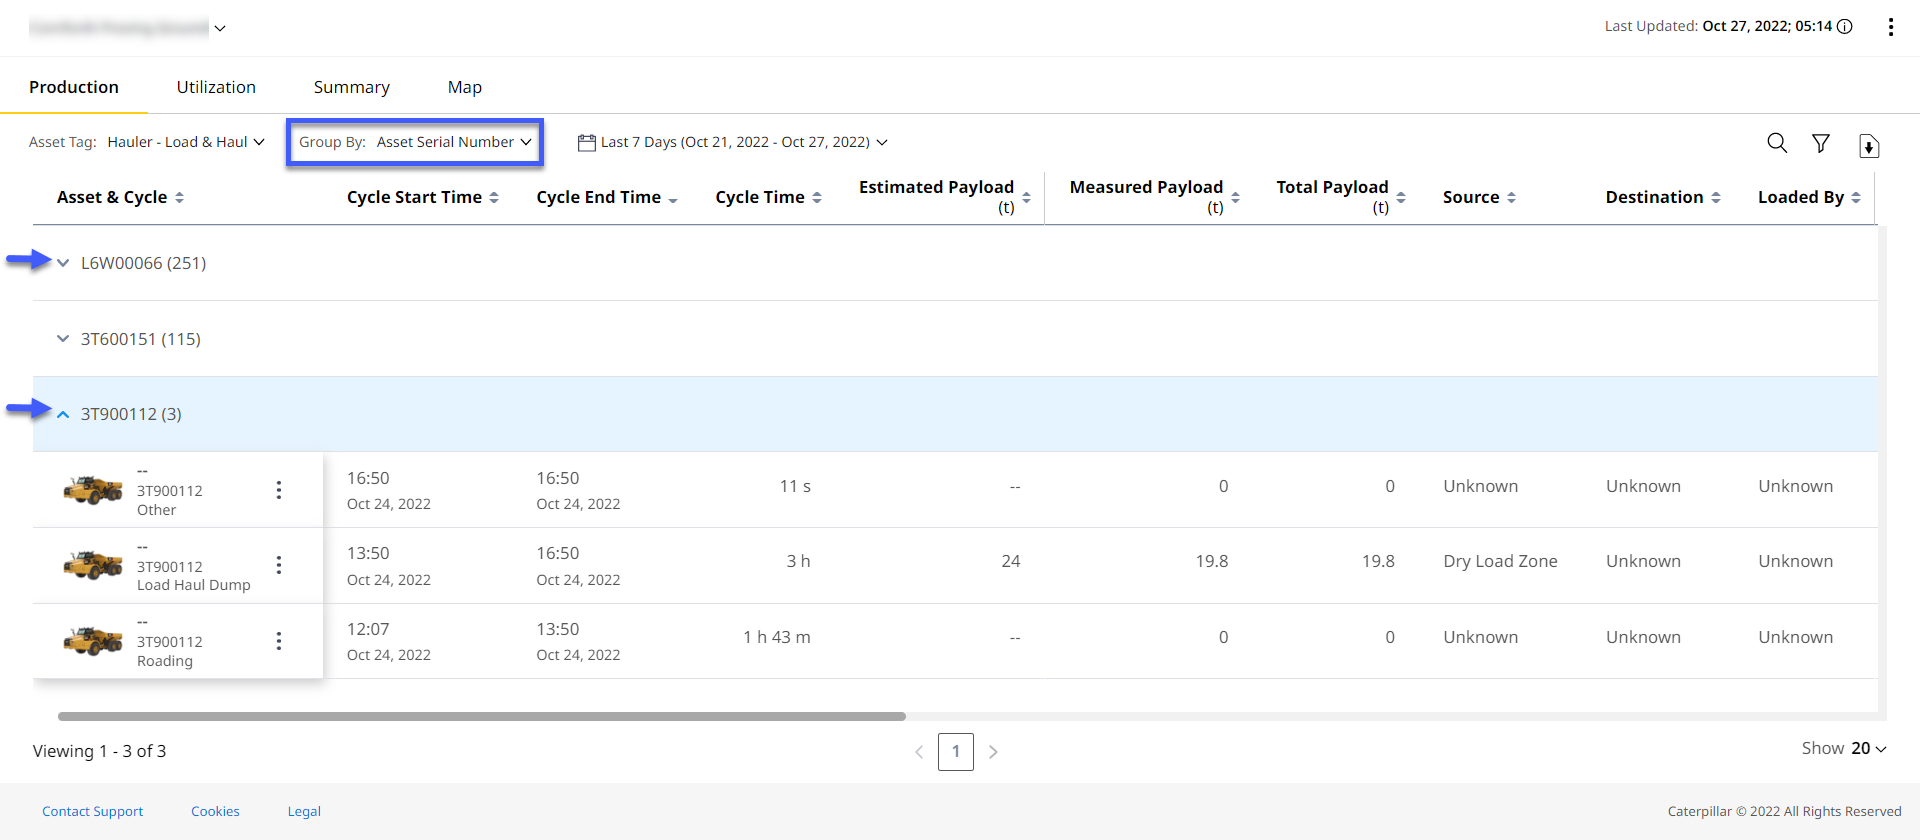
The count of events under each group is displayed next to its name for all Group By options except None.
-
By None: The option displays the default table, without grouping the events data.
-
By Asset Serial Number: The option displays production cycles data grouped by unique asset serial numbers.
-
By Cycle: The option displays production cycles data grouped by cycle types.
-
By Source: The option displays production cycles data grouped by the source location.
-
By Destination: The option displays production cycles data grouped by the destination.
-
(For Hauler - Load & Haul asset tag only) By Loaded By: The option displays production cycles data grouped by hauler asset type.
-
-
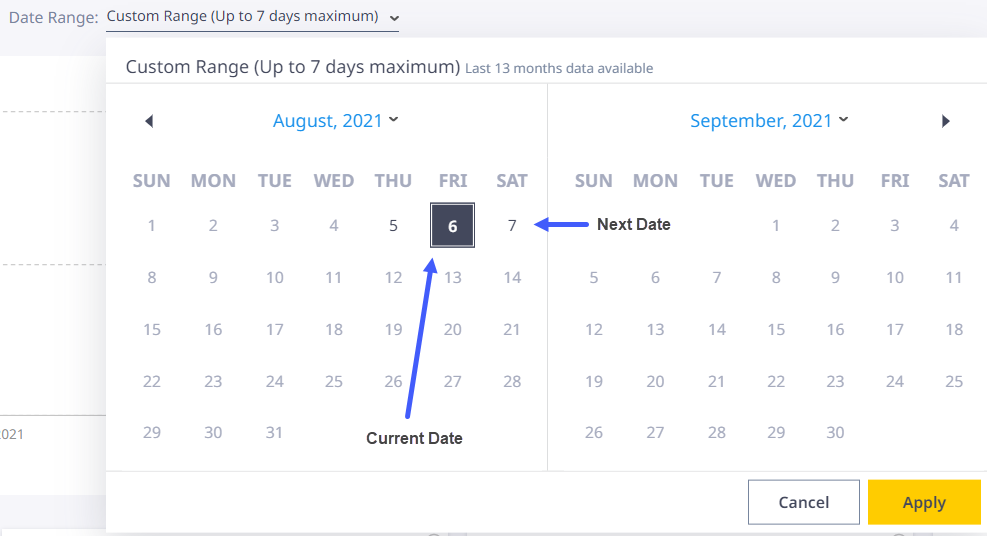
Date Range: Select the date range for which the production details for the selected asset tag are to be displayed.
-
The available date range selections are Today, Yesterday, Last 7 Days and Custom Range. Last 7 days is the default selection. For Custom Range, choose the required From and To dates from calendar for last 13 months.
-
The selection of start date should not be greater than the end date.
-
The available date range is based on you local browser time zone and not that of individual sites.
-
Select one day into the future of their local time zone if the said date is available in a different time zone. This will allow them to view site data for a time zone ahead of theirs consistently.
-
-
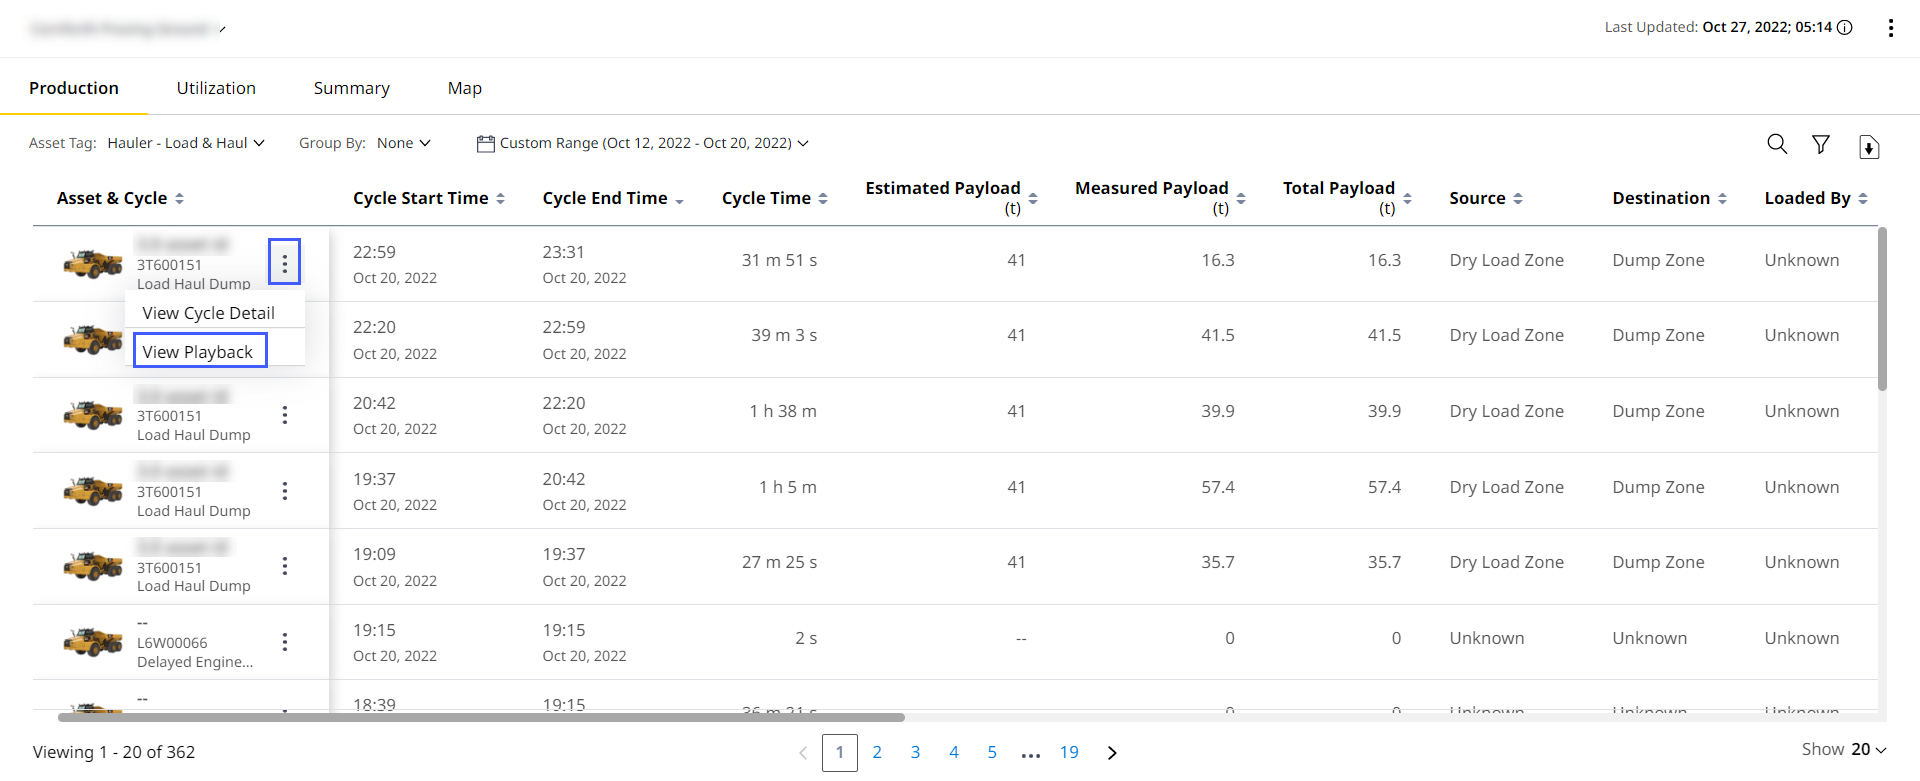
Options: Open the list to View Cycle Details or Playback View.
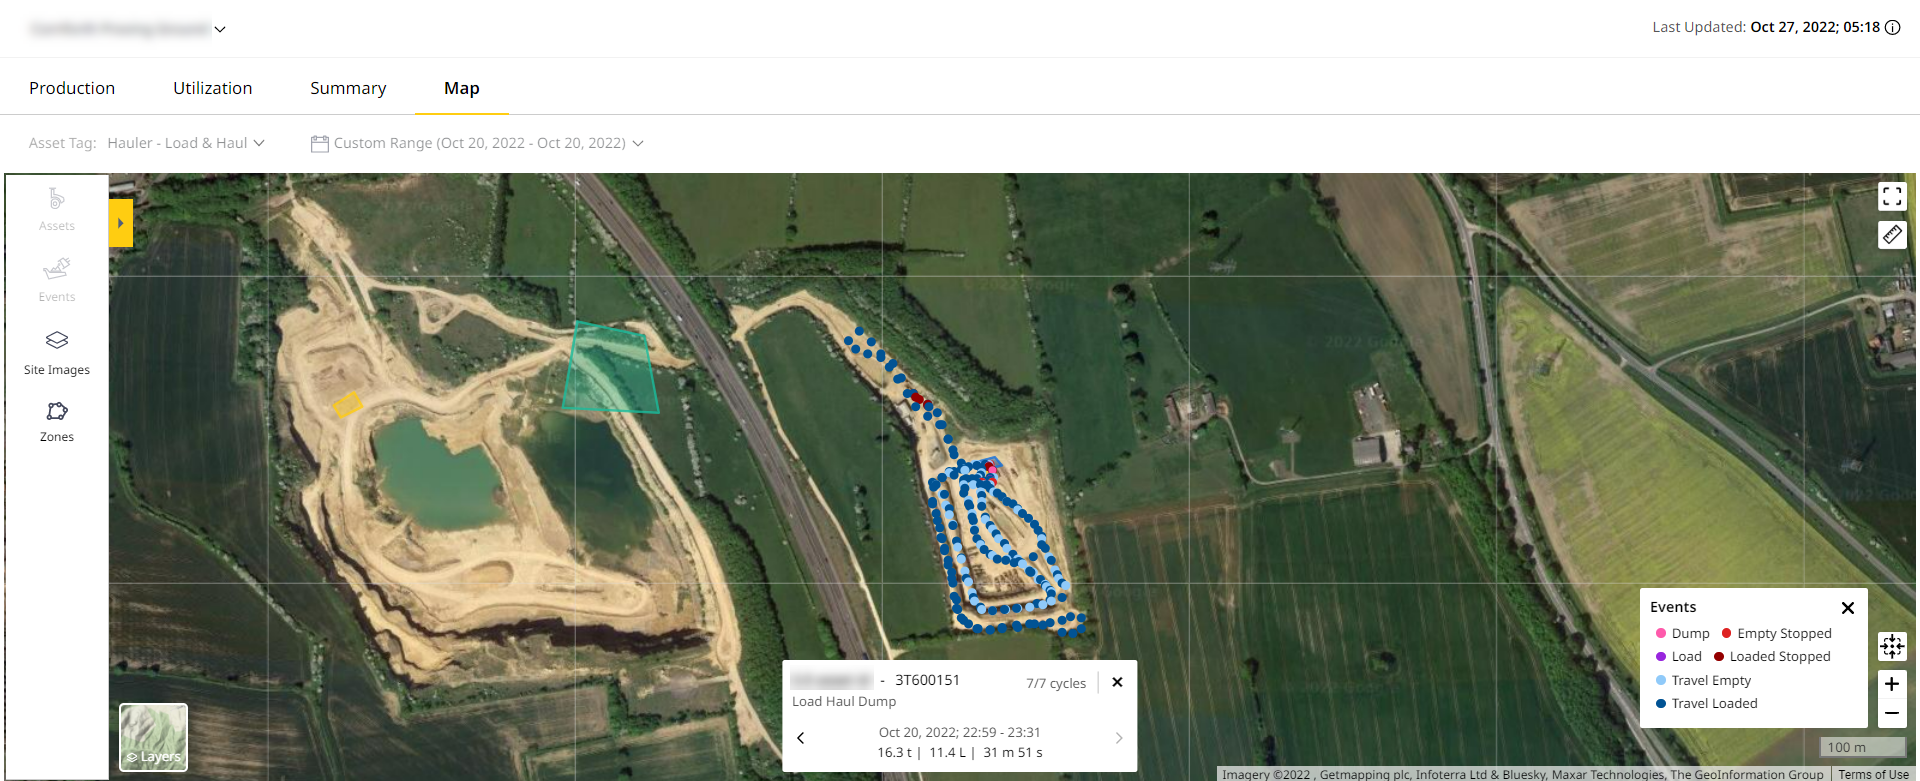
View Cycle Details: View the locations of all segments of a single cycle plotted on the Insights Map tab using more options
 > View Cycle Details. The feature is available only for single day selections. Viewing the segment locations plotted on the map enables you to identify problem areas easily.
-
Navigate from Site Summary to Insights Production tab using
 .
. -
Click more options
next to a single cycle for the options list. Select View Cycle Details.
-
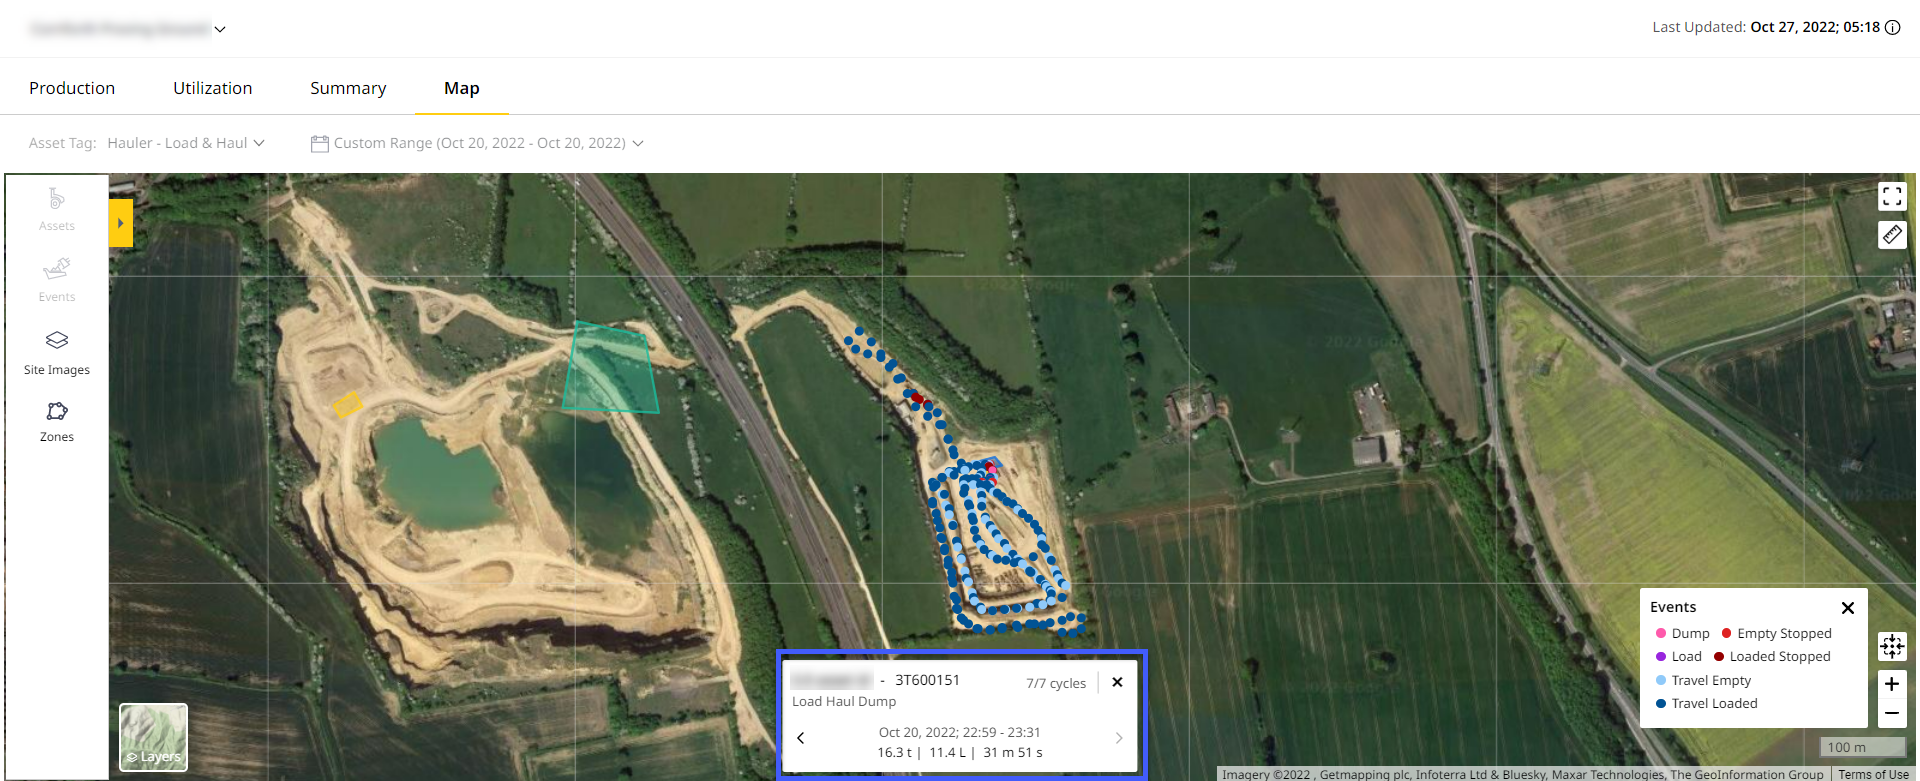
It will redirect you to the Map and display all the plotted segments of a cycle. There is a card which displays details of the cycles. The legend explains the colors that represent each of the events plotted on the map.
-
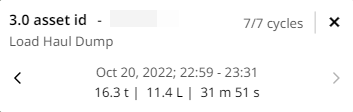
The cycle details are displayed in a card at the bottom of the map:
-
Asset ID and asset serial number
-
Cycle type
-
Cycle date time
-
Cycle duration
-
Payload
-
Fuel used during the cycle
-
Cycle count
-
-
Click close
 on the card to close the feature.
While using this feature, Assets and Events on the slider panel as well as the asset tag and date range selector fields are disabled.
-
- Last Updated: View the timestamp of the last reported data. Click info
 to view the time zone (country/city) of the selected site.
 -
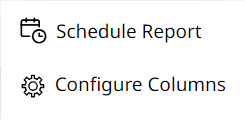
More Options: Click more options
to perform the following: -
Schedule Report: Receive periodic (daily, weekly and monthly) updates on all your Summary (Insights) data as a .xlsx and .csx file.
-
Configure Columns: Customize the production details table to display only the required data in preferred order.
-
-
Search: Search respective asset by Asset ID or Serial Number. A minimum of three characters is required to refine the search results.
-
Filters: Specify criteria to narrow down the list of records in asset and cycle details. The values of selected filter columns are loaded based on the selected site and date range.
-
Download: Allows you to download cycle or payload details of site in .csv format for the selected date range.
-
Use download
 to save the following two reports:
-
Cycle Details of site in .csv format for the selected date range.
-
Payload Details and material loaded to a truck by a loader or load out asset in .xlsx format.
Any data filtered by asset ID or asset serial number will reflect in the downloaded Cycle Details and Payload Details reports as well. -
-
The download
is disabled when there is no Insights data for the selected date range. -
The selected or reordered KPI lists in configure column are retained in the downloaded .csv sheet against the logged in user's name.
-
-
Table View: Displays data in tabular format for Insights Production. The first column shows the Asset ID, Serial Number and Asset Icon by default. The asset icons are displayed based on the model of the selected asset. The time stamp for respective asset listed in column details are sorted in descending order. The column header can be sorted individually in ascending
 or descending
  order by clicking the respective icons. The production table includes Asset and Cycle column and its related productivity details.
In case of shared asset(s), respective indicators (shared to or shared from
  ) will be displayed next to the asset, denoting if the asset is shared from or to another account (CCID). Refer to Shared Assets to know more.