Production (Site) Tab
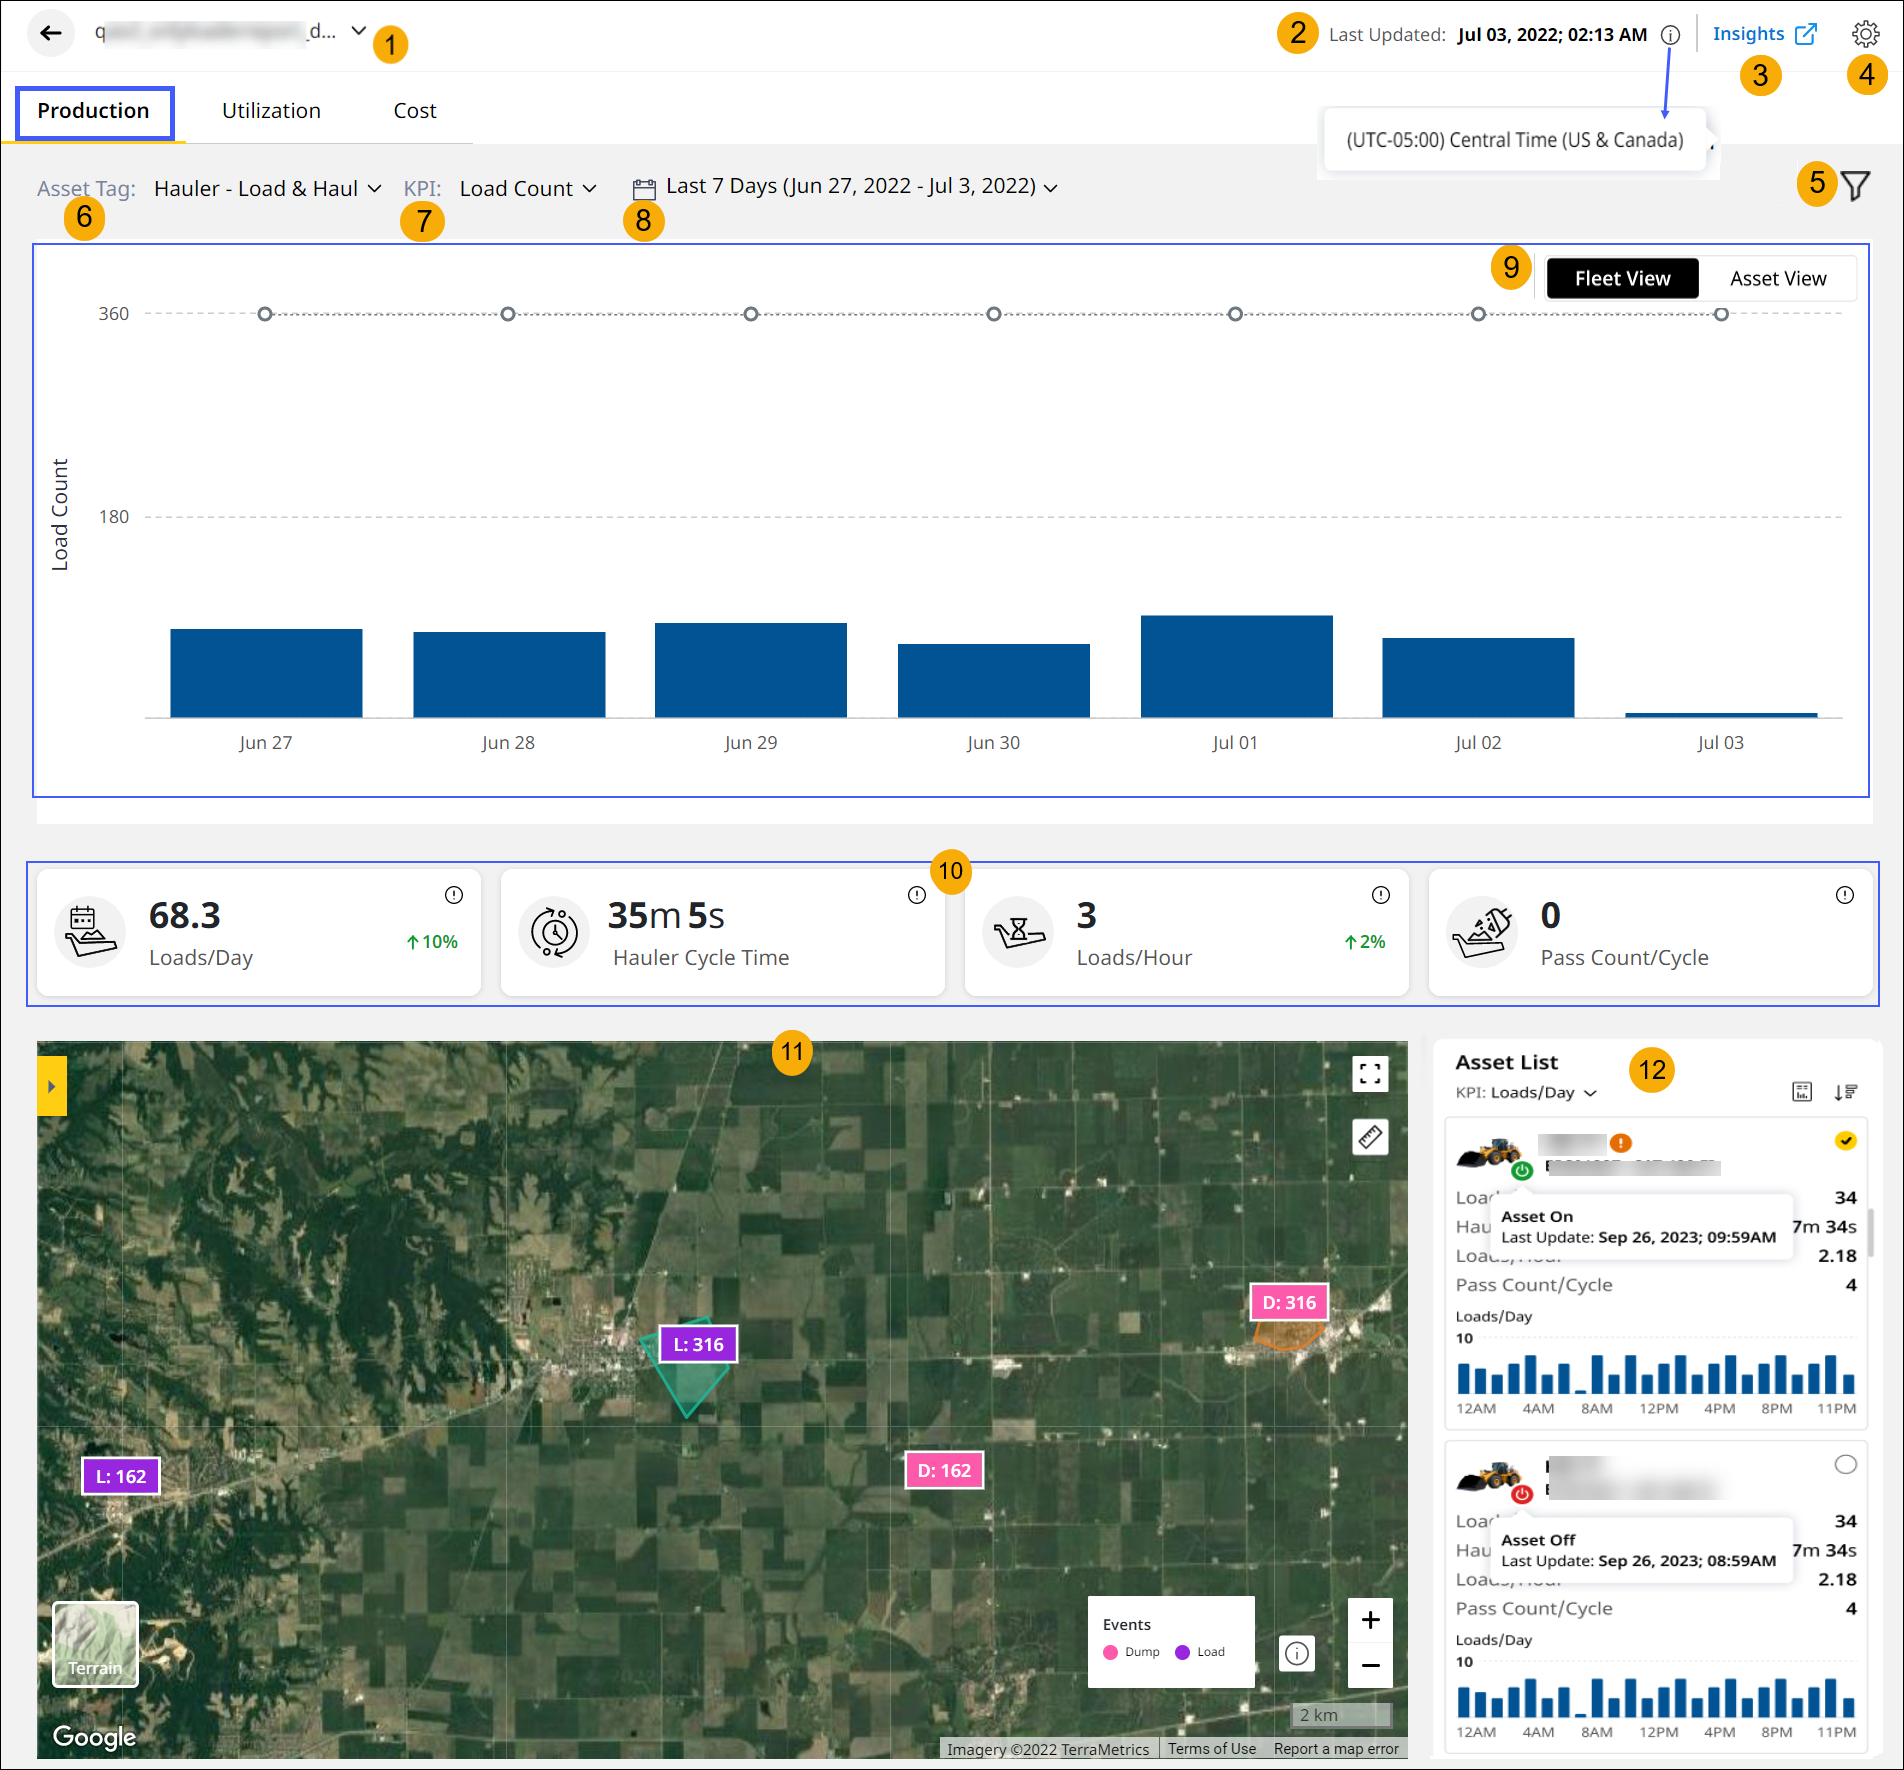
The Production tab reports the efficiency of operations in a site.
-
Site Name: View the site name here. Use the drop down to switch sites without navigating back to Sites Dashboard.
-
Last Updated: View the timestamp of the last reported data. Click info
 to view the time zone (country/city) of the selected site.
 -
Insights: Click
 to open Insights.
 -
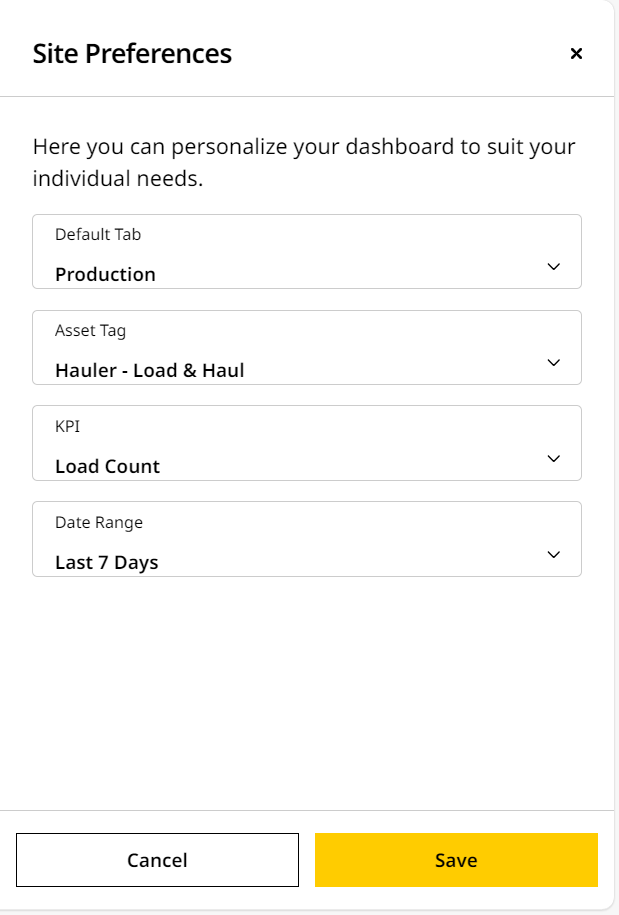
Site Preferences: Customize Site Summary dashboard to your needs. You can change the Default Tab, Asset Tags, KPI and Date Range.
-
Filters: Filter based on single or multiple asset IDs, shifts, and available file categories for a selected date range, asset tag and KPI.
-
Asset Tag: Select an asset tag for which the above KPI data is required.
-
KPI: Select a KPI to view the data.
Production has:
-
Load Count: Number of cycles moved by the assets.
-
Payload: Total weight of materials measured by the assets.
-
Segment: Working and idle hours of the assets.
-
Estimated Volume: Volume of material moved by the assets.
-
Measured Volume: Volume of cut and fill completed in a site.
-
-
Date Range: Choose the date range to view the KPI data for the asset tag.

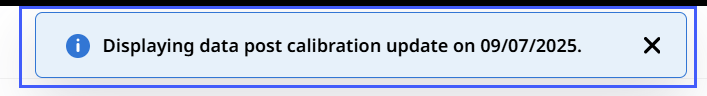
For Grade and Compact asset tags, after updating a new calibration file, choose a date range that starts after the update date. Data before that date won’t be available.
View ImageView Image

• If the selected date range includes dates before and after calibration file update, only the data after the file update will be available.
View ImageView Image
-
Fleet/Asset View Dashboard: View site KPI data on Fleet or Asset View, based on the selected asset tags and date range.
-
Fleet View displays the KPI data as charts. Values set on Targets and shifts from Add Shifts step are displayed as line graphs.
-
Asset View displays data as tables that can be downloaded as .csv files. Data is displayed already sorted based on selected filters, without having to first download a .csv file and having to rearrange it. While the lists are available for all asset tags, they will present themselves only if there is supporting data. It is not available for Segment KPIs.
-
-
KPI Cards: The KPI cards display data for the asset tags based on the KPIs selected. The default KPIs are:
Load Count Payload Segment Estimated Volume Loads/Day Hourly Production Total Runtime Hourly Production Hauler Load Time Loader Cycle Time Stopped Time Hauler/Scraper Cycle Time Loads/Hour
Payload/Cycle Roading Time Volume/Day Loader Cycle Time Total Payload Pile Cleanup Time Total Column -
Map View: Visualize selected KPIs on the map view, alongside their asset IDs, serial numbers, and additional details.
-
Asset List: Find list of all the configured assets in the site and a brief overview of each.
Refer to Production (Site) Fleet and Asset Views for more information on different data representations on Production (Site).
If you want to understand more about Grade and/or Compact asset tag-specific views, refer to Production (Site) Volume and Density.
Look out for red error ![]() displayed next to an asset ID if any active faults are detected in a site. Connectivity issues or failure to retrieve data is a common issue.
displayed next to an asset ID if any active faults are detected in a site. Connectivity issues or failure to retrieve data is a common issue.
Related Topics