Site Summary Asset List
The complete Site Summary data (chart and KPI details) can be filtered for one or more assets here. It helps you to view multiple assets in a single view and compare KPI parameters and charts between multiple assets for the selected site.

On Asset List, click any asset ID to quickly access the respective asset tab for any of your site’s assets. This helps you track and measure asset performance in more detail.
View ImageView Image

-
KPI: Use KPI drop down to select the metric that will be visualized across each asset in the list. The available KPIs will vary based on selected date range, asset tag and/or KPI selected above.
-
View: Use format
 to view data in Chart, KPI or Both formats:
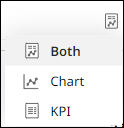
-
Both: Combines both views to give a comprehensive view.
-
Chart: Displays the selected KPI as a line graph.
-
KPI: Displays the four selected KPIs as numerical values.
-
- Sort: Use sort
 to arrange the site’s assets by quantity of selected KPI they have completed (in increasing or decreasing order).
 - Select one or more assets by clicking on the circle
 on Asset List to filter data. Checked circle(s)
  indicates any selected assets.
-
Any asset selected here will also be selected under Filters above the Asset or Fleet View. Once filtered, Site Summary will display only the selected assets' data.
-
An asset filtered on Production (Site) or Utilization (Site) will be carried forward to Insights.
-
However, an asset filtered on Cost (Site) will not be carried forward to Summary (Insights).
-
The filtered assets are displayed next to the date range. Click delete
 to remove the selection on Asset List and Filters.
-
-
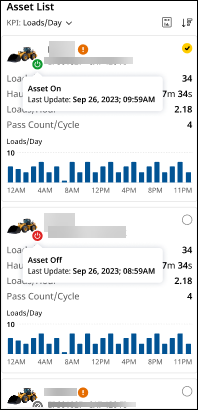
An indicator is displayed near each asset to convey the following:
-
 : Asset is keyed on.
 -
 : Asset is keyed off.
 -
 : No status reported from the asset.
 -
 : Asset status is not supported.
Hover over an indicator to learn about the status update in detail along with the date and time of last update.
In case of shared asset(s), respective indicators (shared to or shared from
  ) will be displayed next to the asset, denoting if the asset is shared from or to another account (CCID). Refer to Shared Assets to know more.
 -