Zones in Map (Insights) Tab
Use Zones on Map (Insights) for more information about active and deleted zones. It helps to classify data zone-wise and enables better location-based tracking and analysis.

Refer to:
• Create Zones to know how you can draw up a zone.
• Types of Zones to know the different zones you can create.
To access zones on Map:
-
Navigate to Insights from Site Summary using
 . Select Map.
 -
Open slider panel in Map and click on
 .
.
-
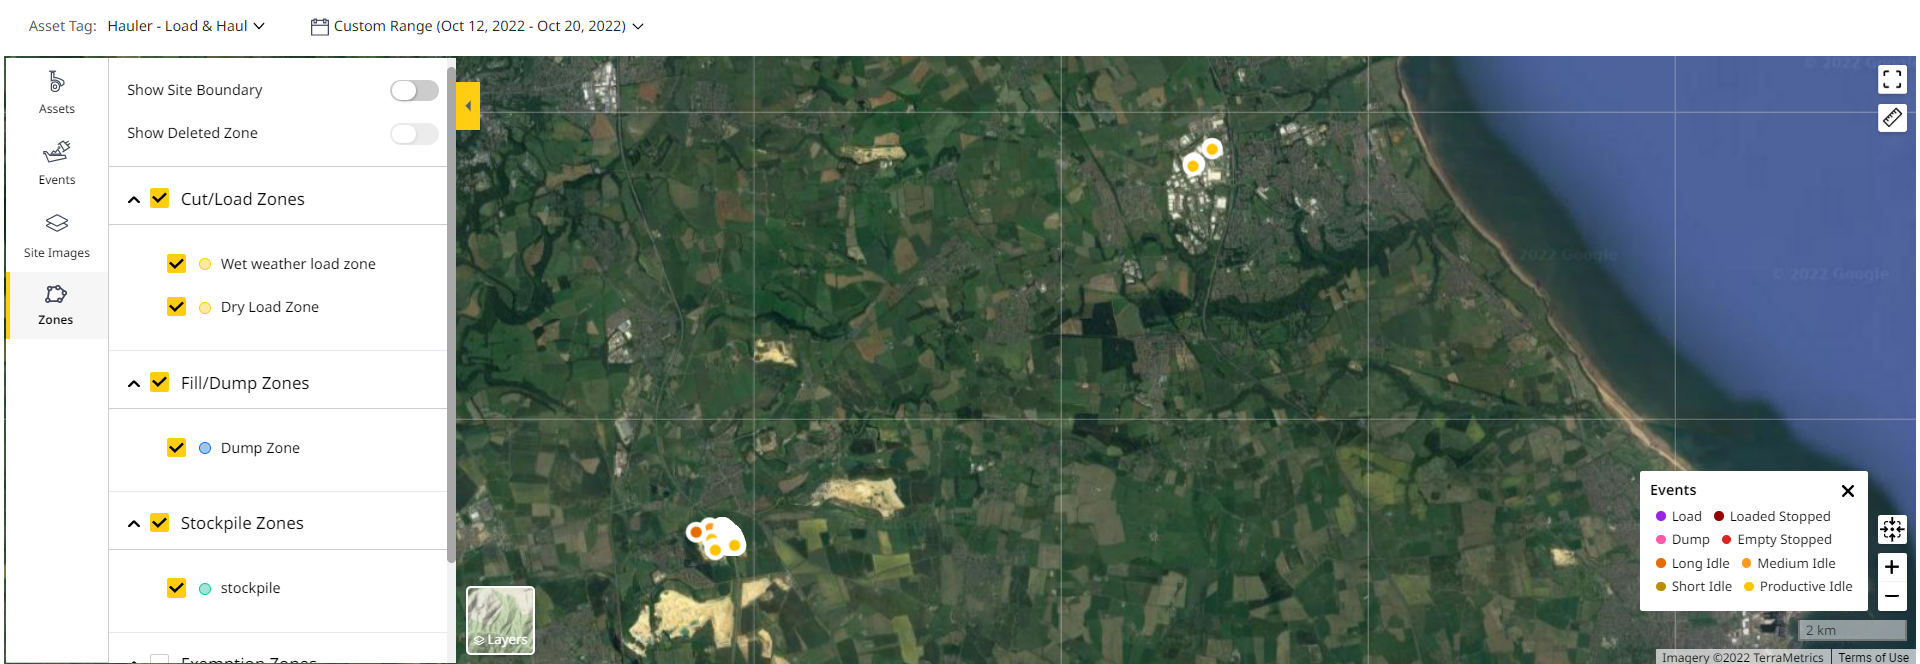
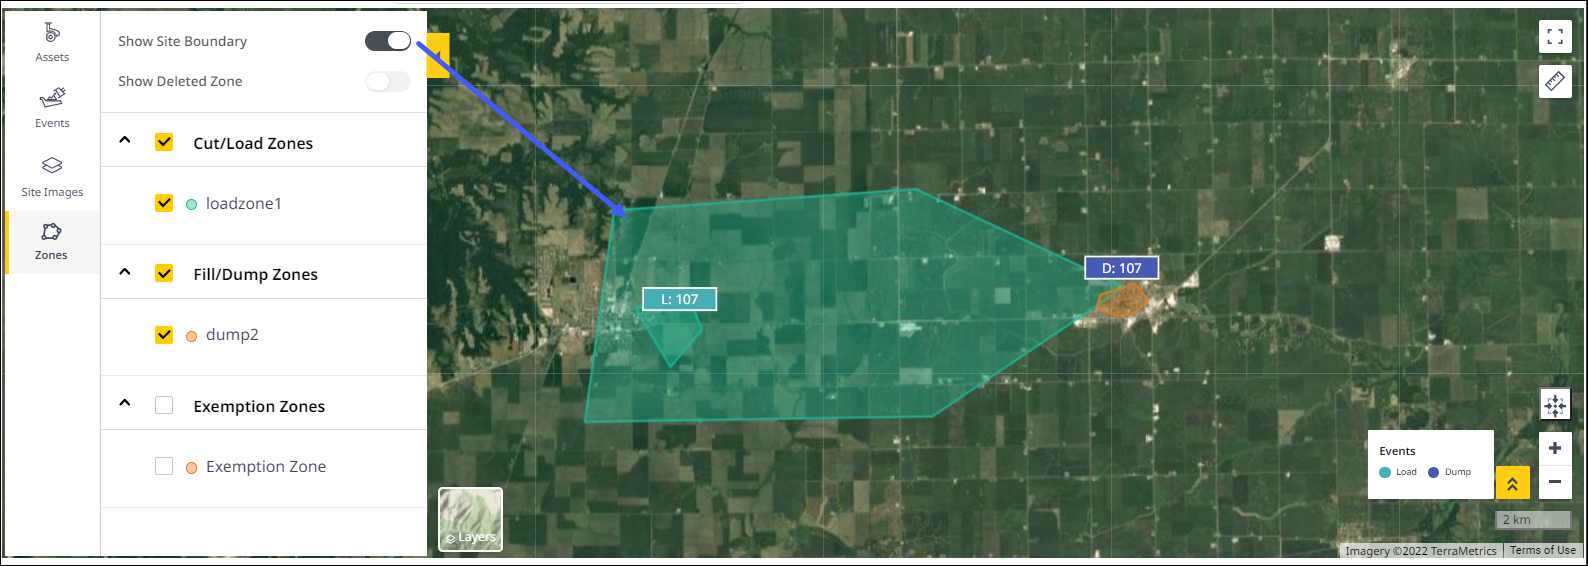
Select or deselect zones as required. Exemption Zones are not selected by default.
-
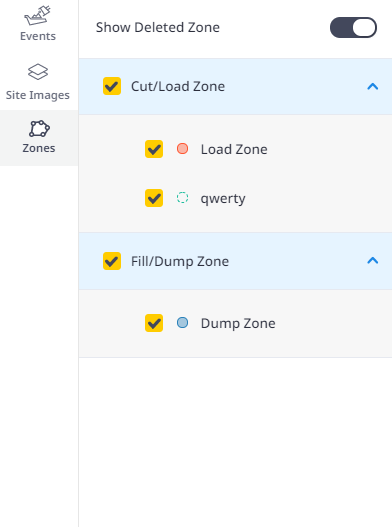
Toggle Show Deleted Zone to view deleted zones. This helps you glimpse a historic view of your site.

Change date range to days when the zones were deleted using the Custom Range option on Date Range Selector. -
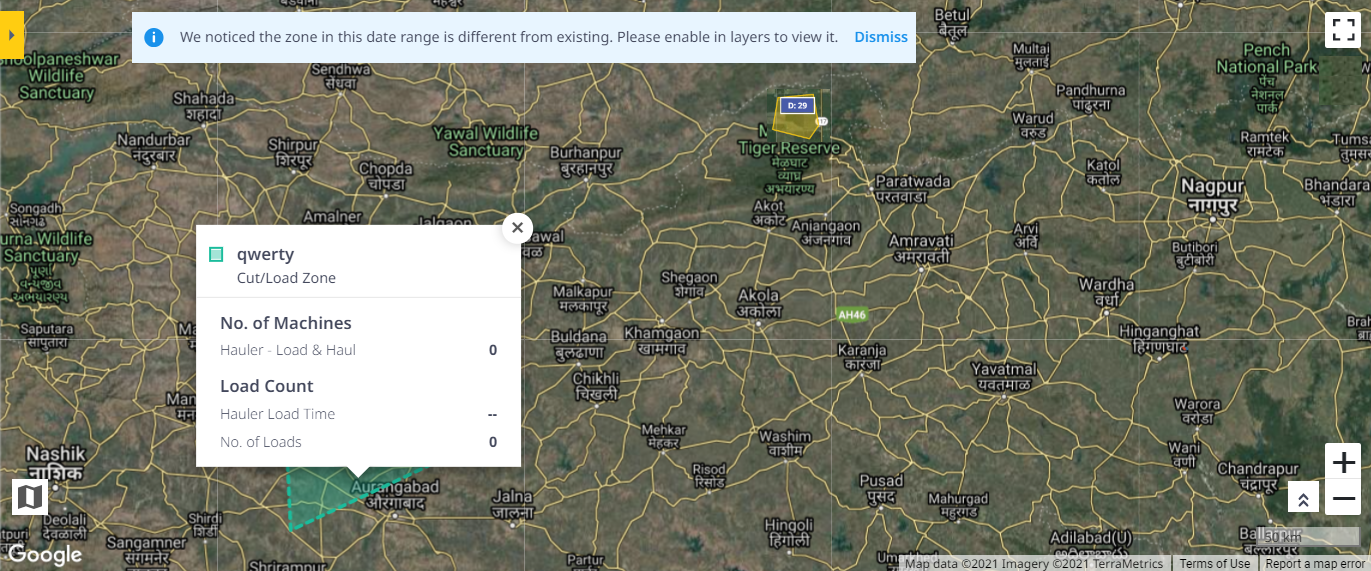
Click on a deleted zone to view asset count and KPI details. The deleted zones are plotted in the Map with dotted lines to differentiate them from active zones.
If active and deleted zones overlap, then view details of the active zone by clicking the overlapped zones. -
Turn Show Site Boundary toggle on/off to view or hide the site boundary. It is enabled only if there is an existing site boundary around your site.
To create a site boundary, refer to Create Zones.
-
Click on a zone in the map to view its details. The respective zone info card opens in place of Zones.
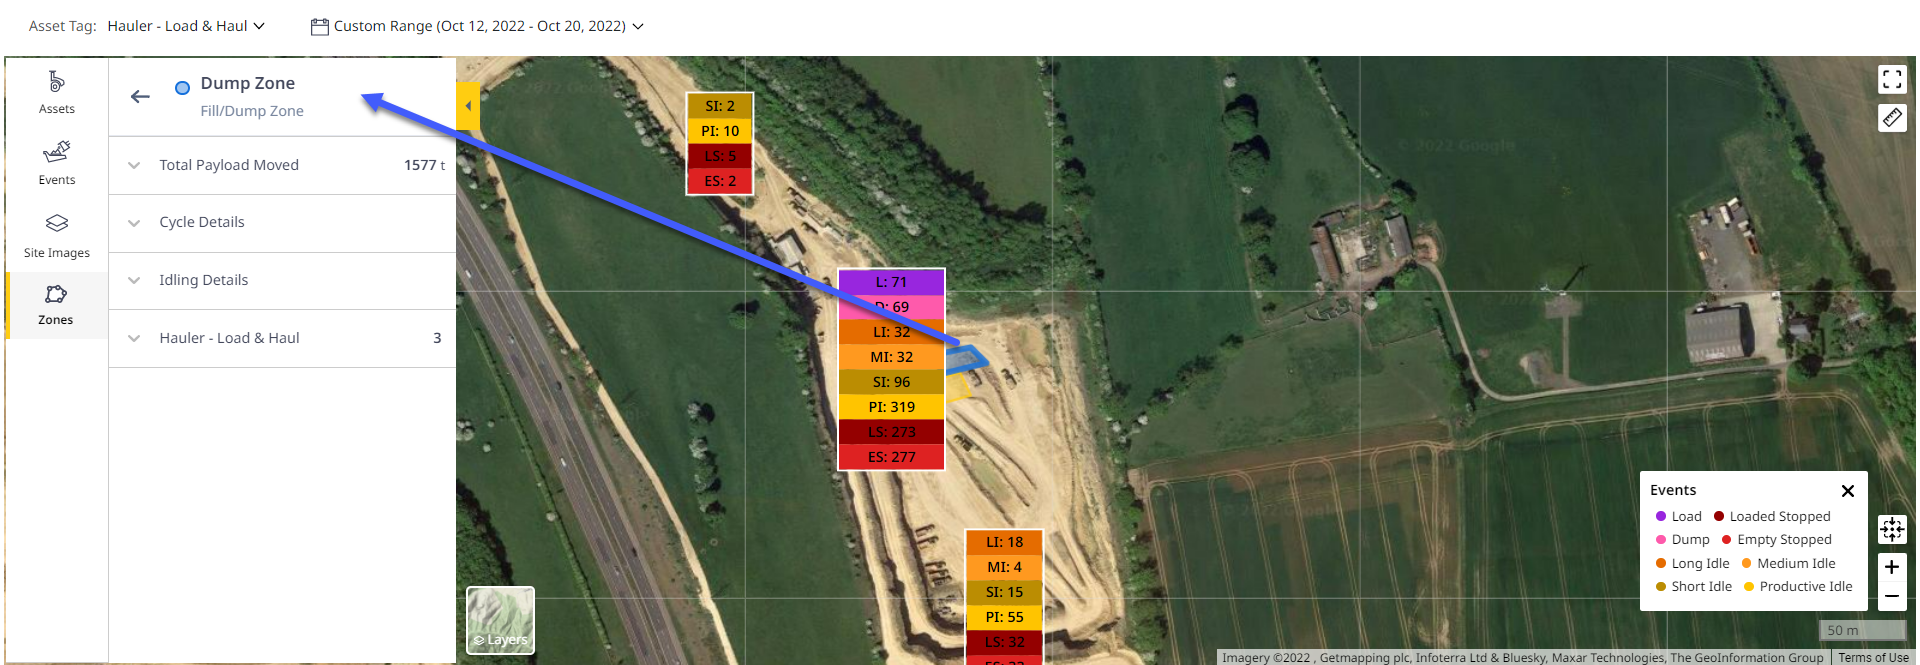
Zone Card Details
On clicking the zone, the slider panel displays detailed information about the zone that you can use to plan and monitor changes.
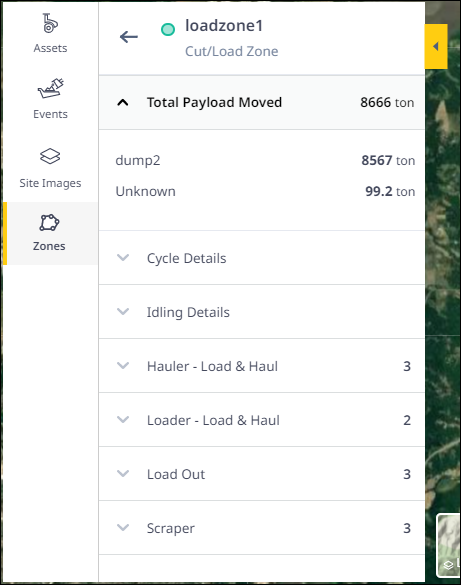
Click drop down ![]() next to the metrics or asset tag in the slider panel to display section-wise breakdowns. These include:
next to the metrics or asset tag in the slider panel to display section-wise breakdowns. These include:
-
Total Payload Moved
-
Cycle Details:
-
Cycles count
-
Total cycles duration
-
Events count
-
Total events duration
-
Average events duration
-
-
Idling Details:
-
Events count
-
Total duration
-
Average duration
-
-
Asset-wise metrics for the zone
-
Total Payload