Safety Dashboard
The Safety Dashboard helps you see, mitigate and manage risk across your created sites.
Analyze safety KPIs on your site cards to understand trends and where you can take action to enable safe and productive work.
With Safety Dashboard, you can also quickly learn about your operators’ seat belt and detect performance at a glance.
To access this dashboard:
-
Navigate to Dashboard.
-
Select Safety. This displays Safety Dashboard.
If you're logging in for the first-time, there will be no site on the Safety Dashboard. You will be prompted to create your first site.
![]()
Click ![]() to get started. For more information, refer to Create Site.
to get started. For more information, refer to Create Site.

• If your assigned account has not created or set up any sites, you will be taken to Assets after logging in.
• The details displayed here are based on what you set on Preferences.
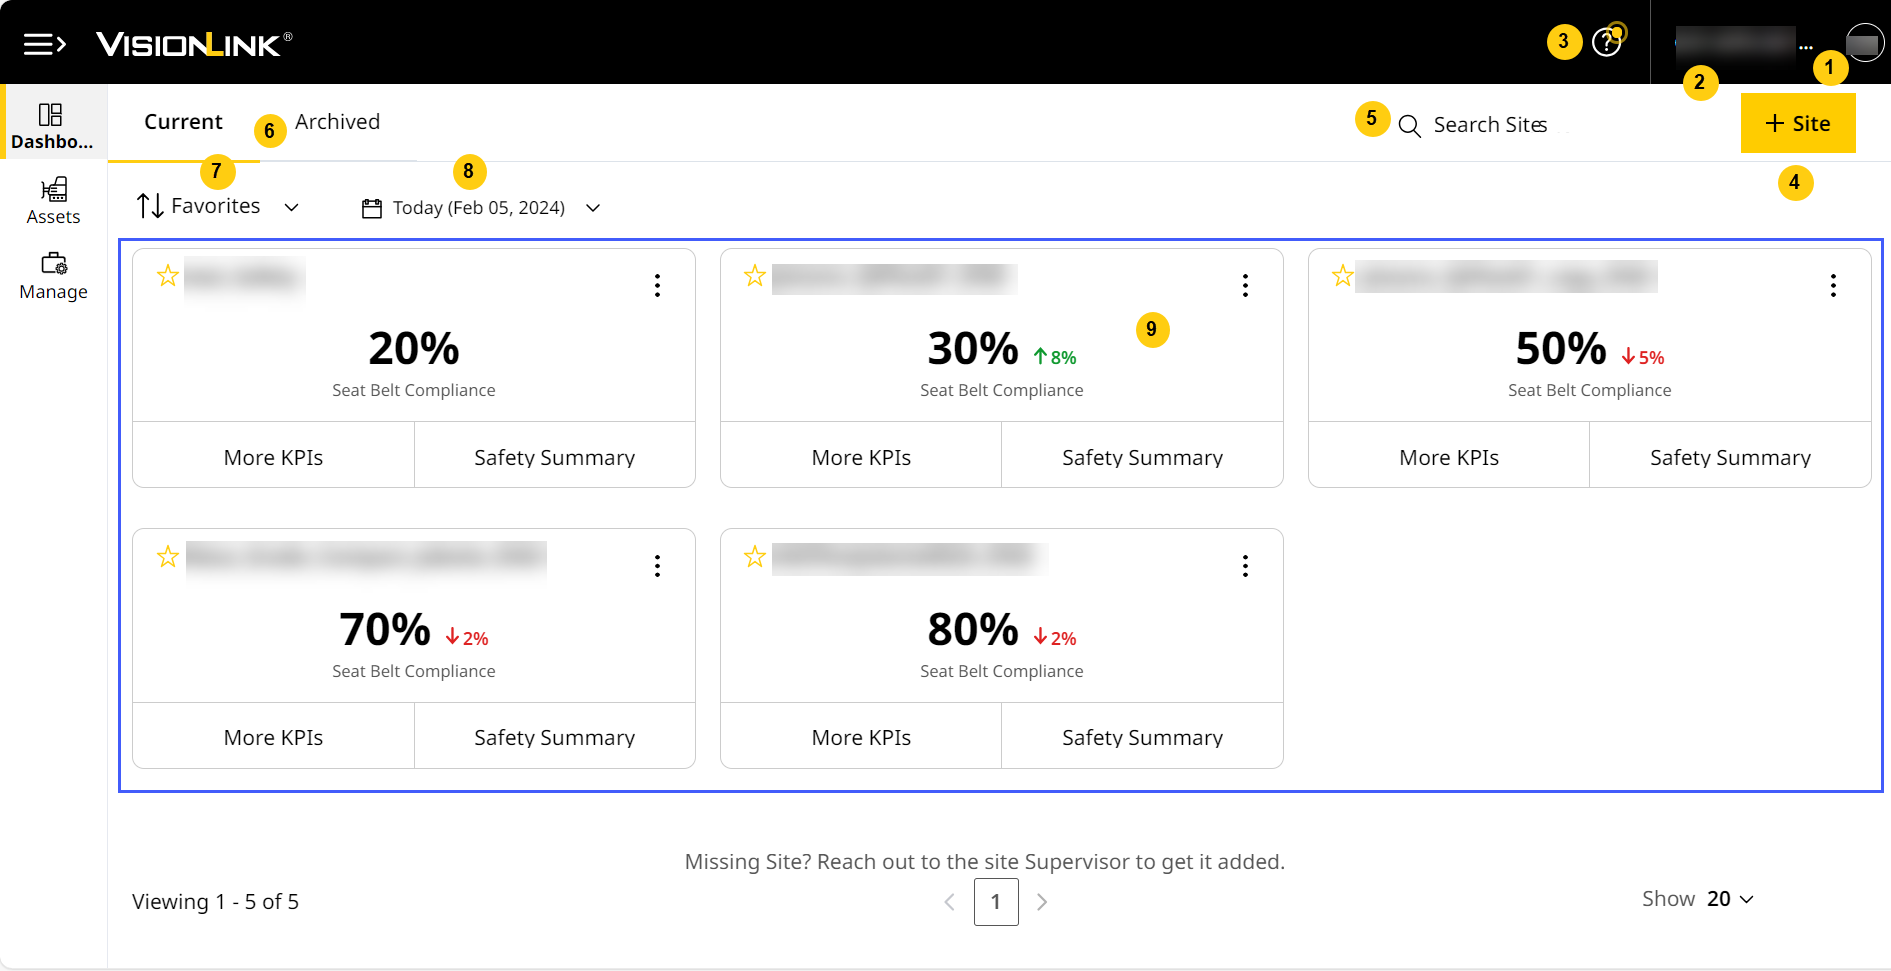
Safety Dashboard includes:
-
User Profile: Consists of a set of settings and details associated when or others log in.
-
Account Selection: Helps switch between available accounts in VisionLink Productivity.
-
Quick Help: Introduces the latest features and updates of the application. Access Quick Help to experience tours and navigate quickly to Help Center and Contact Support.
-
Create Site: Use this to create sites and begin tracking safety data.
-
Search: Find a site using its name. Enter a minimum of three characters to search your account and auto-populate search results.
-
Tabs in Safety Dashboard: Switch between sites reporting data (Current) and archived sites that no longer report data (Archived). Restore archived sites to Current at any time.
-
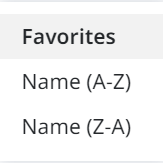
Sort By: Categorize and view sites with the following criteria:
-
Favorites: Click favorite
 to mark a site as your favorite. This sorting option will then display all your marked sites in the beginning
 -
Name (A-Z): Sorts all sites in the Safety Dashboard in ascending alphabetical order.
-
Name (Z-A): Sorts all sites in the Safety Dashboard in descending alphabetical order.
-
-
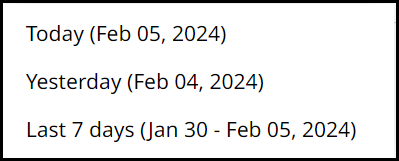
Date Range: Choose between the following to view corresponding safety data on the site cards:
-
Today
-
Yesterday
-
Last 7 days
-
-
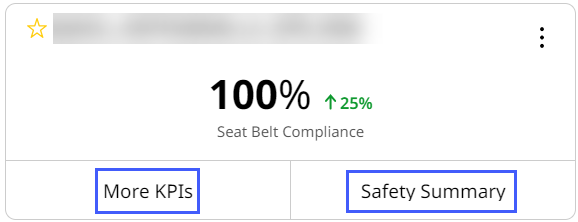
Site Cards: View KPIs vital to your site safety using these cards and track any anomalies that may arise. You can also perform the following:
-
Select More KPIs to display the backside of the site card. Here, you can view more vital KPIs. Refer to Change KPI to know more about configuring what KPIs will display here.
-
Navigate to Safety Summary for the respective site
-
Keep a lookout for downtime alerts for times when the application undergoes updates or maintenance and won't be available.
View ImageView Image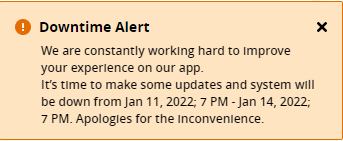
Safety Data Visibility by Subscription
|
Features |
Event Types |
Subscription Tier |
|||
|
Connect |
Connect Pro |
Performance |
Performance Pro |
||
| Safety Dashboard |
✔ |
✔ | |||
| Detect |
|
||||
| Safety (Site) | Seat Belt |
✔ |
✔ | ||
| Detect |
✔ |
✔ | |||
| Assets | Count of Total Seat Belt Violations | ✔ | ✔ | ✔ | ✔ |
| Count of Total Detections | ✔ | ✔ | ✔ | ✔ | |
| Seat Belt | ✔ | ✔ | |||
| Detect | ✔ | ✔ | |||
| Safety Summary Report | Seat Belt | ✔ | ✔ | ||
| Detect | ✔ | ✔ | |||
Seat Belt data from an asset transmits via satellite connection, whereas Detect data doesn't support this capability.