July 2020
Improvements in Create Site
The following enhancements are available in Create Site:
-
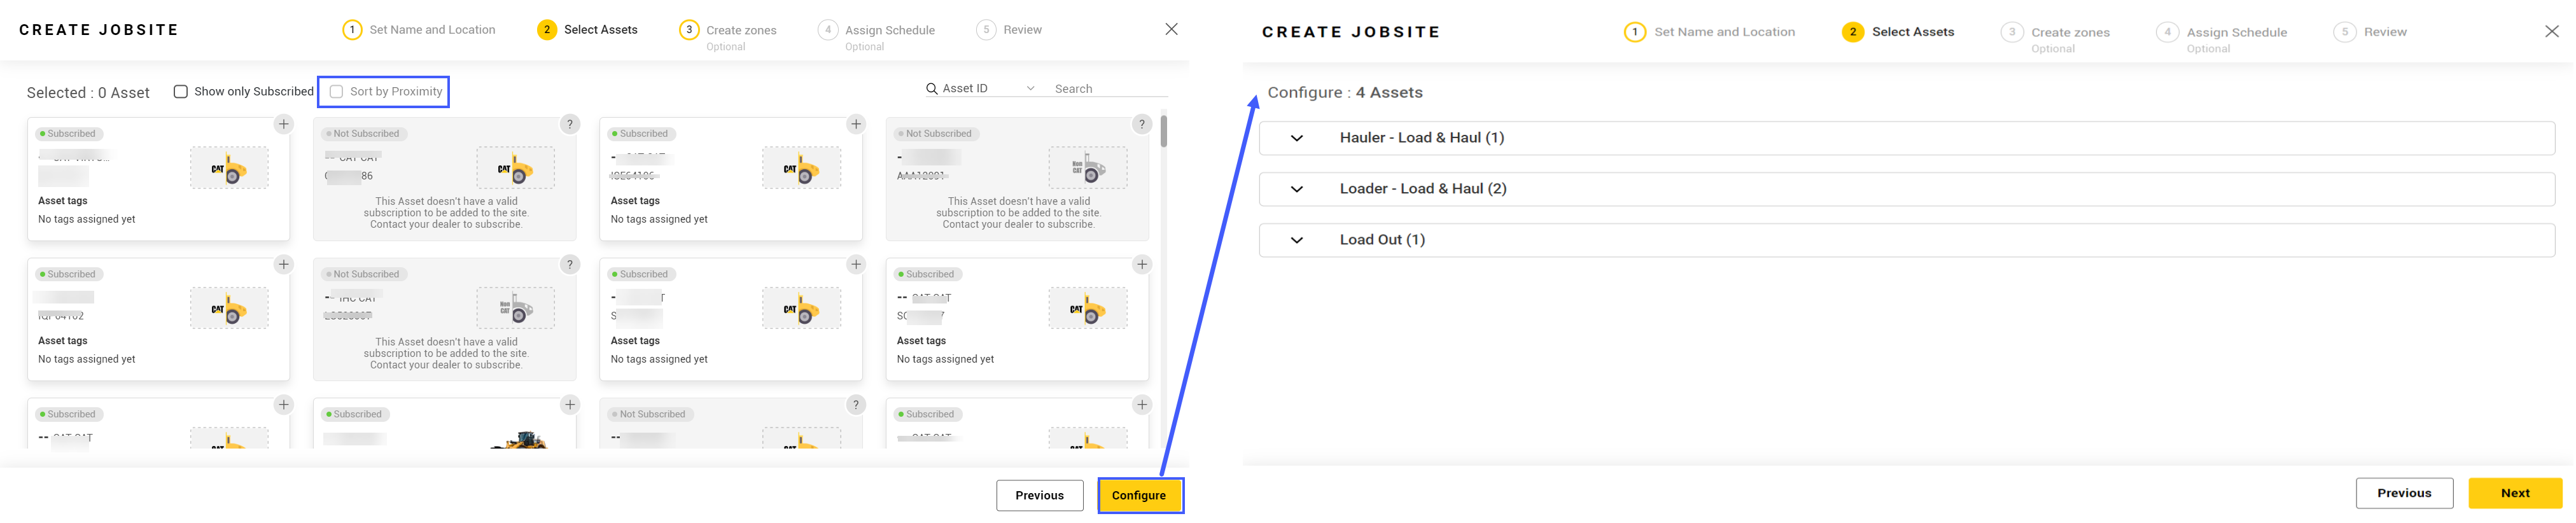
The Select Asset step is now redesigned with Configure to assign tags for the assets. Most of the assets are now auto tagged. Also provide capacity values for Hauler – Load & Haul asset tag to calculate the volume and payload KPIs of the site.
-
The Sort by Proximity check box is now introduced in Select Asset to sort the subscribed assets within proximity range (i.e., 1 mile = 1.61 km) of location. The subscribed assets sorted by proximity range is displayed in the first row followed by remaining subscribed assets.
-
Map view of the Set Name and Location and Create Zones have been redesigned with satellite and road map icons so that you can toggle between satellite and road Map views. The Recenter icon is also been introduced allowing users to focus back on the selected location after panning the map view. The map icon is replaced to pin icon in the map of Create Zones.
-
An information message been introduced at top of the Assign Schedule to help understand that target lines are added for Load Count, Payload and Estimated Volume column charts only when you have assigned schedule for the site.
-
View Asset ID and Serial Number throughout VisionLink Productivity.
Usability Improvements in Site Summary
Several usability enhancements have been made in Site Summary.
-
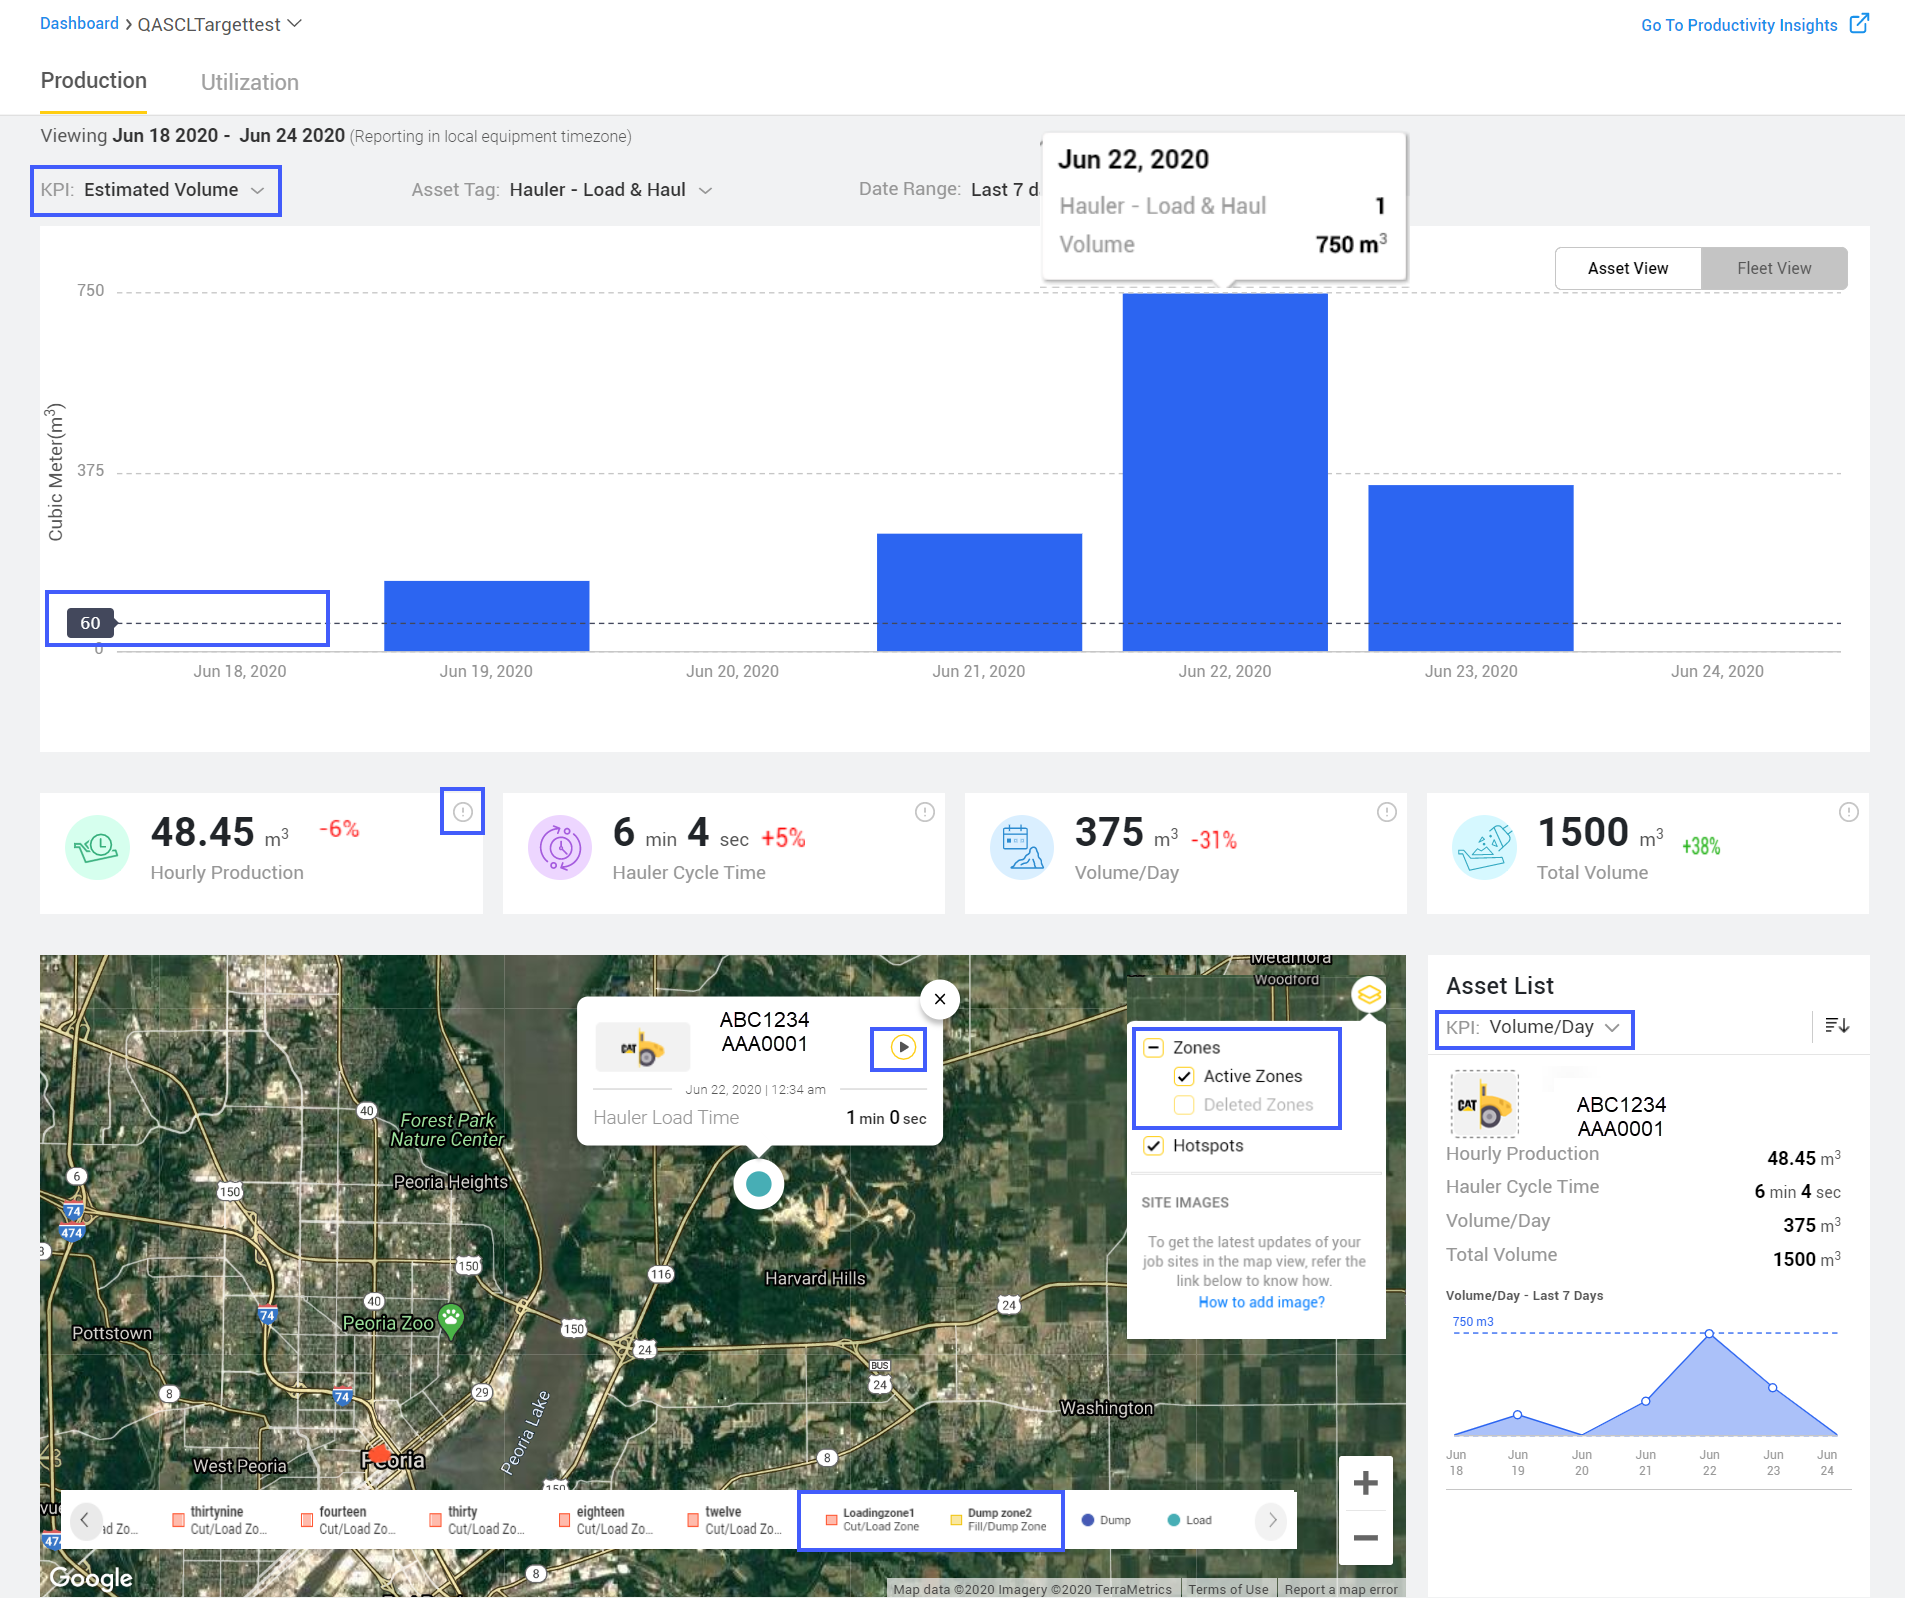
Estimated Volume KPI is now listed under the Production. View volume details for Hauler – Load & Haul asset type of respective site based on selected date range.
-
Target line is displayed in the column chart of Load Count, Payload and Estimated Volume KPI under Production based on the target settings made in Target and assigned schedules in Create Site. Now , estimate that the configured targets are met and compared with each day to the targets.
-
An info
 is displayed in each KPI card of selected asset tag for the site. Now view the definition of each KPI parameters and a help link that redirects to help document for detailed information of KPI details.
 -
Playback View option is introduced in individual asset details pop-up of map view for the selected KPI, asset tag, site and date range. Play and view the movement of assets between load and dump events in map for 24 hours.
-
Active and deleted zones check boxes are displayed in layers icon of the map view. Select or deselect zones for comparing the active and deleted zones to track the already created zones based on selected date range.
-
In site card, the target values are displayed based on the quarry industry type.
-
View the change of loading and dumping zones name throughout VisionLink Productivity. The Loading zone name is changed as Cut/Load zone. The Dumping zone name is changed as Fill/Dump zone.
-
In the asset list section, the Sort by option is now changed as KPI and the area chart is displayed based on the selection of KPI drop-down list.
Enhancements in Productivity Insights
The following enhancements are available in Productivity Insights:
-
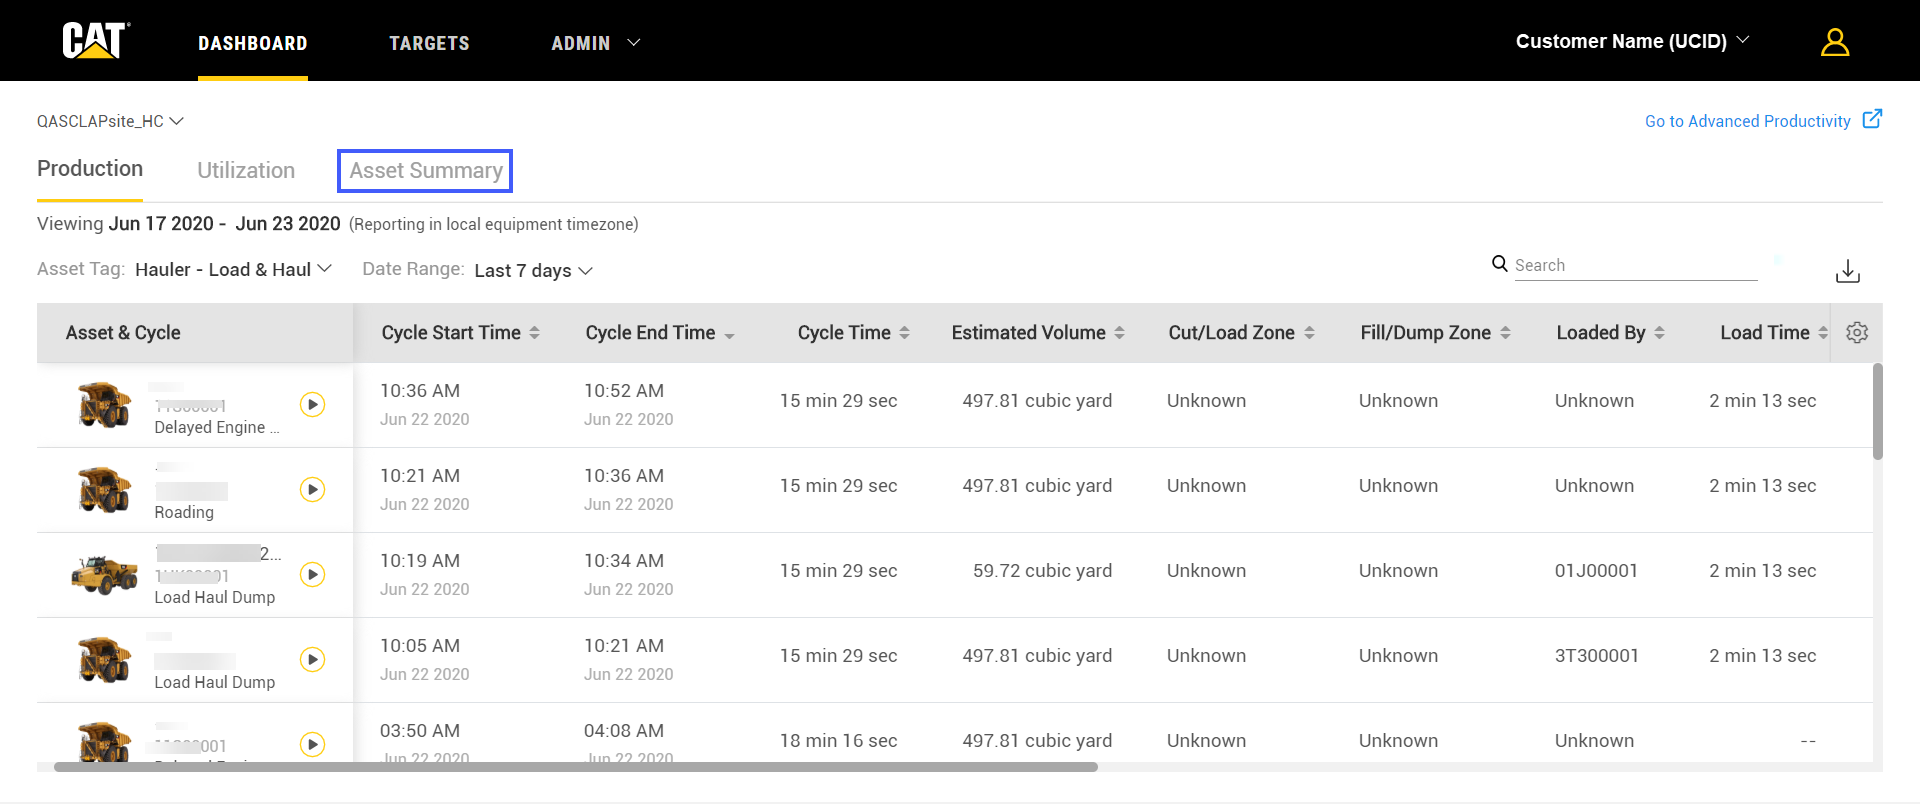
Asset Summary is now included in Productivity Insights. Easily view overall production cycle details of the asset for selected site.
-
View Truck ID and Material ID related details in the column table for Loader - Load & Haul and Load Out asset tags on Production.
Inclusion of Preview Option in Schedule Report Page of Report Management
You can now view templates of the summary or comparison report with Preview. Get a prior understanding of how your final scheduled reports will look like.