November 2021
View Custom Lists and Printer Ticket Numbers Now
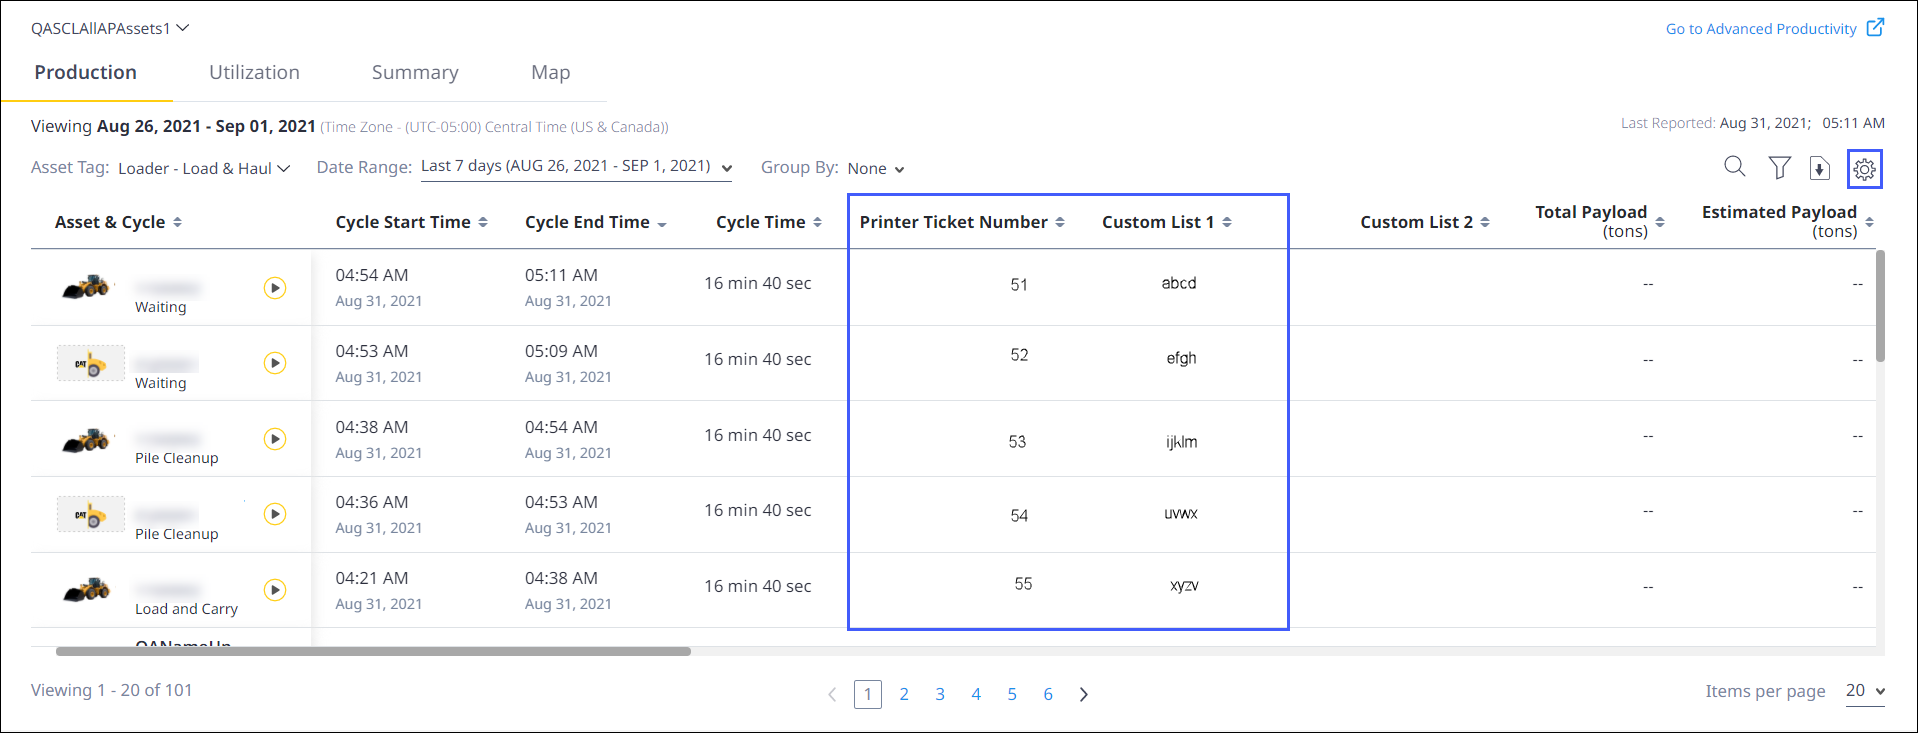
View Printer Ticket Number and up to four custom list columns for Loader – Load & Haul and Load Out assets, as part of the Production of Productivity Insights. They need to be configured with settings ![]() as they are not displayed by default.
as they are not displayed by default.
Now View Timewise Summary of Site Activities
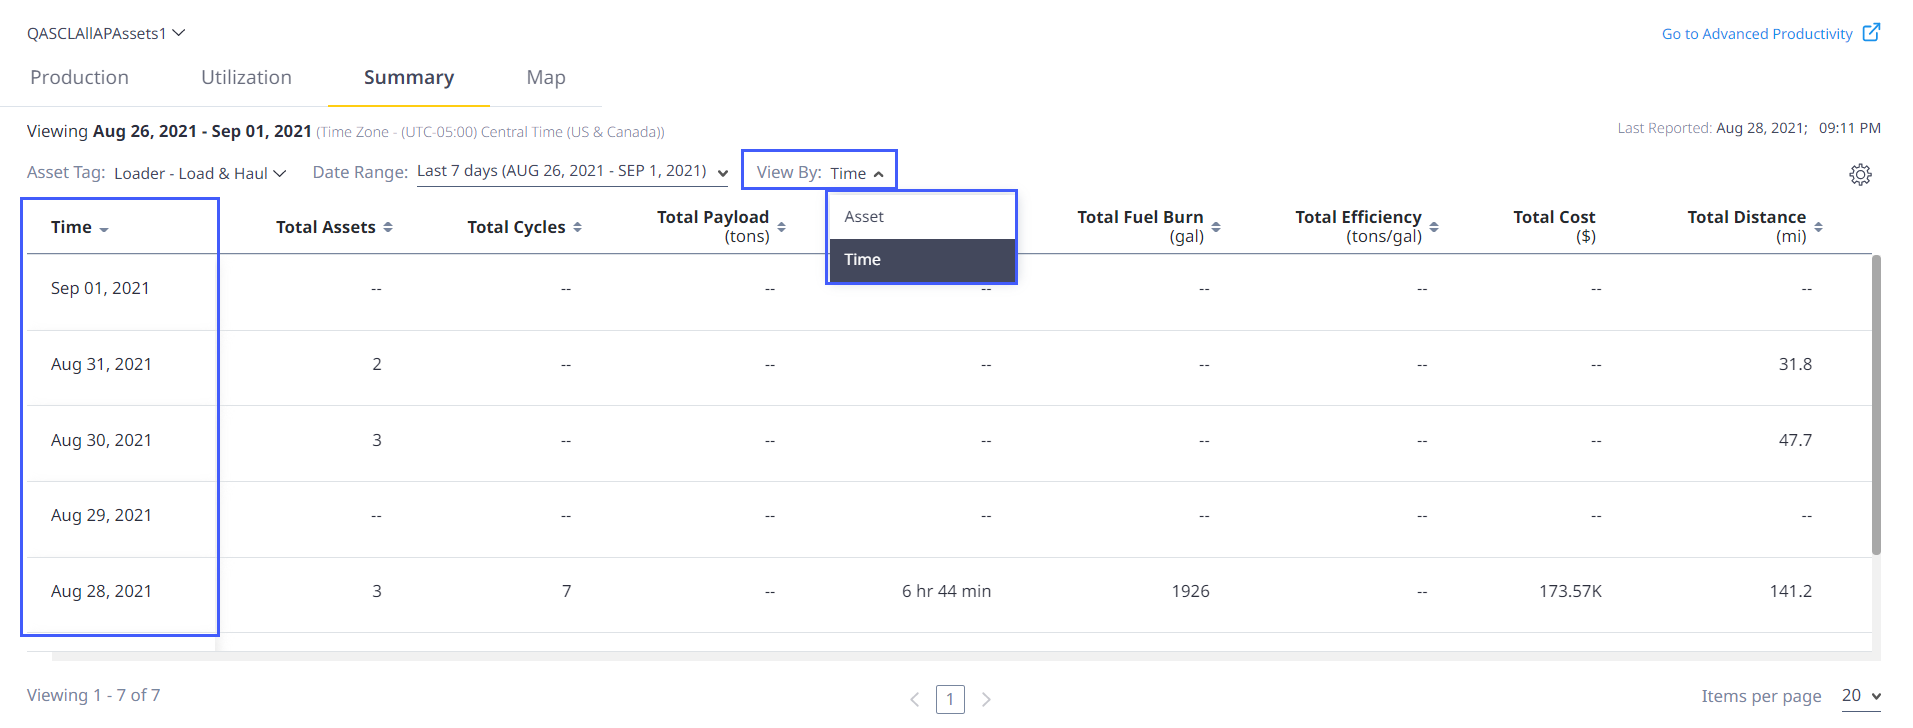
On Summary, select Time under the View By drop down to view timewise summary. This helps to view, compare and analyze corresponding KPIs on a day-to-day or hourly basis for all asset tags.
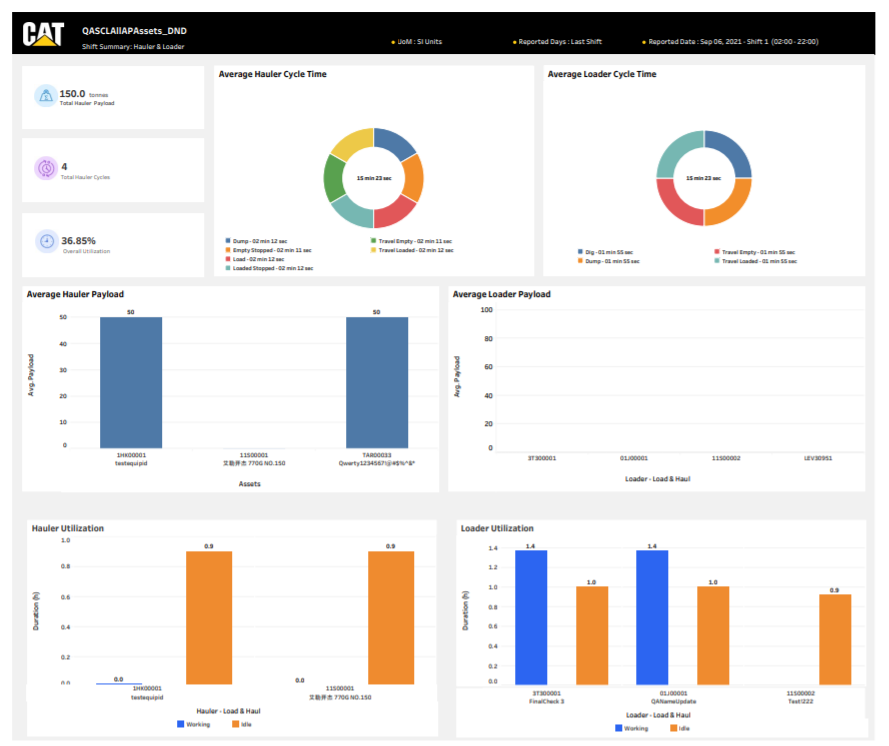
New Asset Tags Included in Shift Summary Reports
You can now view production and utilization data for hauler, loader, load out and scraper assets in Shift Summary Reports.
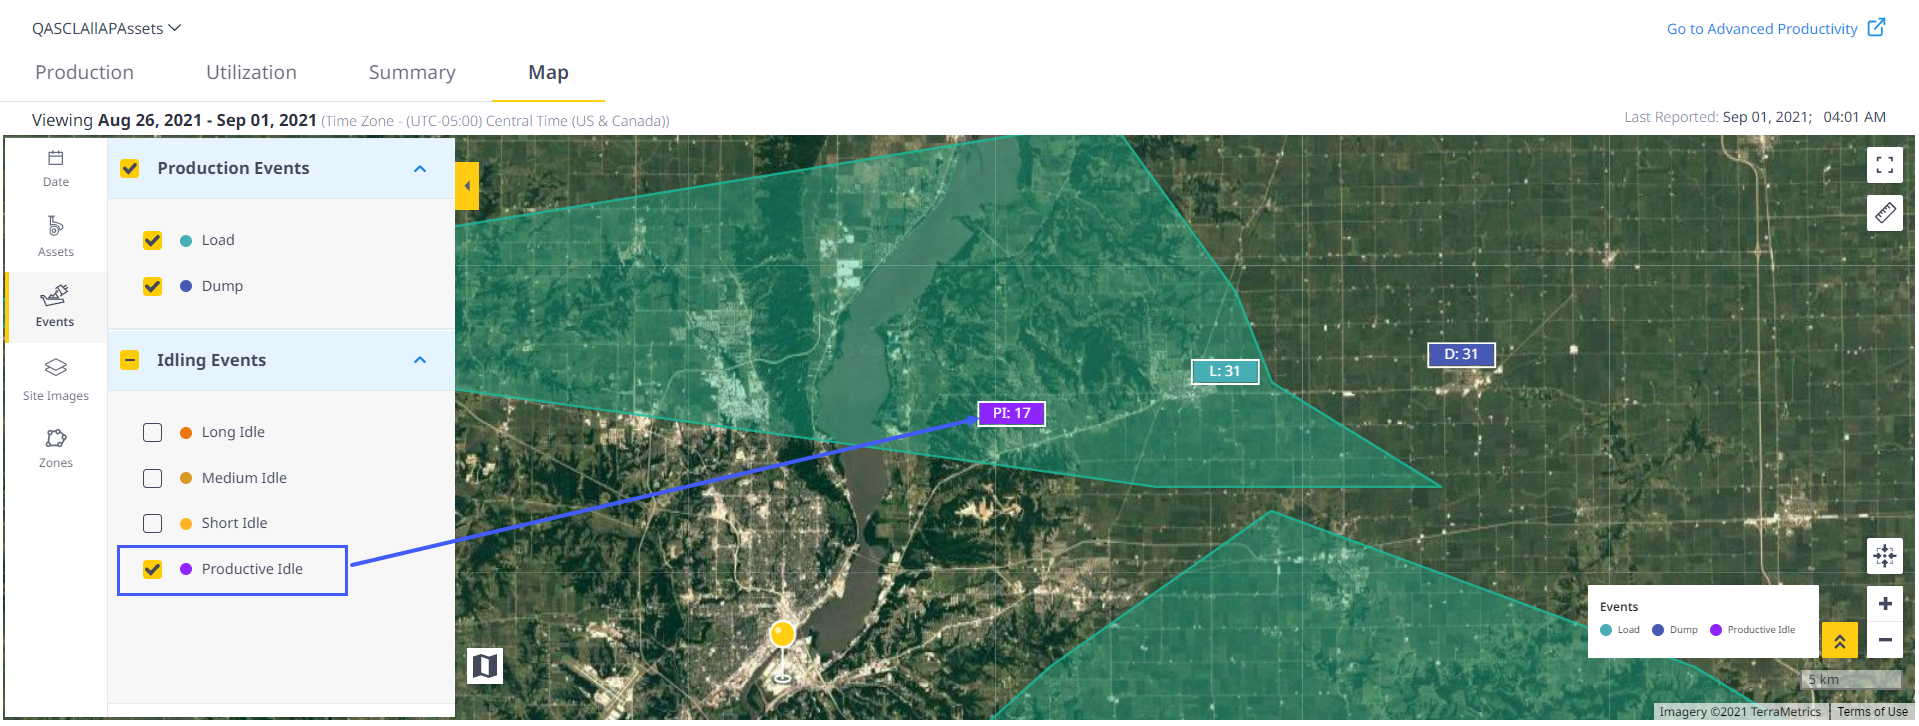
Now View Productive Idle Events on Insights Map
Productive Idle events are now available under the Events section on slider pane of the Insights Map. On clicking the hot spot, view the productive idle events and their corresponding duration.
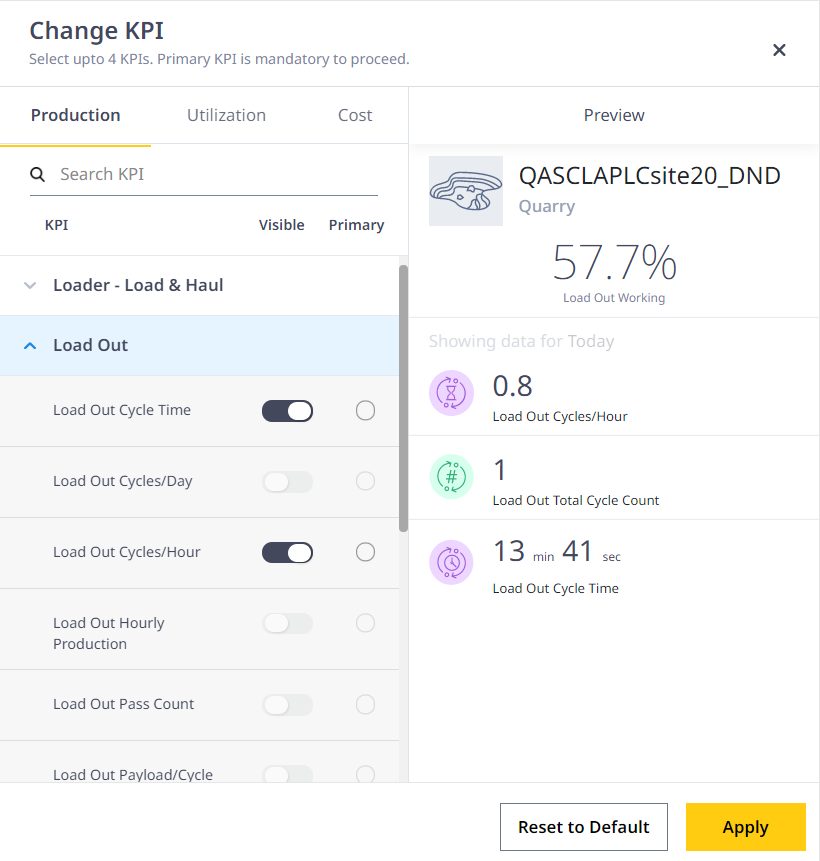
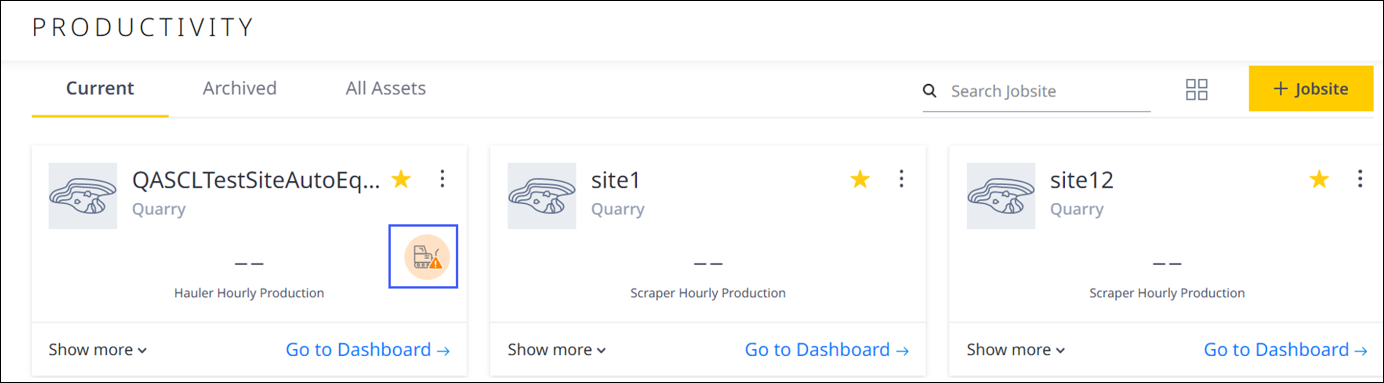
Configure KPIs for Site Cards in Productivity Dashboard
Click Show More of the site card to configure or change the four KPIs of individual site cards according to their preferences.
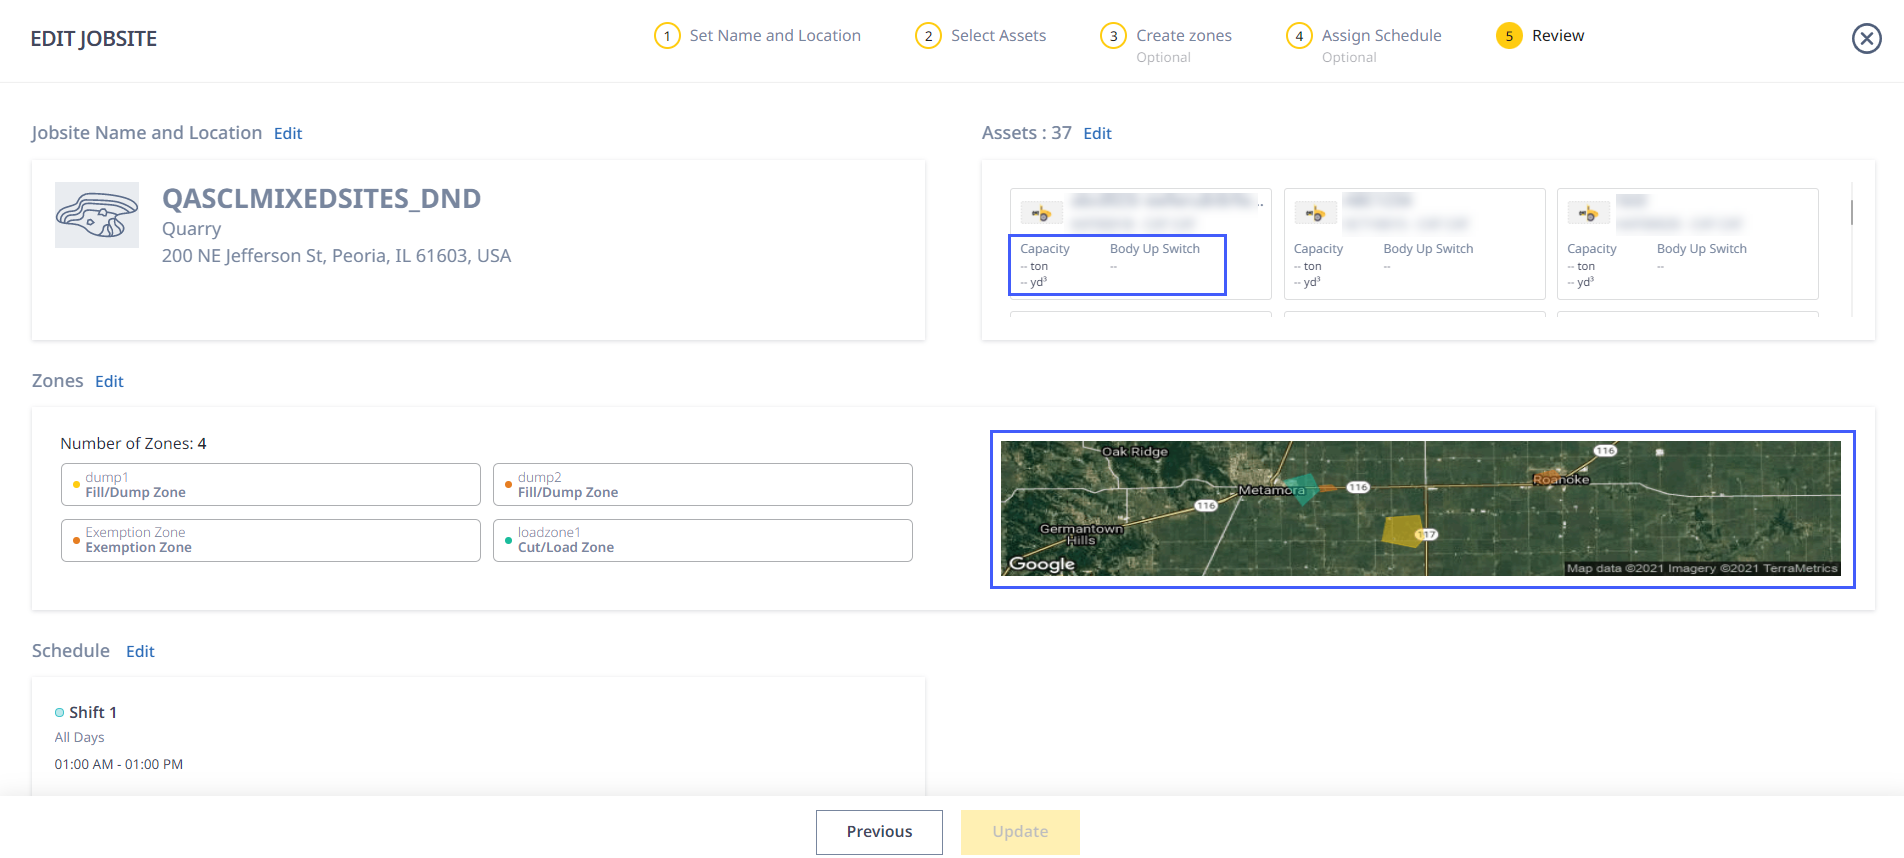
View Capacity, Switch Configuration and Zone Map on Site Review
View Capacity, Body Up Switch Configuration and a map view of Zones in Review during the Create or Edit Site process. This information provides greater understanding of asset configuration and gives a bird’s eye view of the newly added or edited zones.
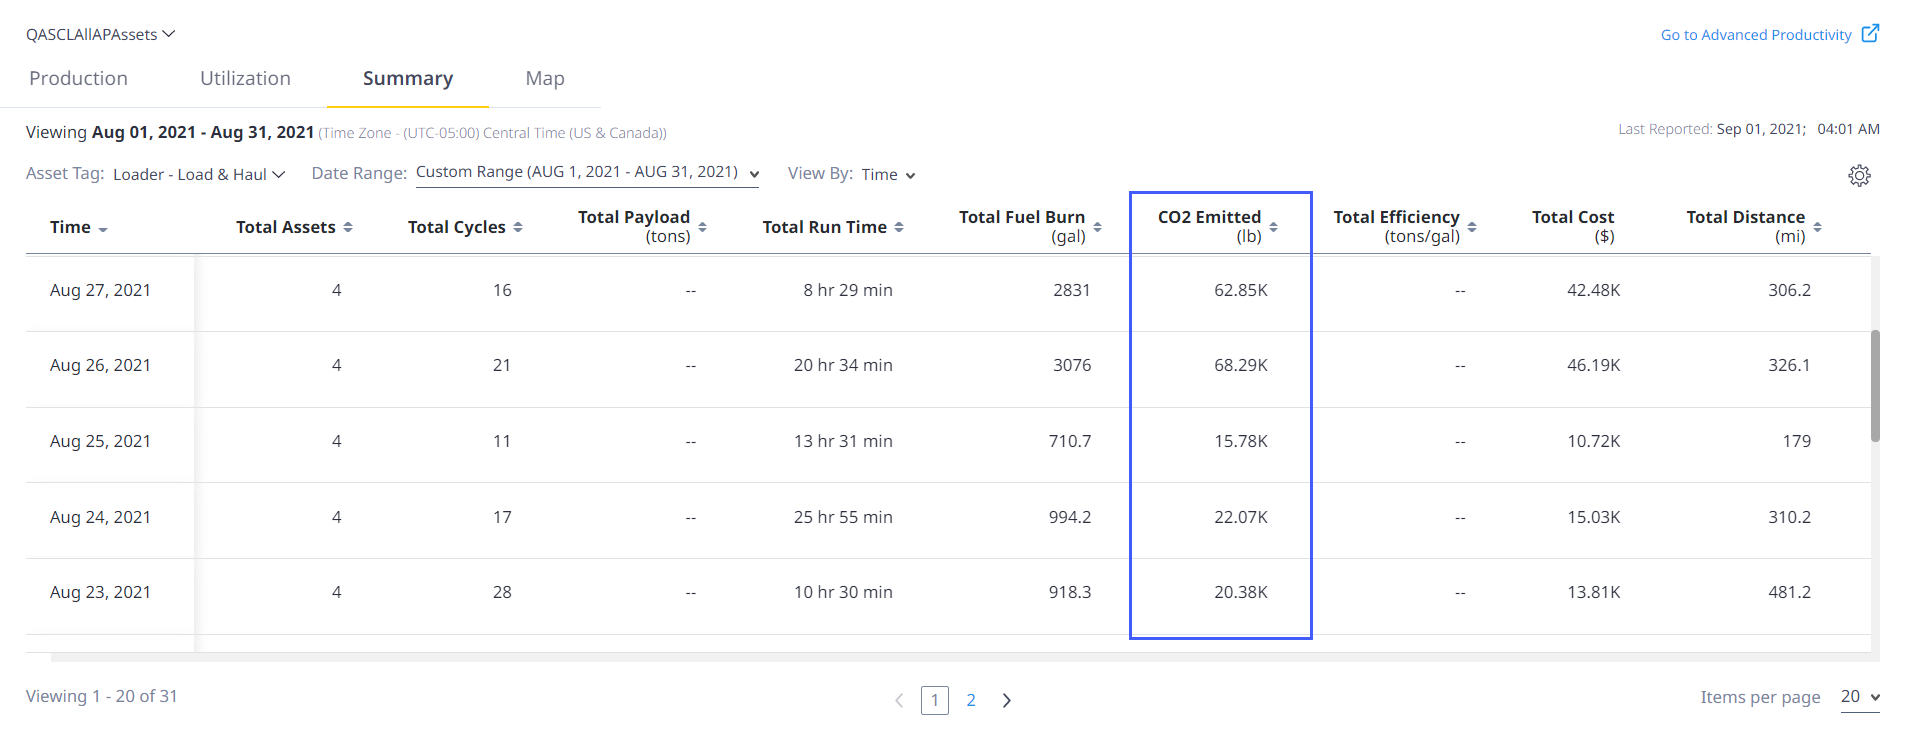
Analyze Your Site Carbon Footprint on Insights Summary
View the carbon footprints created by assets in a site under the CO2 Emitted column on Summary. It is calculated in pounds (lb) or kilograms (kg), depending on the unit of measurement chosen on Preferences.
Stay Notified on New Asset Entry and Exit on Sites
The asset found notification alerts you about any subscribed assets entering or leaving the site boundary. It helps you configure and add these assets to the site easily.
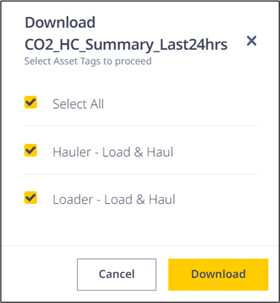
Customize Your Insights Report (CSV) Downloads
Now download Insights Report (CSV) for one or more relevant asset tags rather than for all asset tags at once. This will help users download only targeted data.
View Utilization Data More Efficiently with Group By Options
You can view utilization data grouped by Asset Serial Number, Zone, Working State and Sub State. It allows them to analyze resource utilization more efficiently.

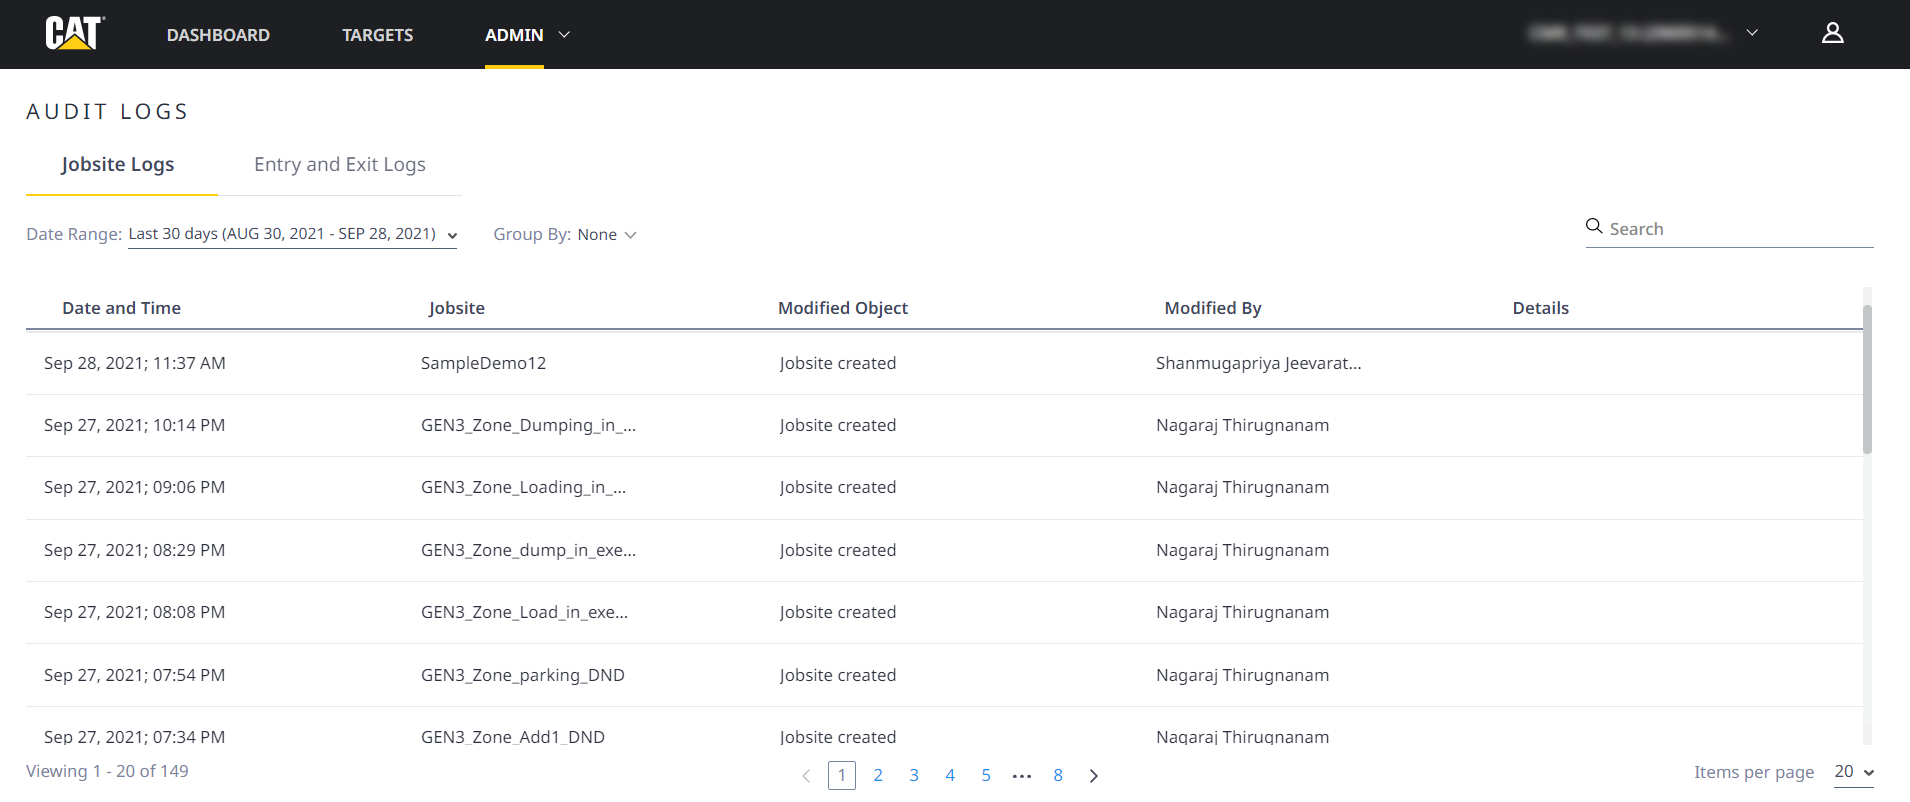
Now View Historical Updates to A Site in One Place
Audit Logs under Admin are records of all site modifications, and the entry and exit events of assets under an account. They help you identify the changes made to assets and sites by other Admin users using the same account.
Analyze Cost Breakdowns and Overall Impact Instantly
View and estimate overall cost breakdowns of a site under Cost. It visually represents the cost KPIs in chart and map view for the site.

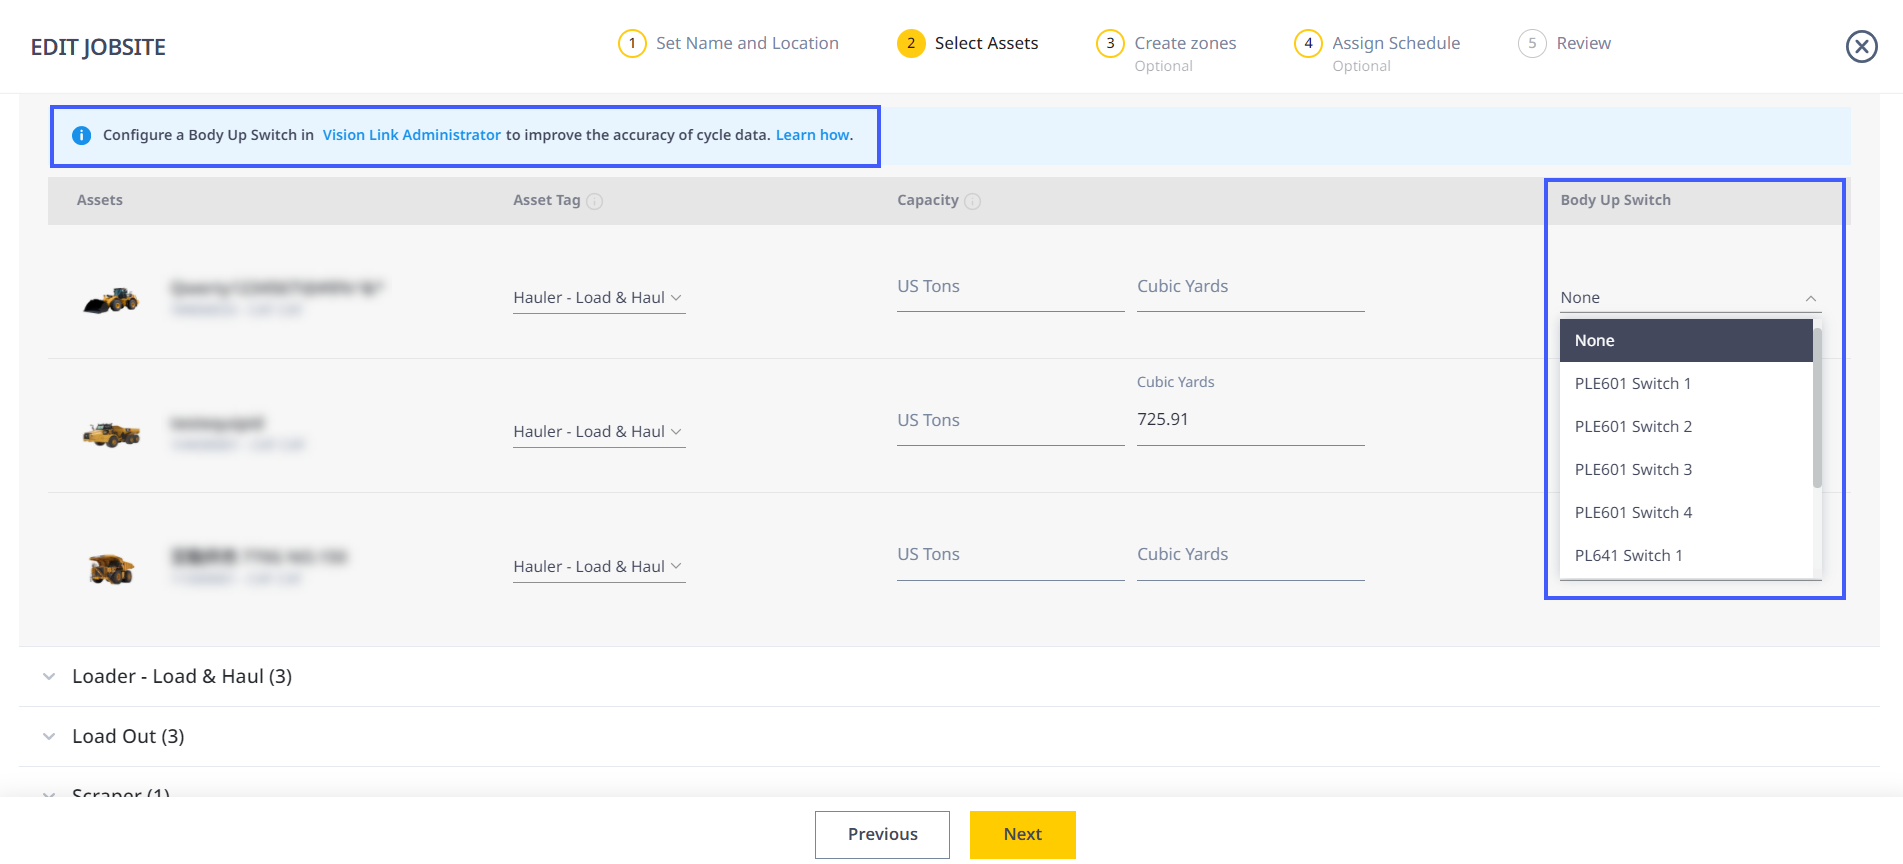
Configure Body Up Switches for Haulers – Load & Haul Assets
Enable switch monitoring for hauler assets to improve the Dump event accuracy for a site. Body up switches need to be configured in VisionLink and enabled on Select Assets during site creation or modification.
Missing Cycles During Long Cycle Time Found and Issue Resolved - CPI 496857
[Cycles are missing during long cycle time]
A robustness update performed to decrease the chance of long cycles occurring and to provide the cycles which were missed prior to this update has rectified the issue.
Cause of Incorrect Data Reported for Loader Identified and Rectified – CPI 496397
[Loads/Hour value incorrect for the loader on 18th Aug]
With the addition of Engine Start working state, the issue of incorrect data being reported is now resolved. The Loads/Hour KPI now displays accurate values.