- + jobsite
- acceptable use policy
- account
- add user
- android
- answer
- april 2020
- archive
- asset tags
- assets
- assign schedule
- august 2020
- august 2021
- august 2022
- Average
- body up switch
- browser
- carbon footprint
- card error
- change KPI
- chrome
- CO2 emitted
- cookie
- copy site
- copyright
- cost kpi
- cost setup
- cost tab
- create
- currency
- custom list
- cut/fill
- dashboard
- december 2019
- december 2020
- december 2021
- delete site
- delete user
- digital offering
- dollar
- edit site
- edit targets
- edit user
- euro
- exemption
- FAQ
- favorite
- february 2020
- fill/dump
- filter
- firefox
- fleet
- frequently asked questions
- geofence
- getting started
- grid
- guide
- help
- ID
- insights reports
- introduction
- ios
- january 2020
- january 2021
- january 2022
- july 2020
- june 2022
- KPI
- KPI hierarchy
- landing page
- legal
- list
- list summary views
- load site
- login
- logout
- machine
- map tab
- march 2021
- march 2022
- material
- material list
- may 2020
- may 2021
- may 2022
- measurement
- more option
- november 2021
- october 2020
- october 2021
- october 2022
- overview
- playback view
- policy
- preferences
- primary KPI
- production tab
- productivity
- productivity insights
- question
- remove site
- renminbi
- report management
- report type
- restore site
- review
- safari
- schedule
- select assets
- september 2020
- set name and location
- shift
- shift comparison report
- step 1
- step 2
- step 3
- step 4
- step 5
- stockpile
- summary tab
- support
- telematics
- total cost
- user
- visionlink
- walkthrough
- zones
Insights
Use on Site Summary to open Insights.
Insights allows you to deeply analyze cycle and asset levels for determining the root cause parameters of production and utilization downfall for the selected site. Compare the productivity at cycle or asset level.
-
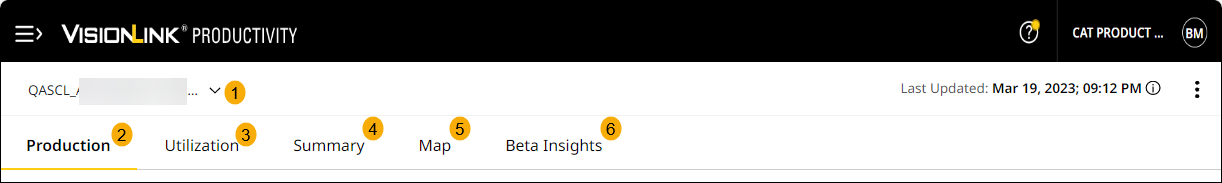
Site Drop-down List: Select the preferred site to view its production and utilization details. The timezone (country/city) is displayed near Viewing <selected date range>, based on the selected site location. Refer to Create Site for more information on creation of site.
-
Production includes cycle related details of a site.
-
Utilization includes asset related details of a site.
-
Summaryincludes productivity cycle related details of asset in a site.
-
Map displays the location related data plotted on a map.
• The details across all Insights are displayed based on your preferences settings.
• The last reported maximum cycle and utilization end time of the assets are displayed at the right-hand side of Production, Utilization and Summary on Insights.
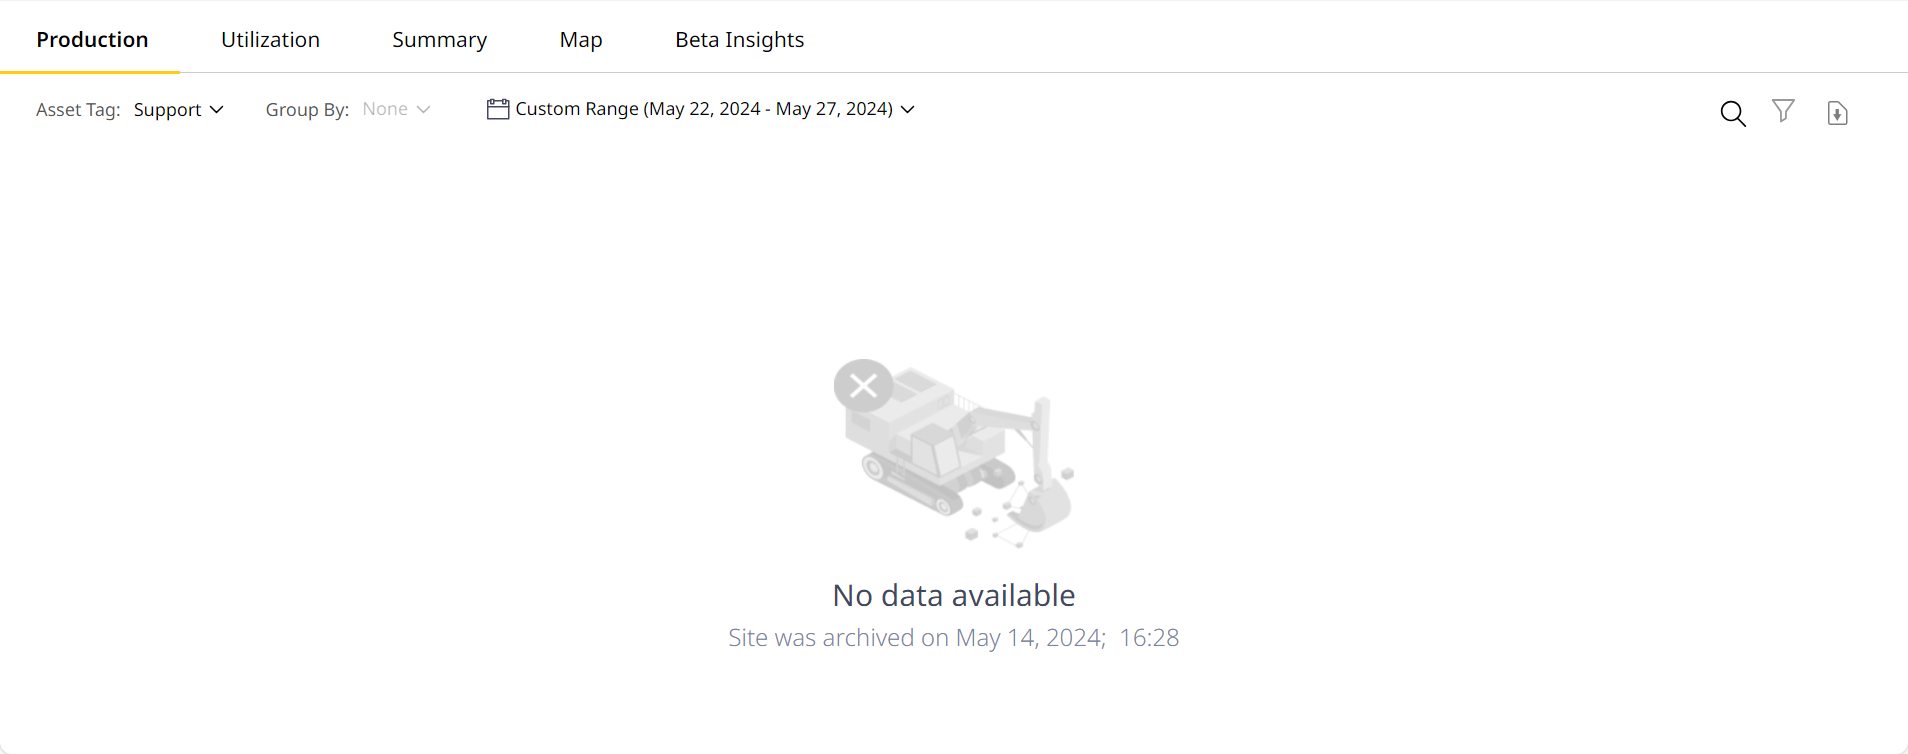
• The following error message is displayed if the archived site is selected on Insights and the date range is after the archive date.
• Refer to Archive Site for more information about archiving and restoring sites.