Site Summary Filters
On Site Summary, you can filter data by assets or shifts. These selected filters allow you to measure and analyze data across chart view, KPI cards and map view.
The filter works with sorting options (by Asset Tag, KPI and date range) to provide even more granular view of your site performance.
You can filter data on the following Site Summary tabs:
To filter data:
-
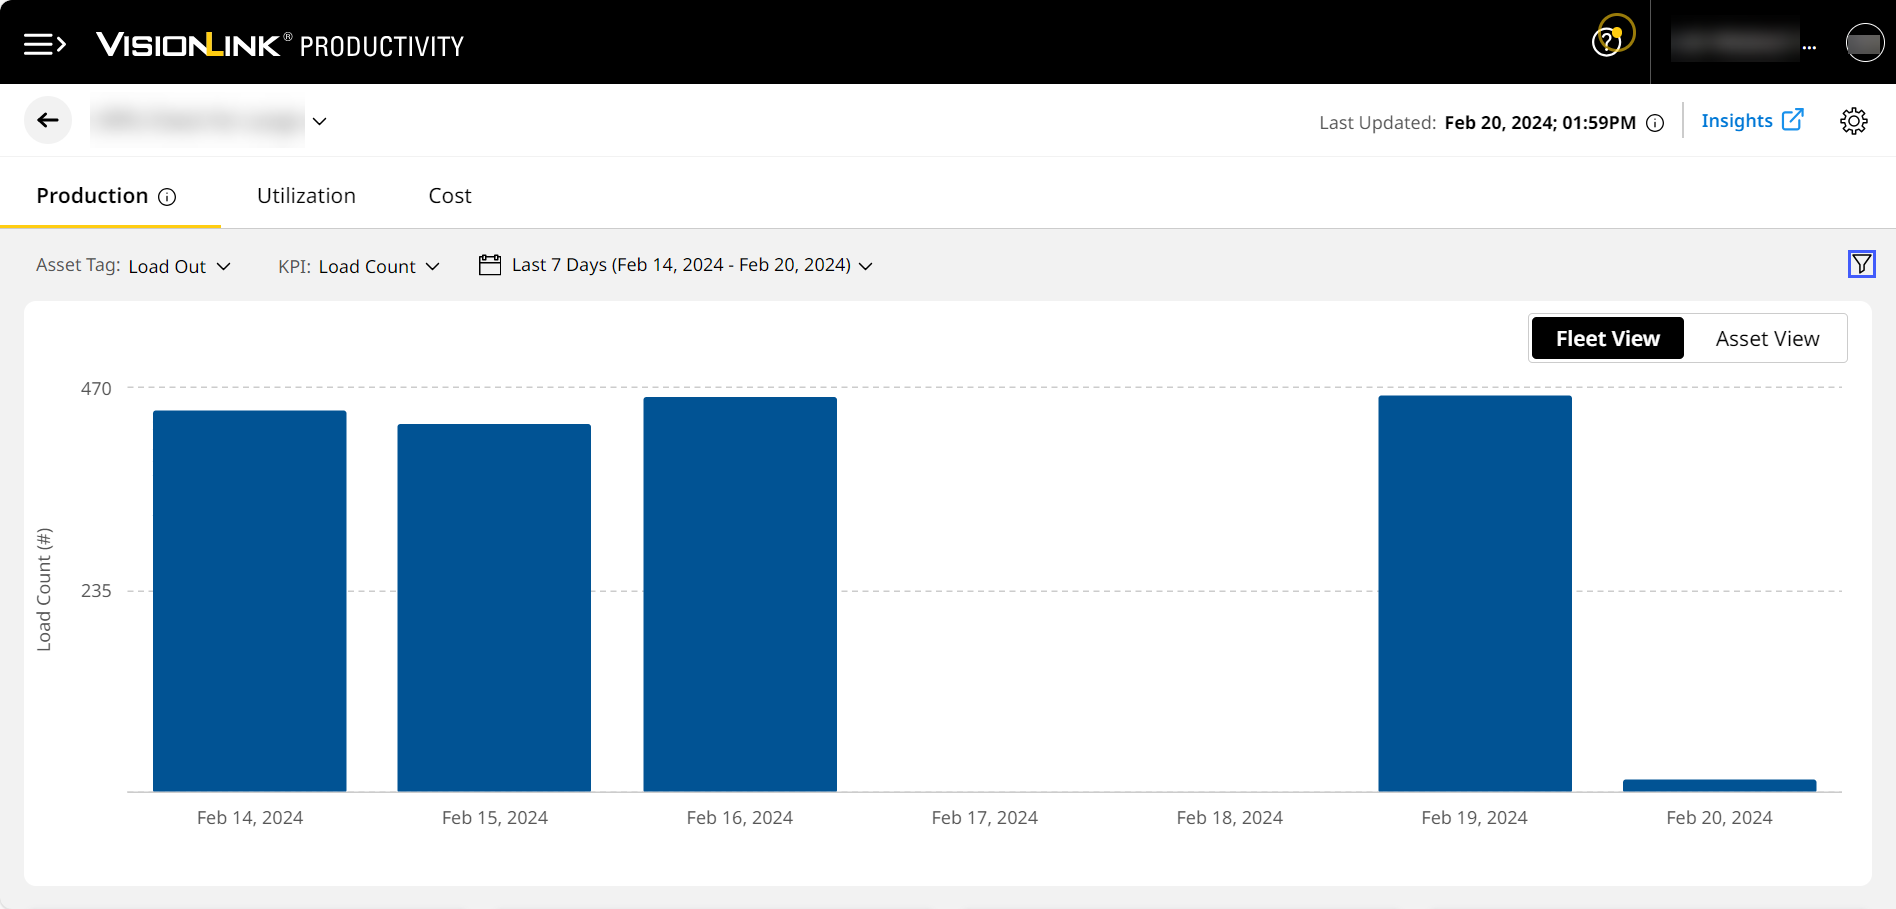
Navigate to the Site Summary tab of choice. Click Filters
 .
.
-
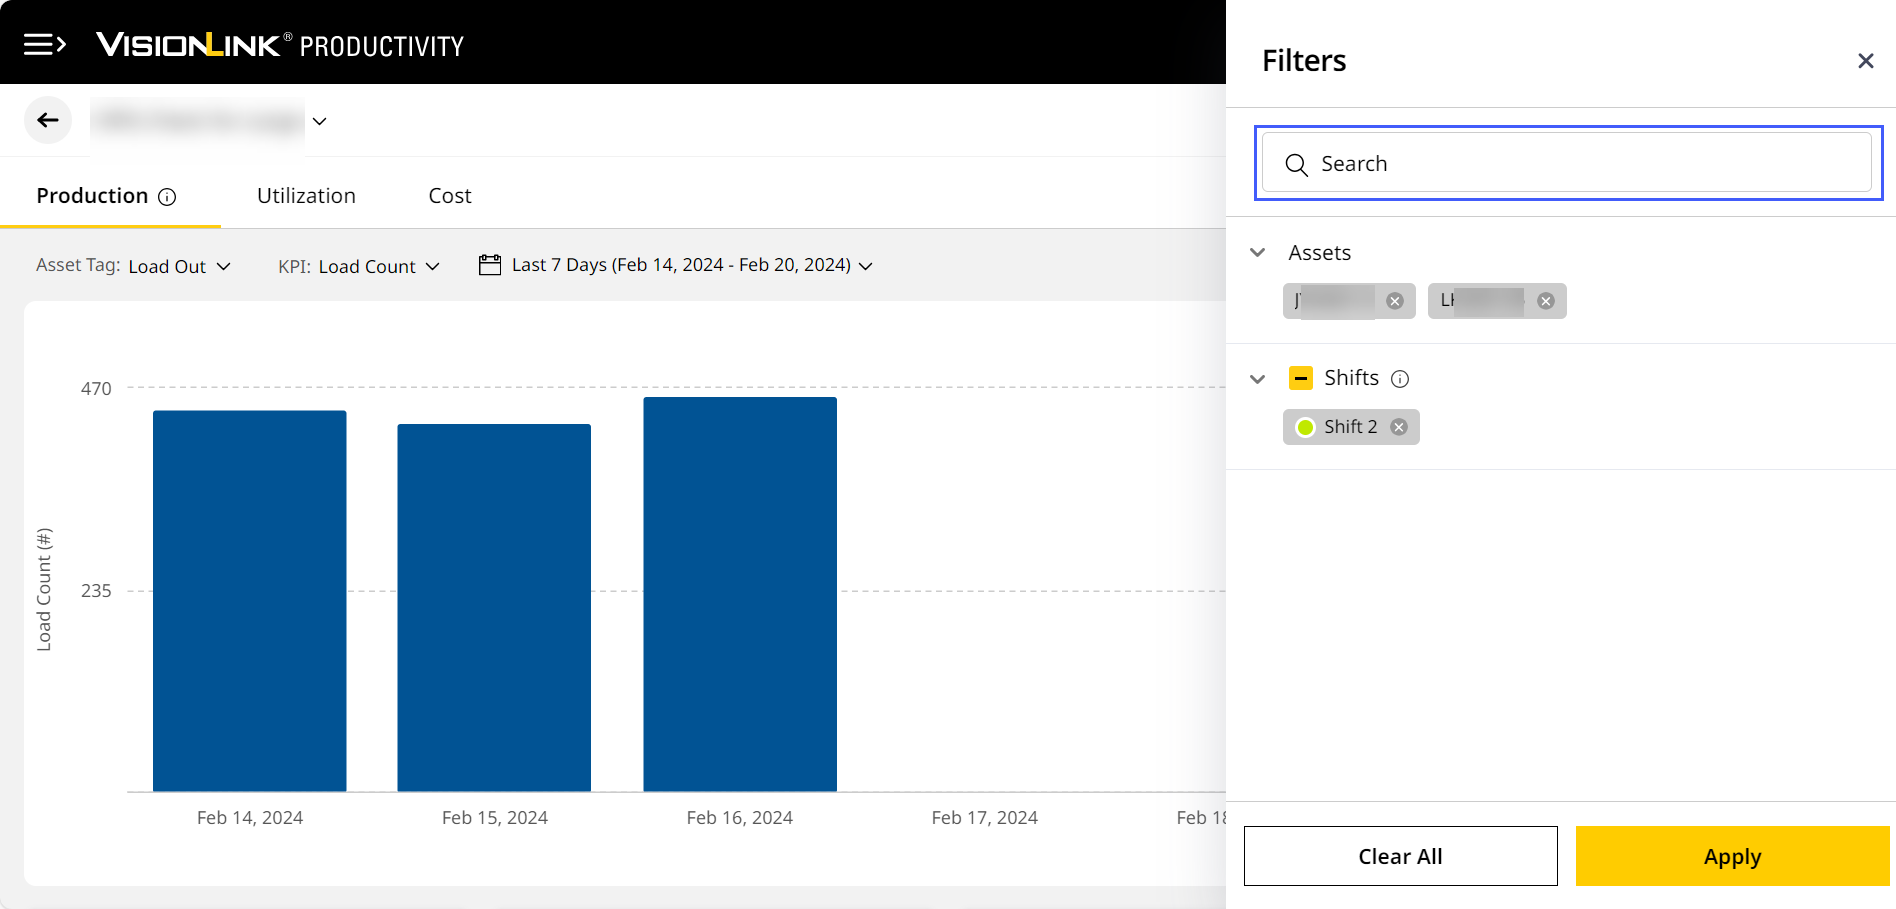
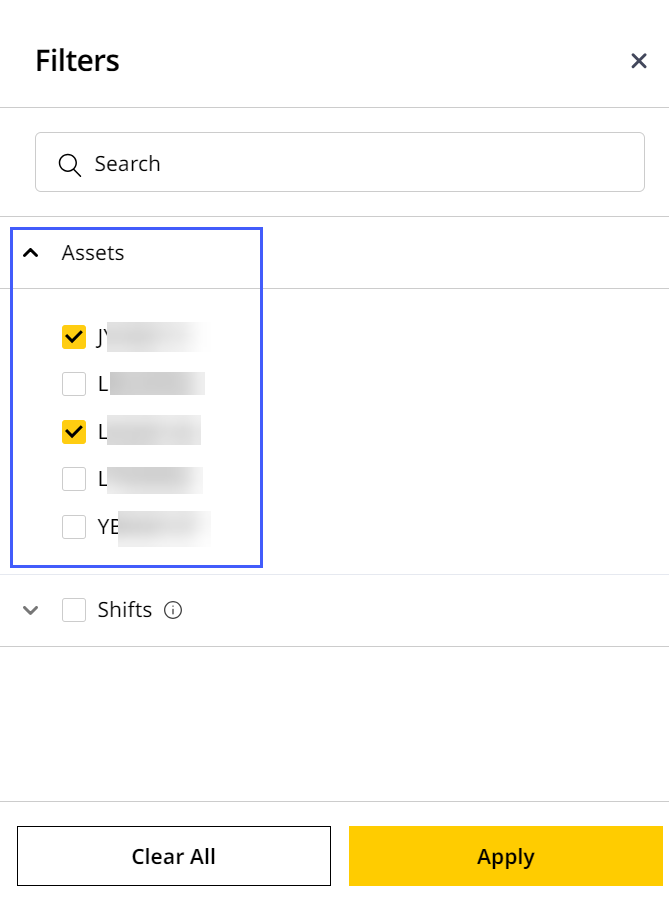
The filters available on Site Summary are:

Use search to quickly find and select a particular asset ID or shift number as a filter.
View ImageView Image
-
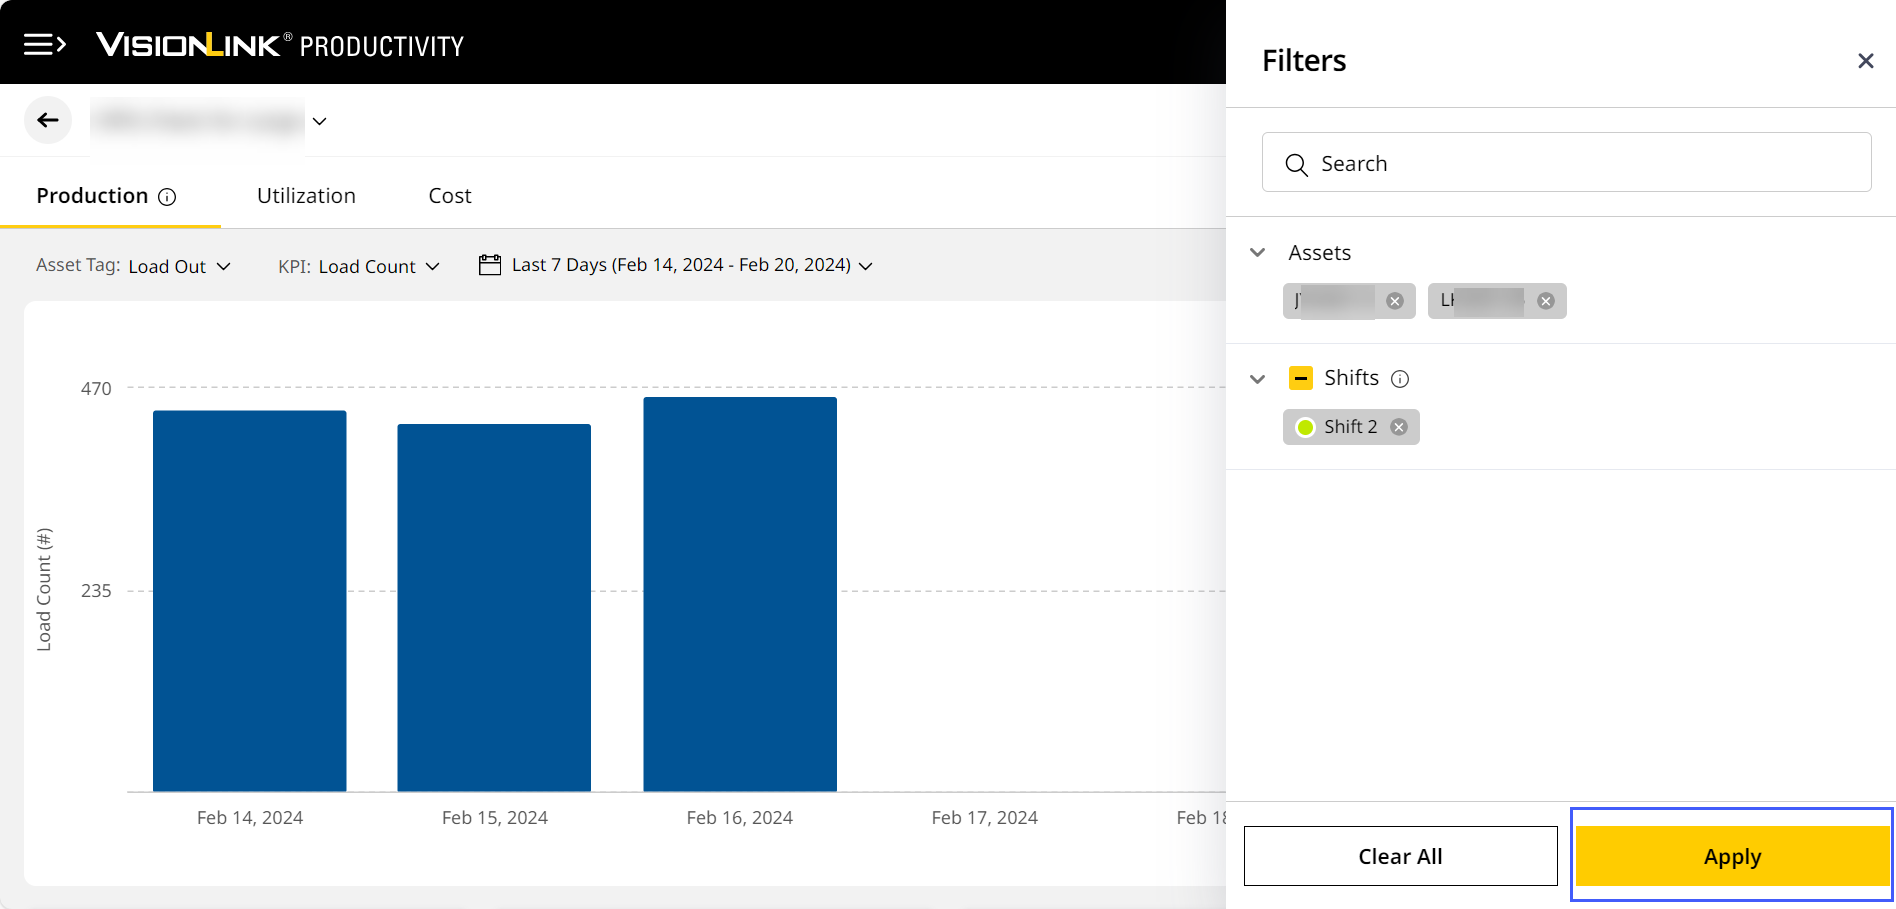
Assets: Filter Site Summary data by single or multiple asset IDs. Click Assets drop-down to reveal all asset IDs present in the site.
-
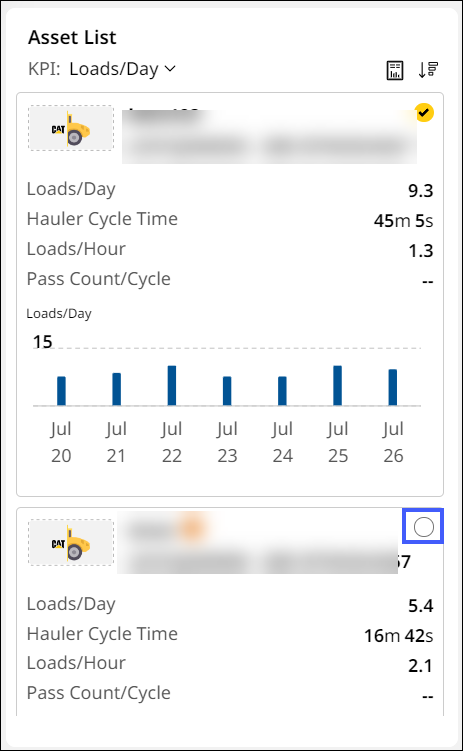
Alternatively, you can scroll down to the Asset List and click check
 in an asset card to directly select one or more assets.
 -
Assets selected either in Filters or Asset List will be indicated by checked
 in the particular asset card.
-
-
Shifts: Filter Site Summary data up to three shifts. Click Shifts drop-down to reveal all shifts (one to three) present in the site.
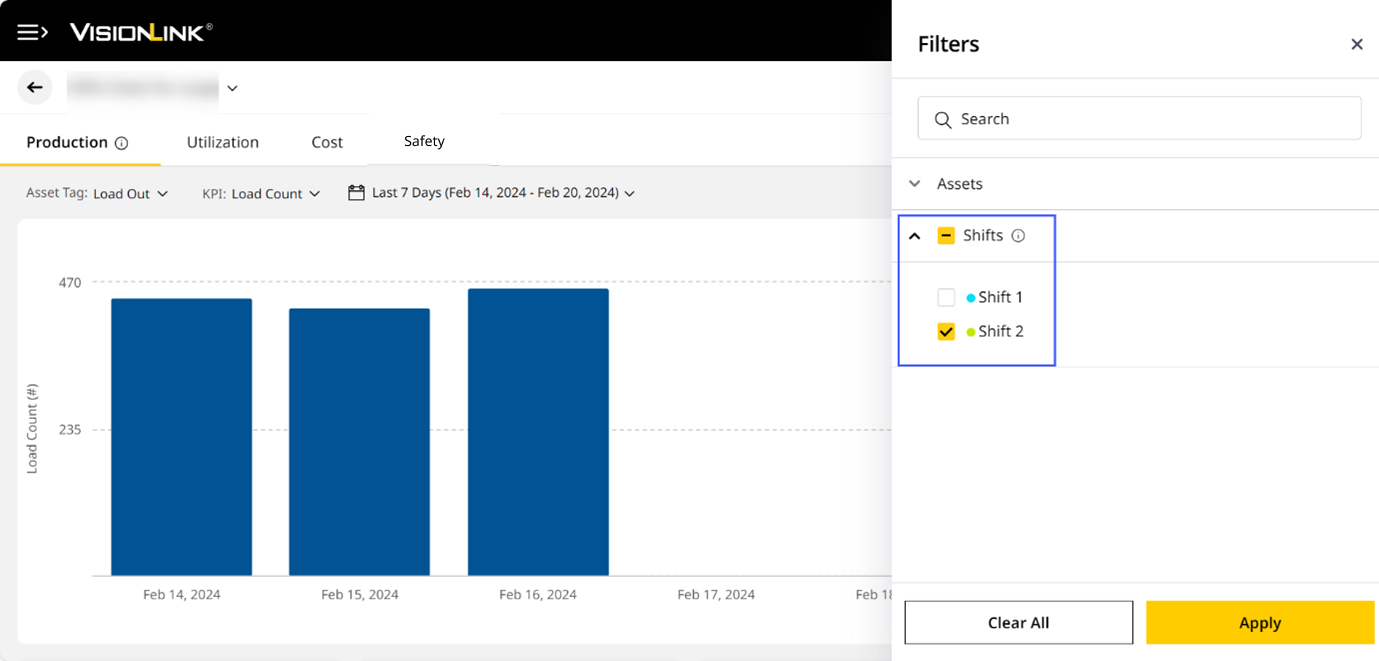

• You can select shifts only if chosen date range contains supporting shift data.
• Set up shifts in the Add Shifts step when creating or editing a site.
• Currently, you can only view filtered shift data for Load Count and Payload KPIs.
• On Production (Site), when filtered by shift, the Loads/Day KPI changes to Loads/Shift KPI in the KPI cards and asset cards.
° Loads/Shift KPI is available only for Hauler – Load & Haul and Loader – Load & Haul asset tags.
• If a single shift goes beyond 24 hours or extends to multiple days, only the start date of the shift will display granular data. For example, if a shift starts at 10 PM on May 26 and ends at 6 AM on May 27, then detailed data for only May 26 will be displayed.
• Time period for changes made in the shift to come in effect is as following:
° Changes in current shift will be effective from next week
° Changes in future shift will be effective from those specified days
° Changes in older shifts will be effective from next week.
• These changes will be reflected in Site Summary, Insights and Reports.
• On Safety (Site), you can filter by shift for Seat Belt and Detect KPIs.
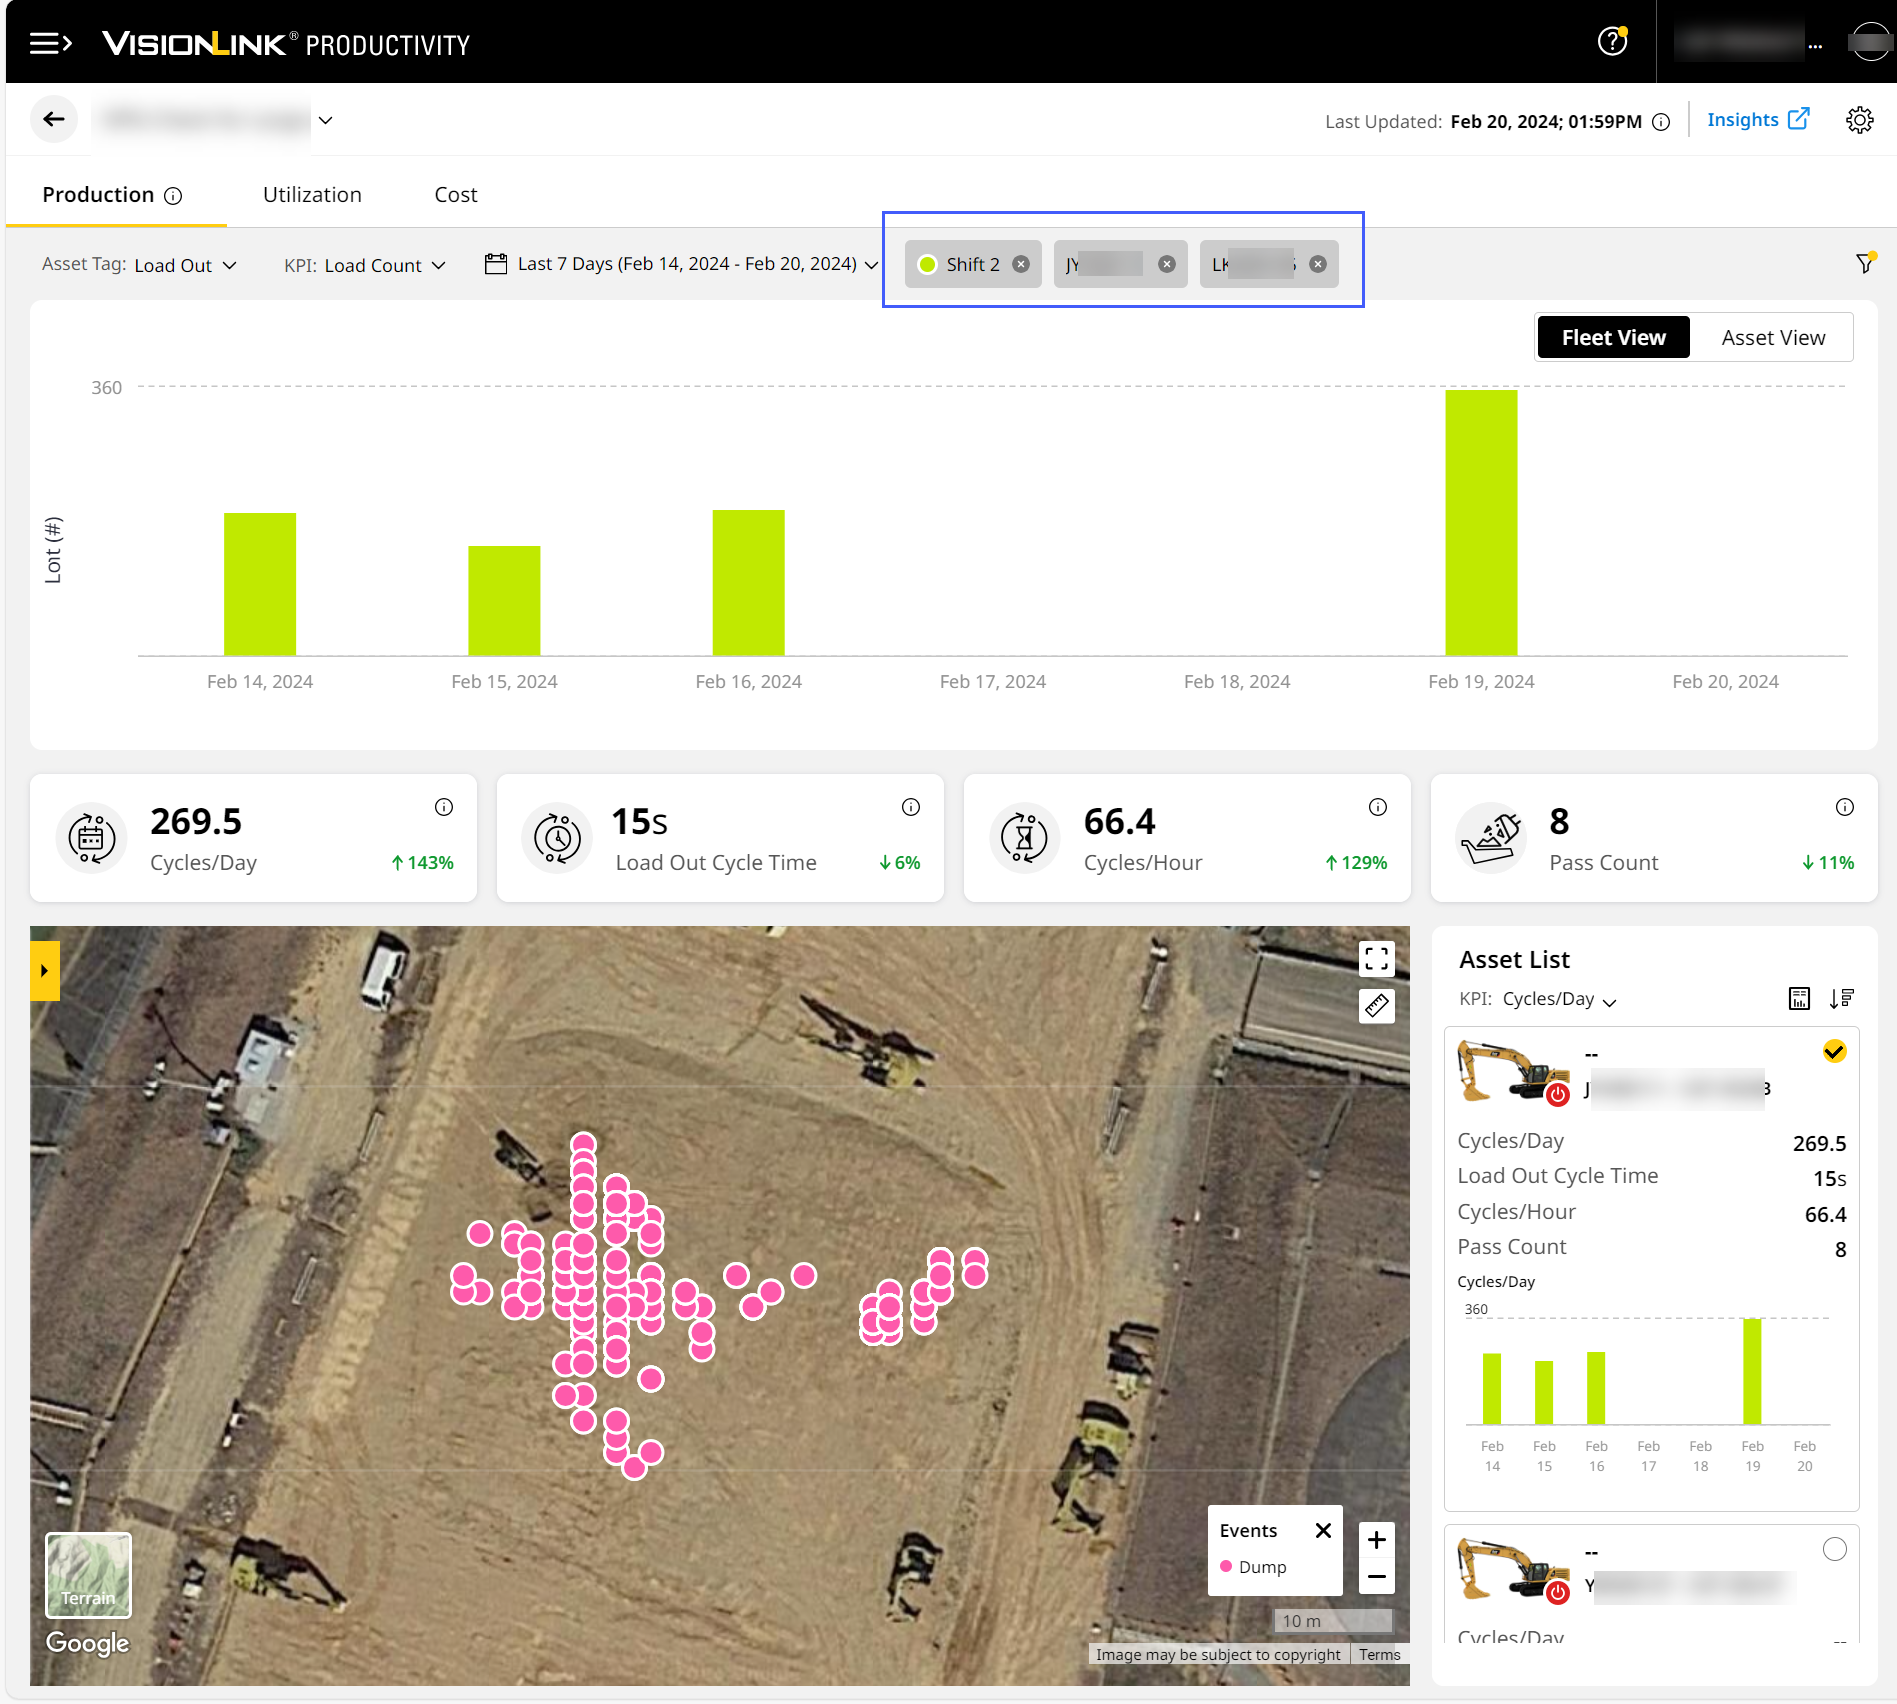
• If filtered shifts overlap, the chart graph will display data in stacked bars. Hover over any bar to get more details on events in the respective shift.
View ImageView Image

• The filter selections apply when navigating to Insights from the filtered Site Summary as well.
-
-
Click Apply.
-
Once you save the asset filters:
-
The Asset View, Fleet View, map view and the KPI cards, display the selected assets’ data.
-
The selected asset IDs appear above as chips next to date range selection.
-
-
To remove a filter, directly close the respective chip. Alternatively, deselect it in Filters or Asset List (only for asset filters).
Safety (Site) Filters
Filtered assets don’t transfer to or from Safety (Site). For example, selected filters in Production (Site) won’t be carried over to Safety (Site) and vice versa.
Narrow down the displayed assets by the following categories:
- Assets
- Shifts
- Detect Events
-
Total Mitigation
-
Total Motion Inhibit
-
Total Warning
-
-
Operator Response
-
Not Overridden: Displays non-overridden warning, motion inhibit and mitigation events.
-
Overridden: Displays all overridden detect events.
-
-
Detection Type
-
People: Displays the count of human obstructions detected around the asset.
-
Unclassified: Displays the count of any obstruction detected around the asset.
-
 Filters.png)
• Detection Type filter is unique to Safety (Site).
• To activate this filter, select Detect KPI.
Target Payload Overload Filters
For Target Payload Overload events, narrow the displayed data by the following criteria:
-
Assets
-
Target Payload Overload
View these events on Production (Site) > select Hauler - Load & Haul asset tag > select Payload KPI > switch to Asset View.

The selected filters are not carried forward to other tabs.
Grade and Compact Filters
This is only applicable for Filters on Production (Site).
If you select Asset Tag as Grade or Compact, the available filter options are a little different. These include the following:
-
Assets: Select from assets available on the site to filter corresponding data.
-
This will display as a chip next to the date range, along with the filtered asset count. Click delete
 to remove the selection on Asset List and Filters.

-
-
Available file categories (Survey Files and/or Design Files): Select from files available on the site to filter corresponding data.
-
This will vary based on what files are added to the site. To know how to upload a particular file or category, refer to Files.
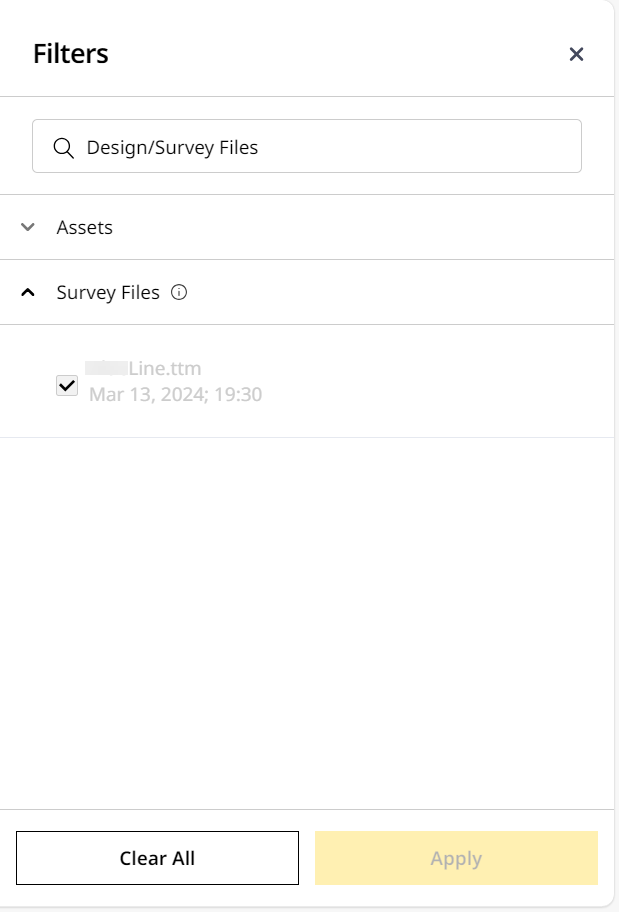
• The surface count display next to .xml files.
• Click the .xml file to display a drop down of all available surfaces.
◦ Select the preferred surface to review work remaining on map view.
View ImageView Image

• Only files with valid surfaces are used to calculate work remaining data.
◦ Files that have only valid linework are synced to assets but aren’t included here.
• If your site has only one survey or design file, then that will be applied as a filter by default.
• This filter cannot be removed. -