- + jobsite
- acceptable use policy
- account
- add user
- android
- answer
- april 2020
- archive
- asset tags
- assets
- assign schedule
- august 2020
- august 2021
- august 2022
- Average
- body up switch
- browser
- carbon footprint
- card error
- change KPI
- chrome
- CO2 emitted
- cookie
- copy site
- copyright
- cost kpi
- cost setup
- cost tab
- create
- currency
- custom list
- cut/fill
- dashboard
- december 2019
- december 2020
- december 2021
- delete site
- delete user
- digital offering
- dollar
- edit site
- edit targets
- edit user
- euro
- exemption
- FAQ
- favorite
- february 2020
- fill/dump
- filter
- firefox
- fleet
- frequently asked questions
- geofence
- getting started
- grid
- guide
- help
- ID
- insights reports
- introduction
- ios
- january 2020
- january 2021
- january 2022
- july 2020
- june 2022
- KPI
- KPI hierarchy
- landing page
- legal
- list
- list summary views
- load site
- login
- logout
- machine
- map tab
- march 2021
- march 2022
- material
- material list
- may 2020
- may 2021
- may 2022
- more option
- november 2021
- october 2020
- october 2021
- october 2022
- overview
- playback view
- policy
- preferences
- primary KPI
- production tab
- productivity
- productivity insights
- question
- remove site
- renminbi
- report management
- report type
- restore site
- review
- safari
- schedule
- select assets
- september 2020
- set name and location
- shift
- shift comparison report
- step 1
- step 2
- step 3
- step 4
- step 5
- stockpile
- summary tab
- support
- telematics
- total cost
- user
- visionlink
- walkthrough
- zones
Site Summary
When you click on any site card, you'll be taken to this page. The Site Summary enables you to further drill-down and view detailed information about the selected site.
These include graphical and cartographical representations of various metrics to better optimize your site.
Site Summary displays data based on the selections made in preferences and asset tags selected during site creation.
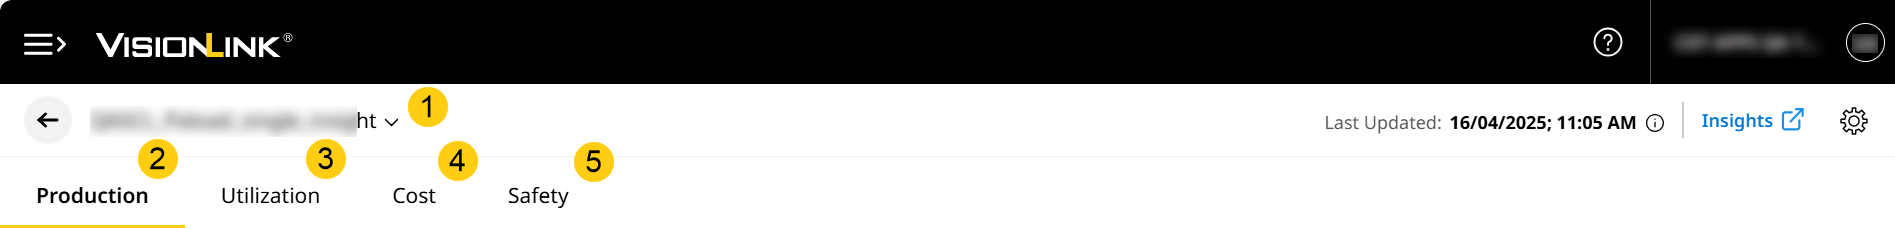
When you navigate here from a site card, you will land on Production by default. From there you can switch to Utilization or Cost to view different KPIs.
Some common elements across Site Summary are:
-
Site Name: Find out the site whose details you are viewing in detail.
Use the drop-down arrow to switch sites without navigating back to Sites Dashboard.
-
Production reports the efficiency of operations in a site.
-
Utilization enables you to view and analyze the usage of assets at site.
-
Cost helps you track and estimate your site's overall cost breakdowns.
The timestamp of when data was last modified can be found under Last Updated.
To know more about each tab and further features, click on their respective links above.
Related Topics