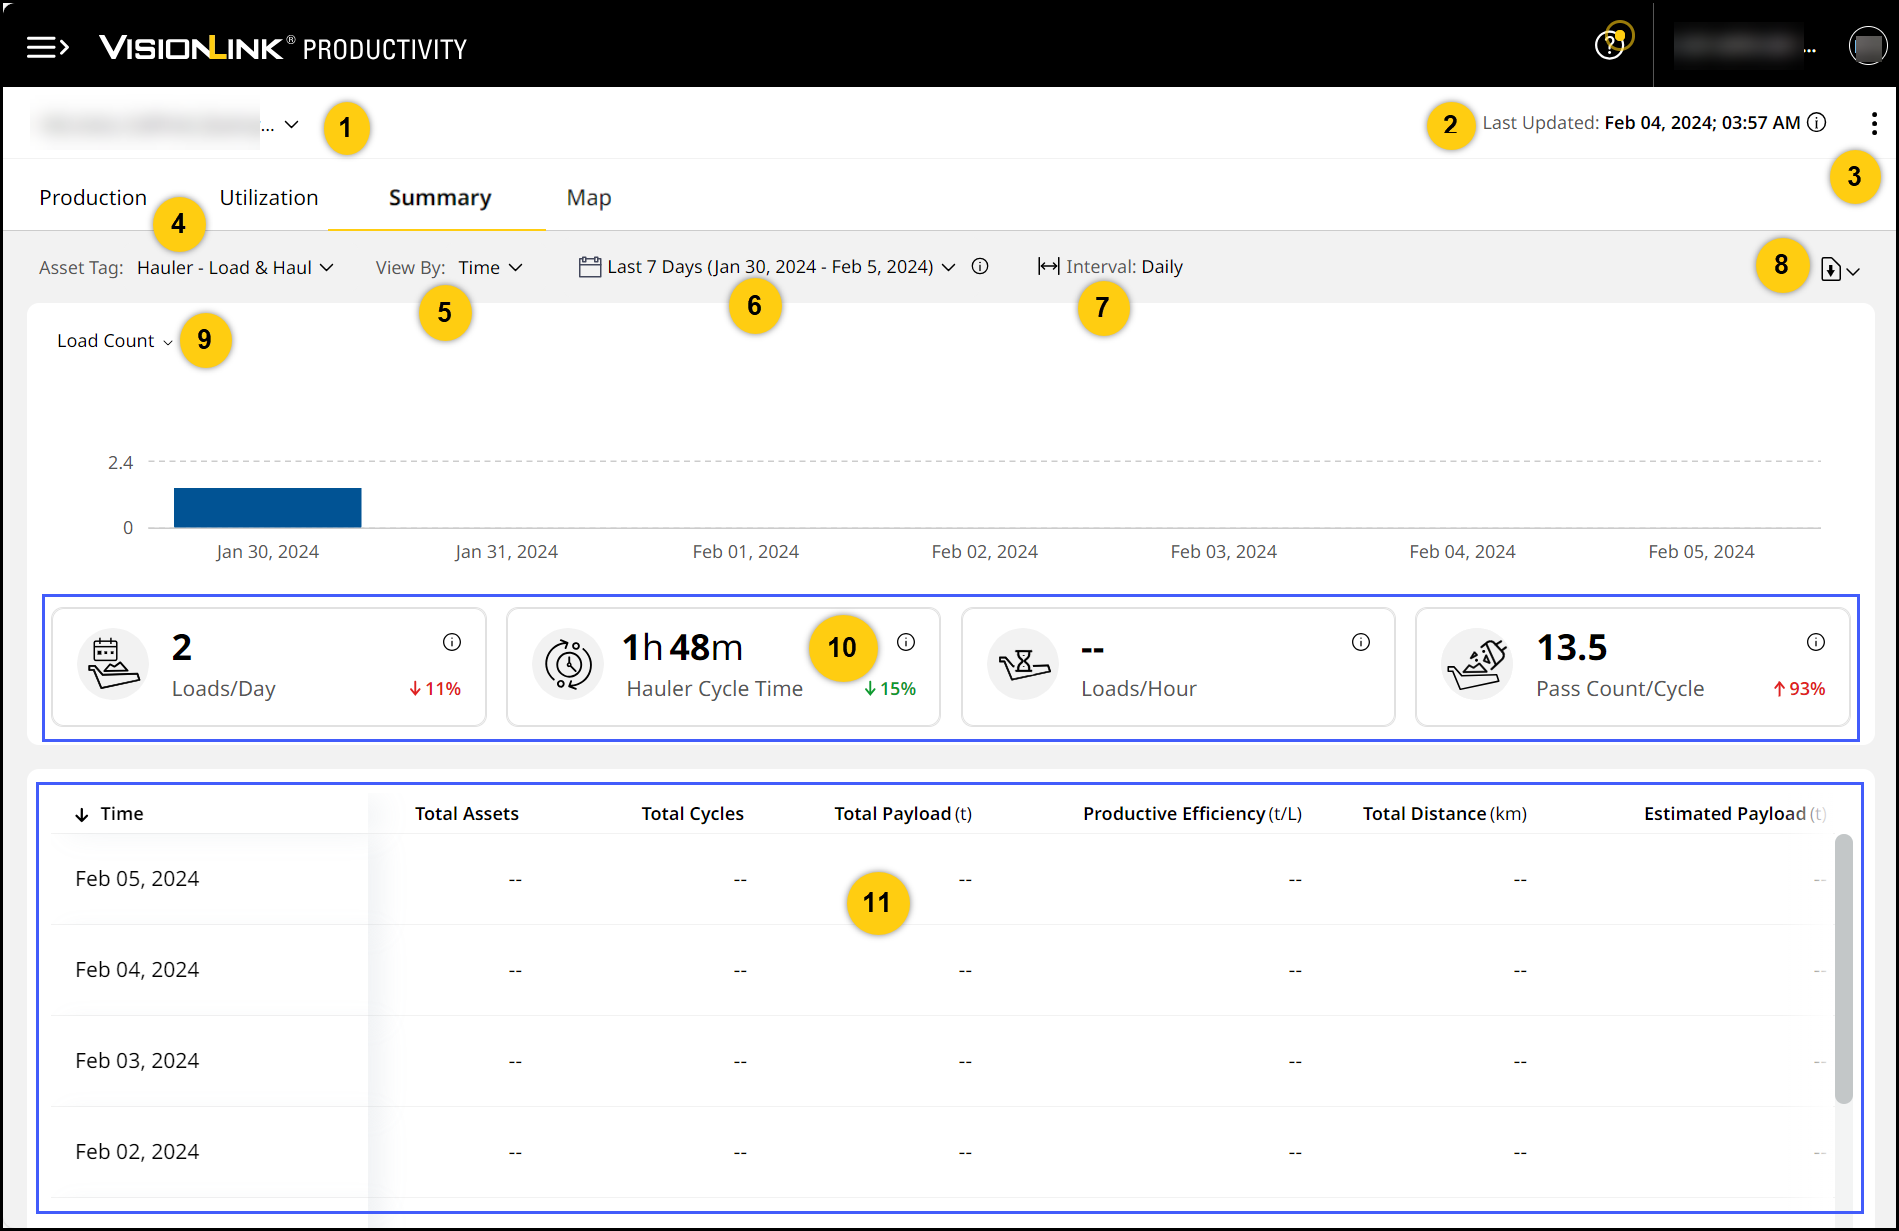
Summary (Insights) Tab
View production data for load count, payload and volume KPIs across a larger time period (up to 13 months).
With Summary (Insights), visualize asset performance summaries in both chart and tabular form. Track them by asset tag, KPIs, or date range.
-
You can change KPIs displayed using the Load Count, Payload and Volume options provided under KPI drop down.
-
The x-axis shows the target date, based on selected date range and y-axis shows the selected KPI.

• The x-axis shows the time in hours only when you select for a single day if the single day is in the last 13 months.
° If the date range selected goes beyond the last nine months, then the x-axis displays month-wise.
• Summary (Insights) only displays productive cycles-associated data.
• KPI values displayed here may differ from the rest of VisionLink Productivity. This difference occurs because Summary (Insights) utilizes weighted median to calculate data, which provides for more effective data aggregation.
° With weighted median. VisionLink Productivity processes segments data from hourly to daily. This allows for daily to weekly to monthly aggregation, leading to quicker loading of data for longer time periods.
-
Site Name: Displays the site name whose details you are viewing in detail.
Use the drop-down arrow to switch sites without navigating back to Sites Dashboard.
-
Last Updated: View the timestamp of the last reported data. Click info
 to view time zone (country/city) of the selected site.
 -
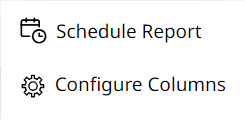
More Options: Click more options
 to perform the following:
 -
Schedule Report: Receive periodic (daily, weekly and monthly) updates on all your Summary (Insights) data as a .xlsx and .csx file.
-
Configure Columns: Customize the order and presence of columns within the summary table found further down.
-
-
Asset Tags: Sort the displayed chart, KPI card and tabular data by the following asset tags:
-
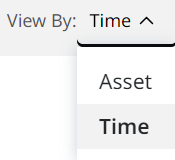
View By: View Summary (Insights) data by Asset or Time by selecting this option. This helps to compare and analyze corresponding KPIs on a day-to-day basis for all asset tags.
Things to keep in mind:
-
On selecting Asset, the data will be summarized based on the individual assets under the site.
-
On selecting Time, the data is summarized for each day in the selected date range.
This is the default view when you land on Summary (Insights).
-
For a single day, i.e., Today, Yesterday or a single Custom Date, this summarizes the data on an hourly basis.
-
For date ranges of more than a single day, this summarizes data on a daily basis.
-
For date ranges of more than a single day, this summarizes data on a daily, weekly or monthly basis.
-
-
The columns Asset or Time are configured based on whether you select to view data by asset or time respectively.
-
Depending on whether you select Asset or Time, the corresponding summary details table below will also change. It will either display asset-wise data or time-wise data respectively.
-
-
Date Range: Select the date range for which the production details for the selected asset tag are to be displayed.
• Unlike other Insights tabs, Summary (Insights) allows you to analyze and track data up to 13 months.
• The data granularity displayed on the chart, KPI card and table view will vary accordingly:
° If you select a single day (Today, Yesterday or a single Custom Range day), then data displays on an hourly basis.
° If you select a range from two days up to a month (31 days), then data displays on a daily basis.
° If you select a range from more than a month (32 days) up to three months, then data displays on a weekly basis. If the selected start and/or end dates are in the middle of the week, then the start week will end on Sunday and end week will begin on Sunday.
° If you select a range from more than three months (91 days) up to nine months, then data displays on a monthly basis.
• When you select a date range longer than a month (31 days), VisionLink Productivity displays it with the exact date range for easy reference.
View ImageView Image
• Data will be available for a total period of 13 months. Under Custom Range, however, you can only select up to nine months to view corresponding data. Caution: You can include the current month when sorting and viewing Summary (Insights) data. However, only data till the last six hours will be displayed and available for download.
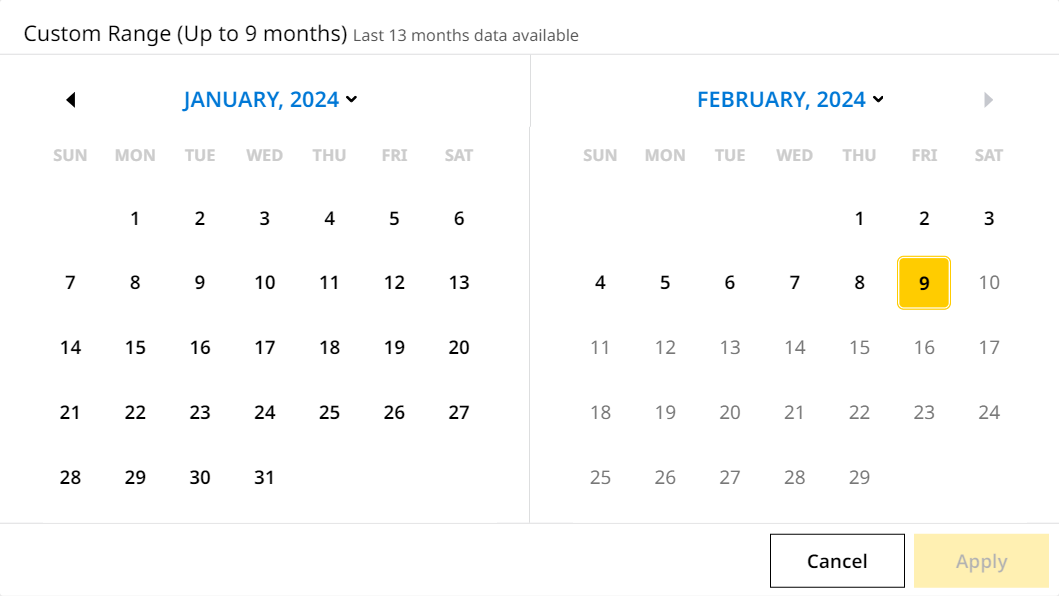
-
The available date range selections are Today, Yesterday, Last 7 Days (default selection) and Custom Range. For Custom Range, choose the required from and to dates from the calendar (up to 13 months).
-
The selection of start date should not be greater than the end date.
-
The available date range is based on your local browser time zone and not that of individual sites.
-
The one day into the future of your local time zone can be selected if said date is available in a different time zone. View site data for a time zone ahead of yours consistently.
-
-
Interval: This displays only when View By is set as Time. Depending on the date range option selected, Summary (Insights) data will show in the following intervals:
-
Hourly: When you choose Today, Yesterday, or a single day under Custom Range.
-
Daily: When you choose Last 7 Days, or any date series under Custom Range that goes up to a month (31 days).
-
Weekly: When you choose any date series under Custom Range that goes from a month (31 days) to three months.
-
Monthly: When you choose any date series under Custom Range that goes from three to nine months.

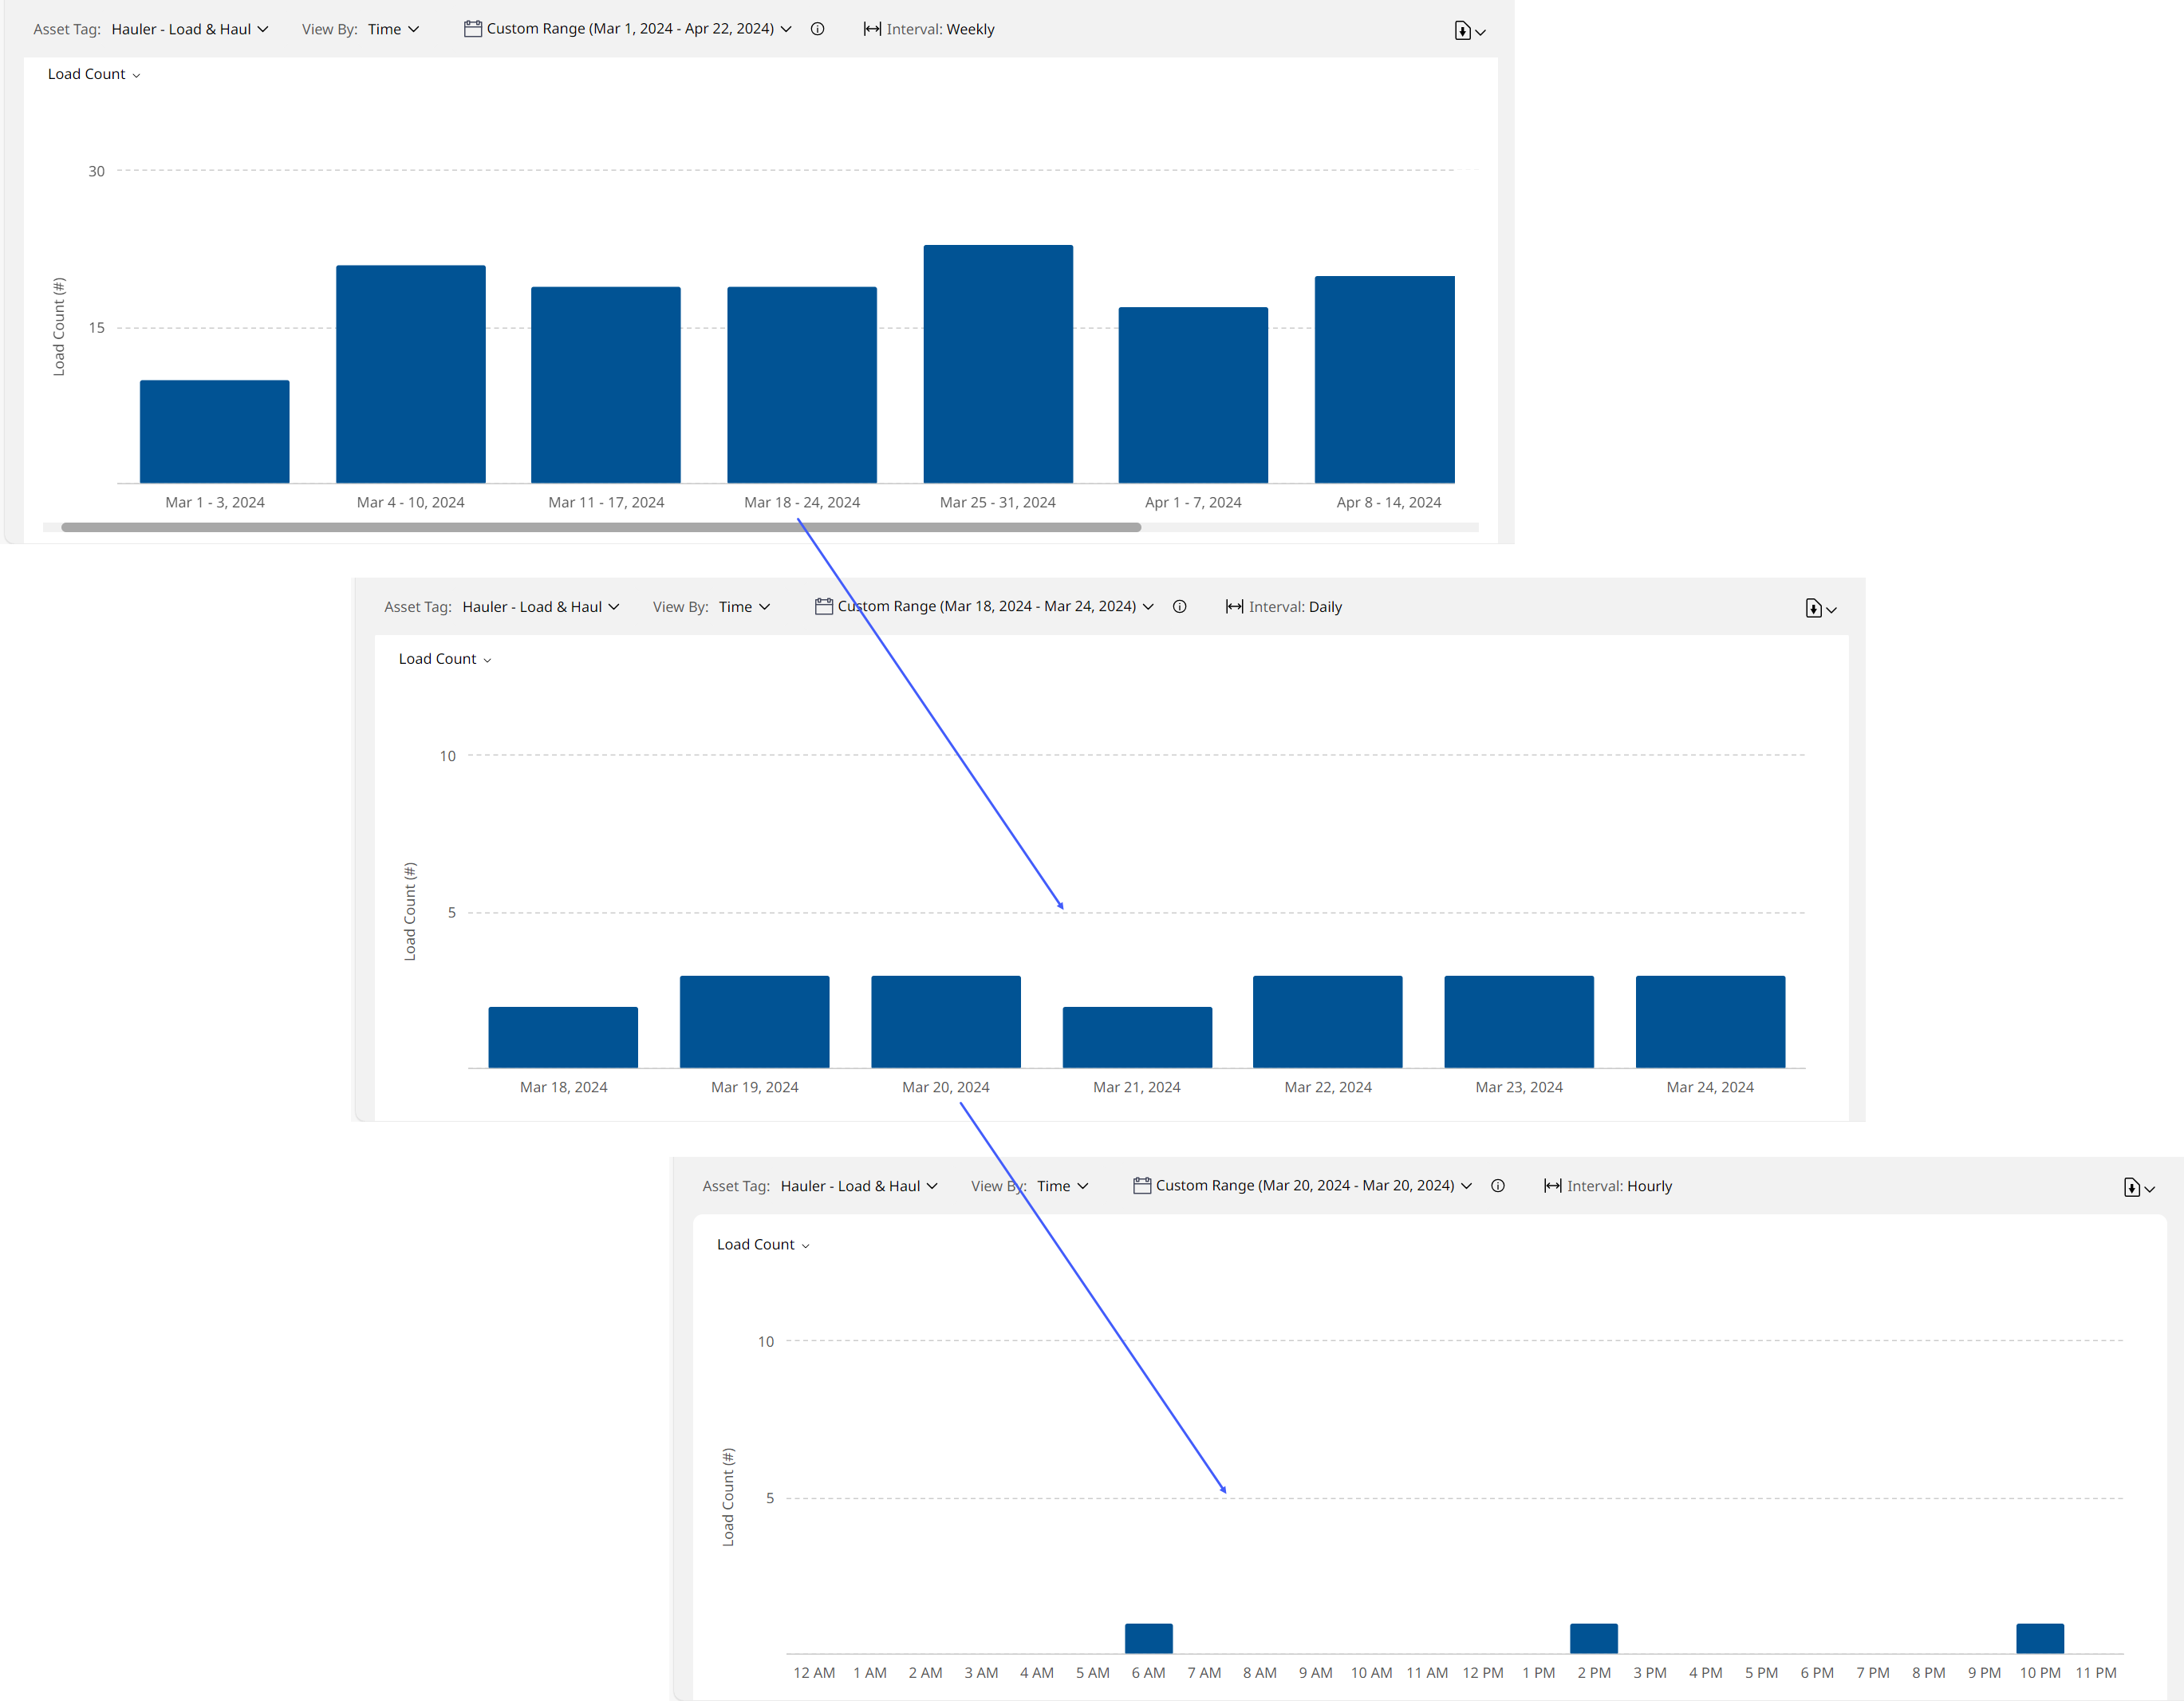
If you select Weekly or Monthly interval, click the bar graph to drill-down on a daily and then hourly basis.
View ImageView Image
-
-
Download
 : Use download
  to save Summary (Insights) data in the form of reports.
The reports present data sorted by your selection options (Asset Tag, KPI, View By and/or date range) in the following two types:
-
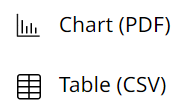
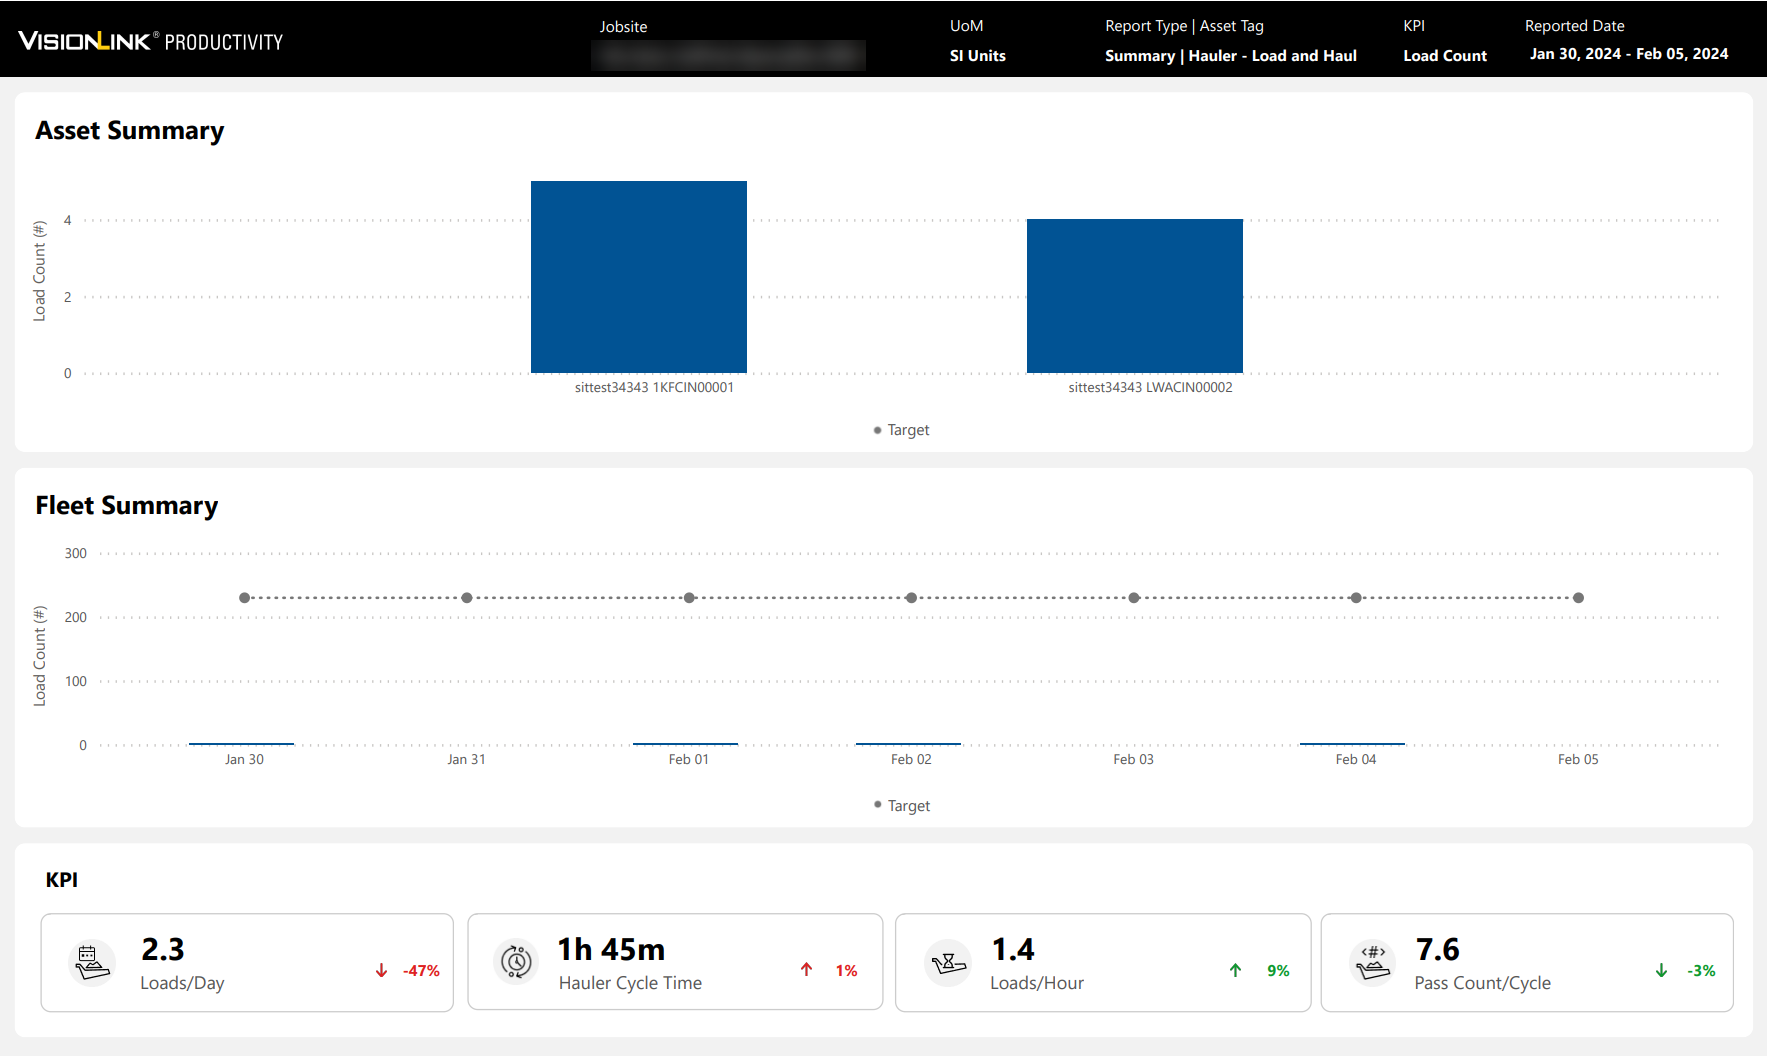
Chart (PDF): Download summary report as a .pdf file. This report type preserves the chart, tabular and KPI card information as seen on the application.
-
Load Count
-
Payload
-
Volume
-
-
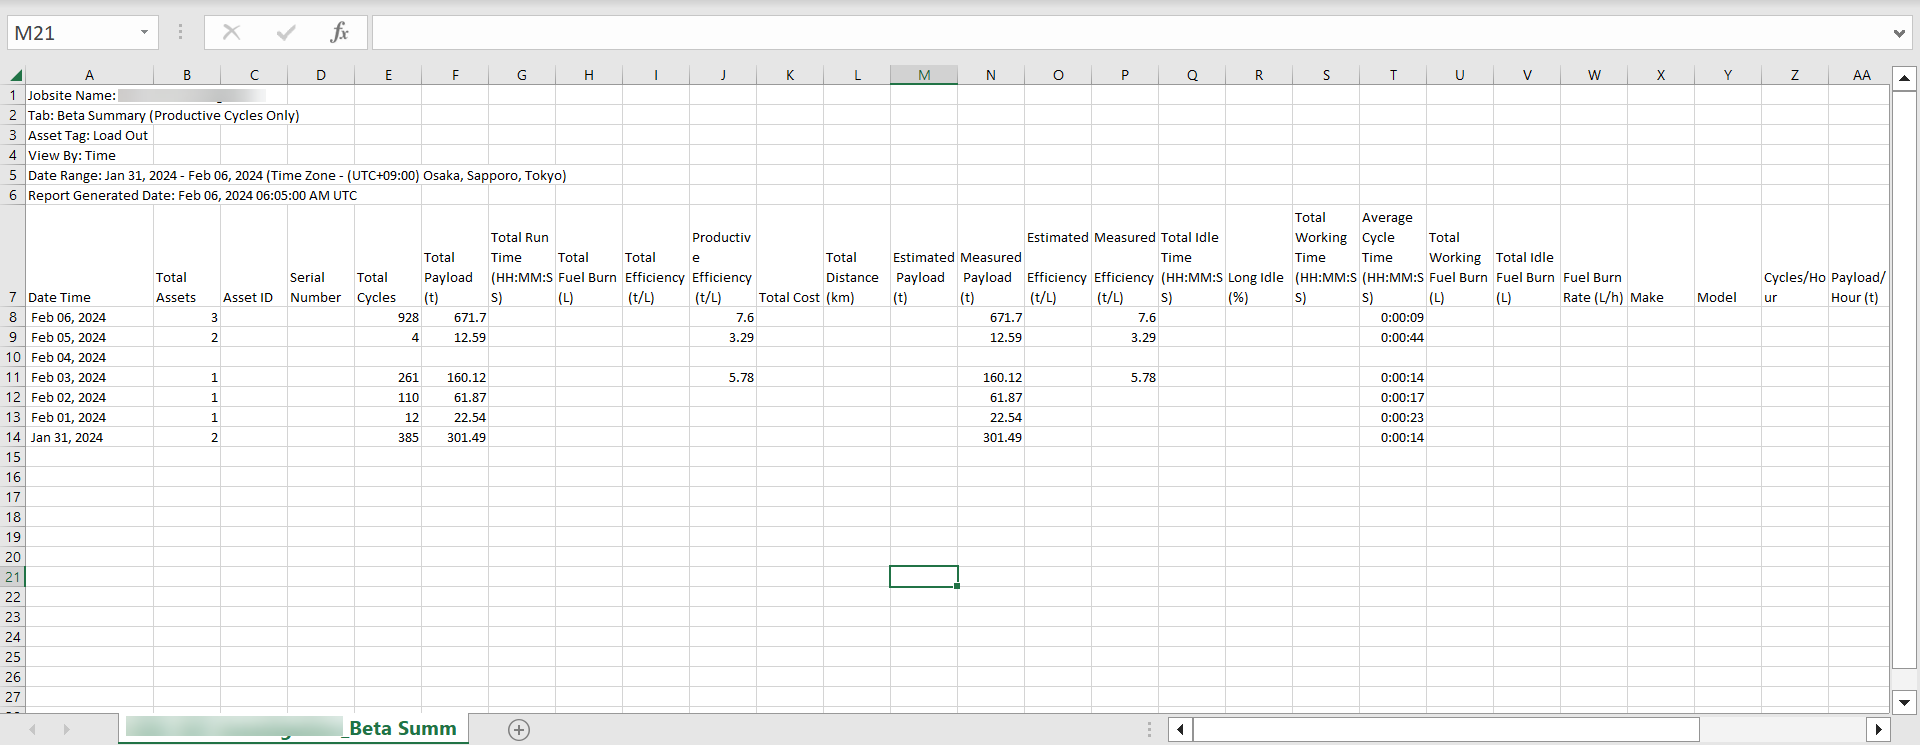
Table (CSV): Download summary report as a .csv file. This report type helps in further analysis and data processing.
-
-
KPI: Select a KPI to view the data in chart and/or tabular form. Summary (Insights) displays the following KPIs:
-
Load Count: Number of cycles moved by the assets.
-
Payload: Total weight of materials measured by the assets.
-
Volume: Volume of material moved by the assets.
-
-
KPI Cards: Displays KPI values based on the selected asset tag and KPI type below the Summary (Insights) chart.
The following production KPIs are available for each asset tag:
Asset Tag KPI
KPI Card Hauler – Load & Haul Load Count Loads/Day Hauler Cycle Time Loads/Hour Pass Count/Cycle Payload Hourly Production Hauler Cycle Time Payload/Cycle Total Payload Volume
Hourly Production Hauler Cycle Time Volume/Day Total Volume Loader – Load & Haul Load Count Loads/Day Hauler Load Time Loads/Hour Loader Cycle Time Payload Hourly Production Loader Cycle Time Payload/Cycle Total Payload Load Out Load Count Cycles/Load Load Out Cycle Time Cycles/Hour Pass Count Payload Hourly Production Load Out Cycle Time Payload/Cycle Total Payload Scraper Load Count Loads/Day Scraper Cycle Time Loads/Hour Scraper Load Time Payload Hourly Production Scraper Cycle Time Payload/Cycle Total Payload Volume Hourly Production Scraper Cycle Time Volume/Day Total Volume -
KPI Name: Identifies a KPI and its meaning.
-
KPI Value: Displays numerical values calculated based on selected asset tag and date range.
-
KPI Icon: Provides a visual representation of the KPI.
-
%+/%-: Shows either of the following:
-
Percentage increase
 (positive) or
  (negative) in comparison to the previous period.
 -
Percentage decrease
 (positive) or
  (negative) in comparison to the previous period.
-
-
Info
: Provides further information on calculation methodology and a link to know more, if required.
-
-
Details: Provides a tabular representation of the following Summary (Insights) metrics (represented as columns):
-
Time (If View By is set to Time)
-
The Interval selected will display here as well. Example: Weekly, Daily, etc.
-
-
Asset (If View By is set to Asset)
-
Total Assets
Some of the site's assets may not support or report utilization data. If so, those assets won't be included in the Total Assets count. -
Total Cycles
-
Total Payload
-
Total Run Time
-
Total Fuel Burn
-
Total Efficiency
-
Productive Efficiency
-
Total Distance
-
Target Payload
The following are not visible by default; you can enable them under Configure Columns:
-
Make
-
Model
-
Measured Payload
-
Total Estimated Payload
-
Estimated Volume/Cycle
-
Estimated Efficiency
-
Measured Efficiency
-
Average Pass Count
-
Average Cycle Time
-
Payload/Cycle
-
Total Idle Time
-
Long Idle
-
Total Working Time
-
Total Working Fuel Burn
-
Total Idle Fuel Burn
-
Fuel Burn Rate
-
Cycles/Hour
-
Payload/Hour
-