List Summary View Options
On selecting Asset View to view data on Production (Site) you can further choose from different list summary views, based on chosen asset tags.
Obtain, track, and measure data for the following list types:
Not all KPI and asset tag combinations offer all additional lists.
Download and share this list-wise asset view data using download ![]() .
.
Learn more about what each list type offers:
-
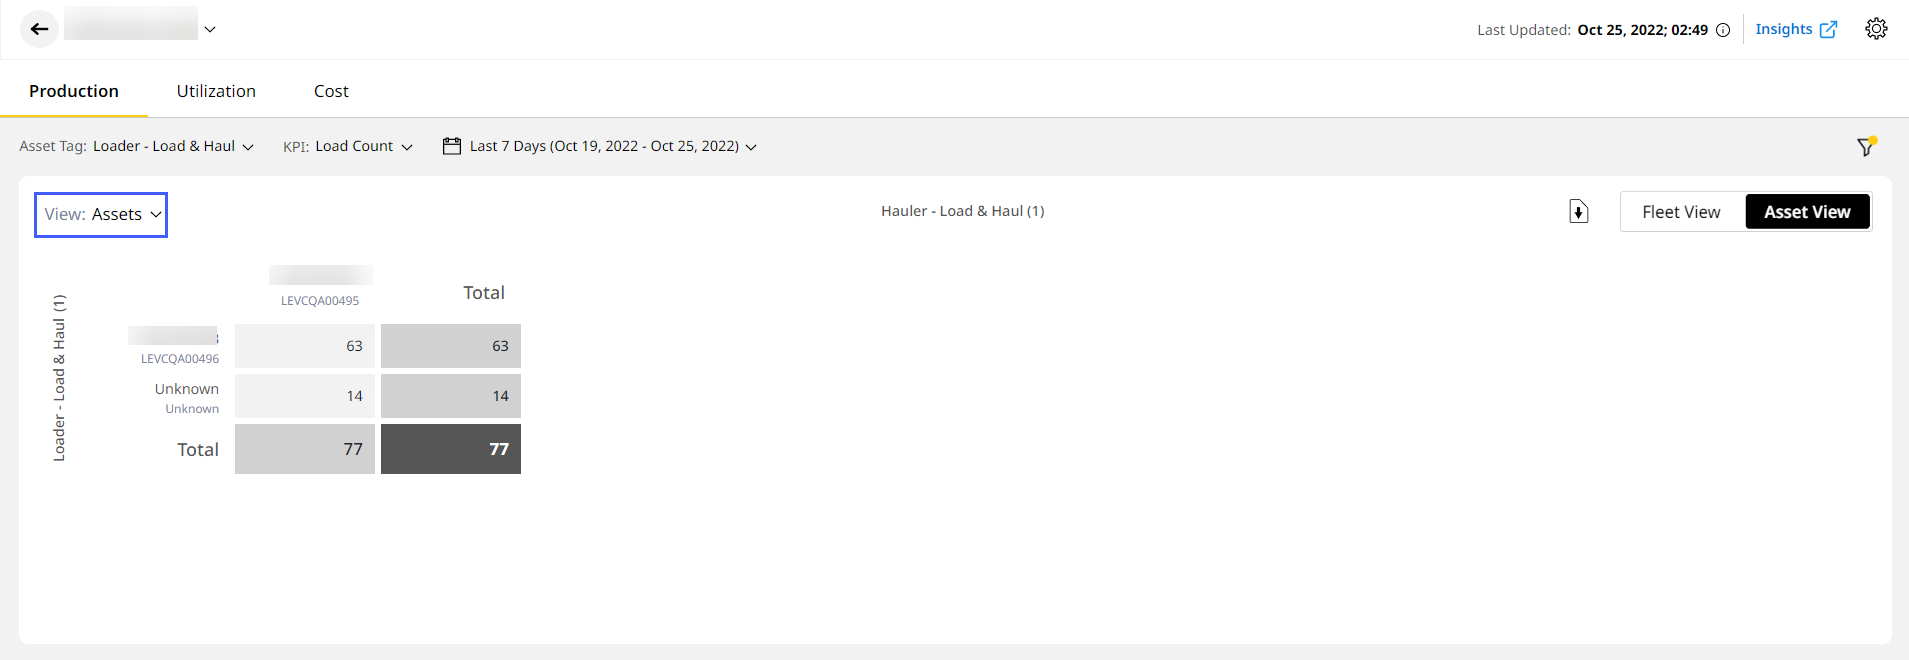
Assets: Displays KPI values between the loading asset to the dumping asset.
Available for all asset tags.
-
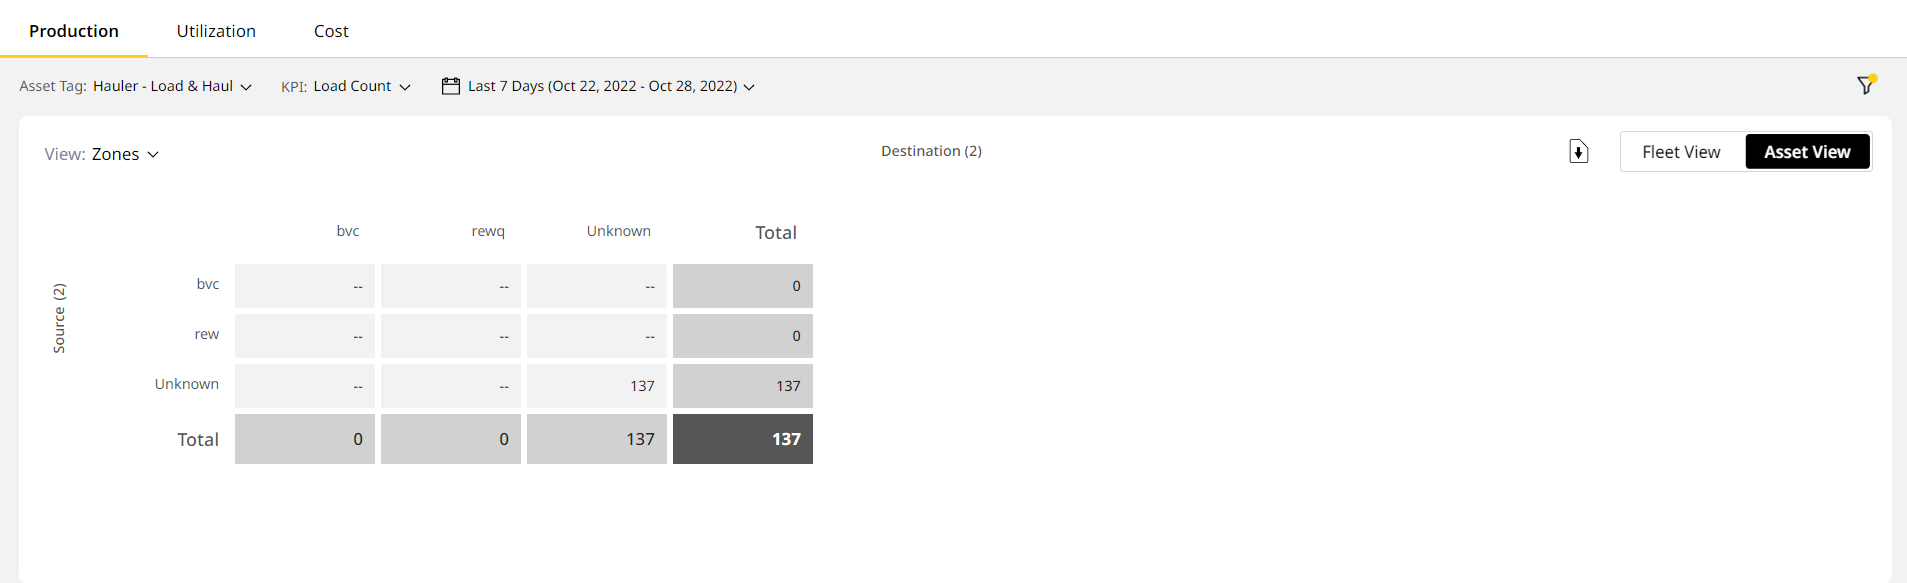
Zones: Displays KPI values between the source zone to the destination zone.
Available for Hauler – Load & Haul, Load Out and Scraper asset tags.
-
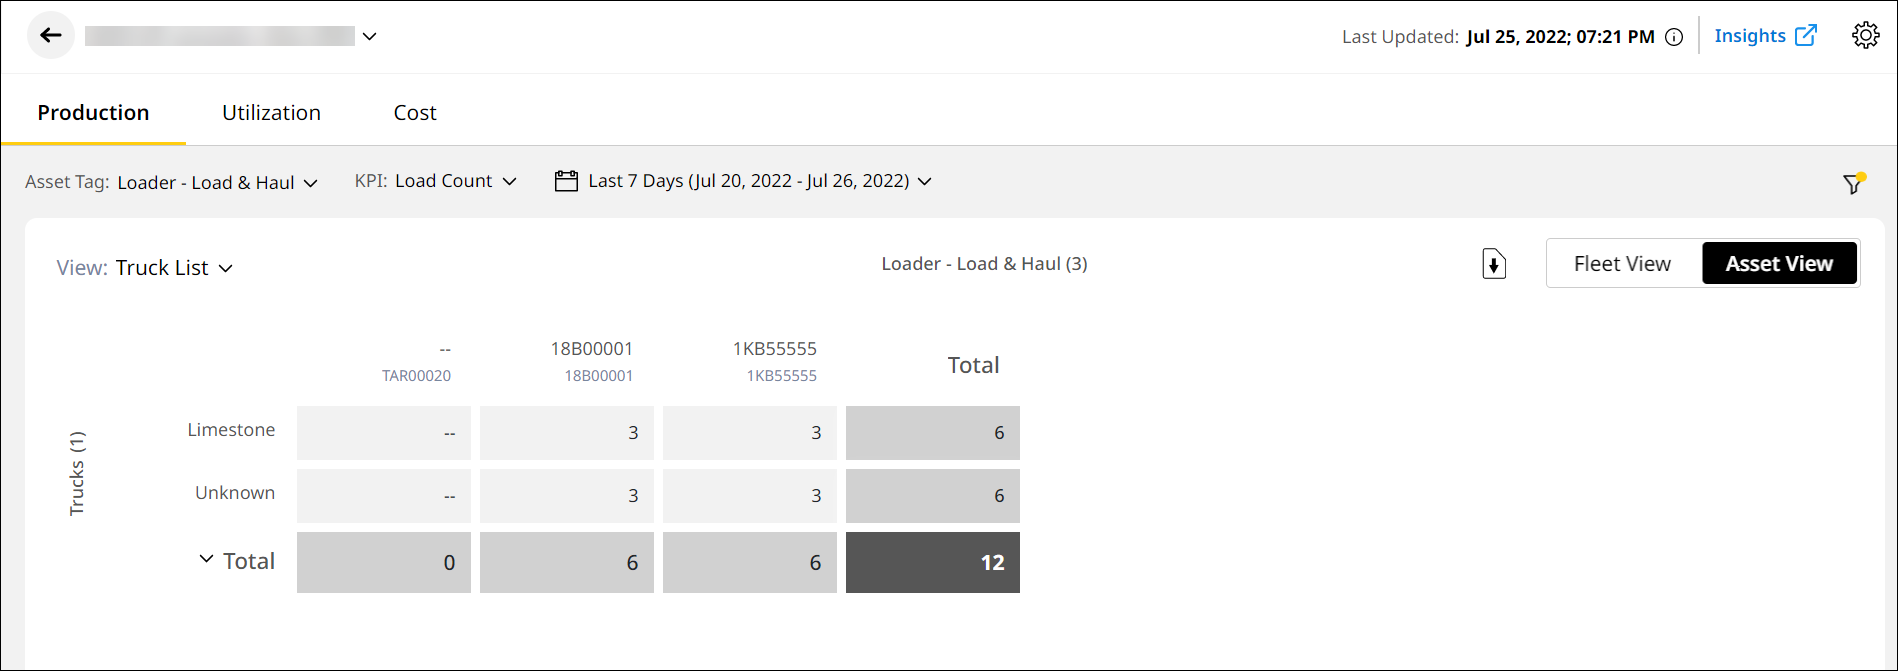
Truck List: Displays truck-wise KPI values based on selected assets.
Available for Loader – Load & Haul and Load Out asset tags.
Click the arrow beside Total to view an optional Truck Count row.
-
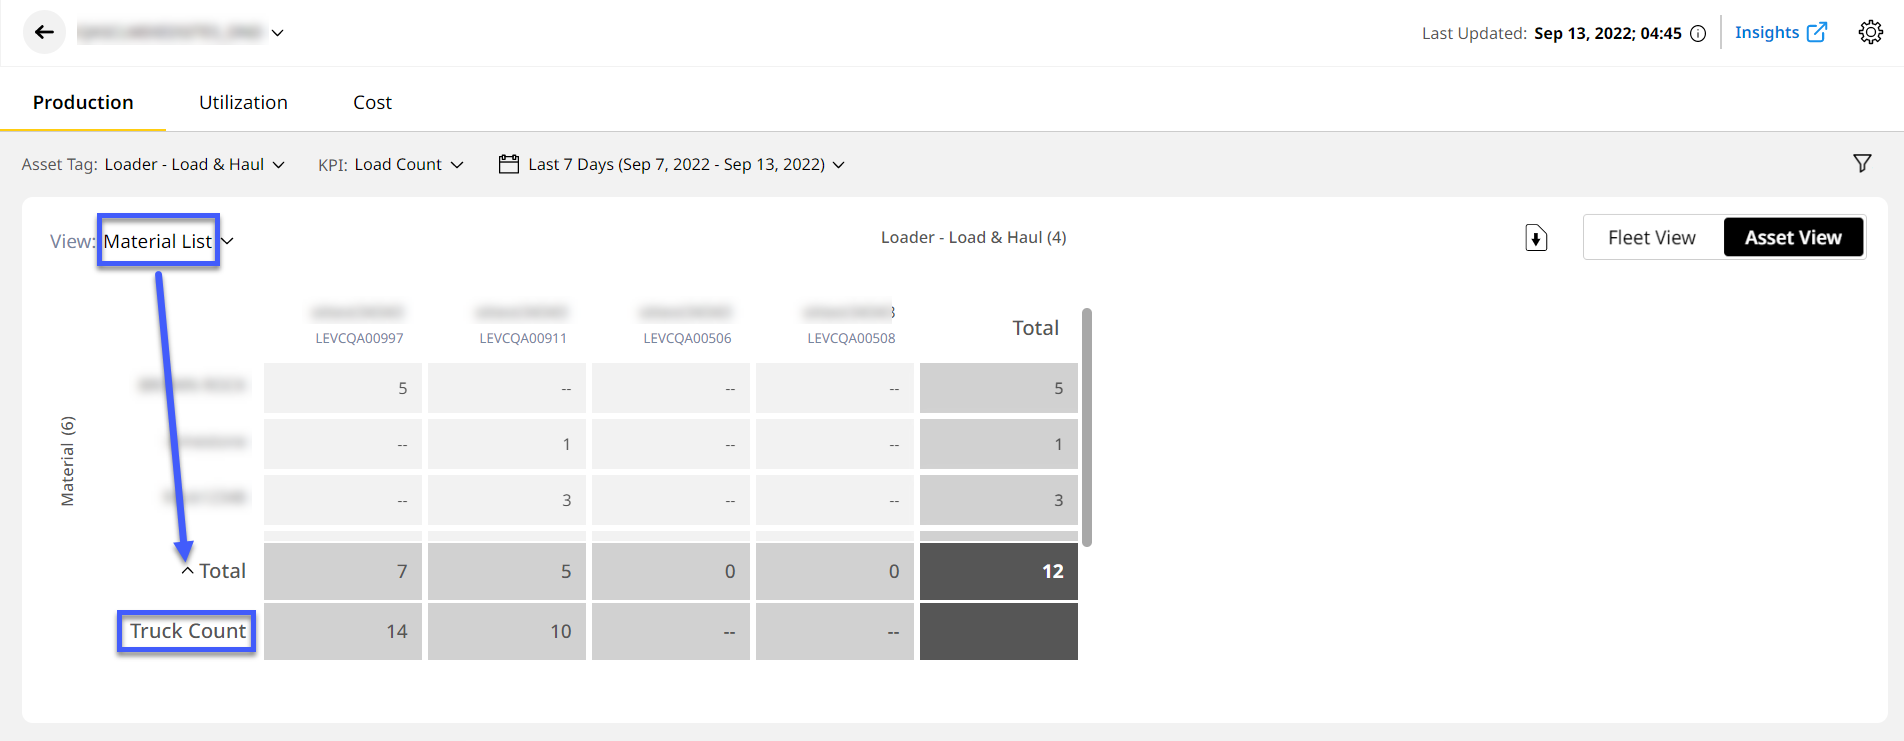
Material List: Displays material-wise KPI values based on selected assets.
Available for Hauler – Load & Haul, Loader – Load & Haul and Load Out asset tags.
Click the arrow beside Total to view an optional Truck Count row.
-
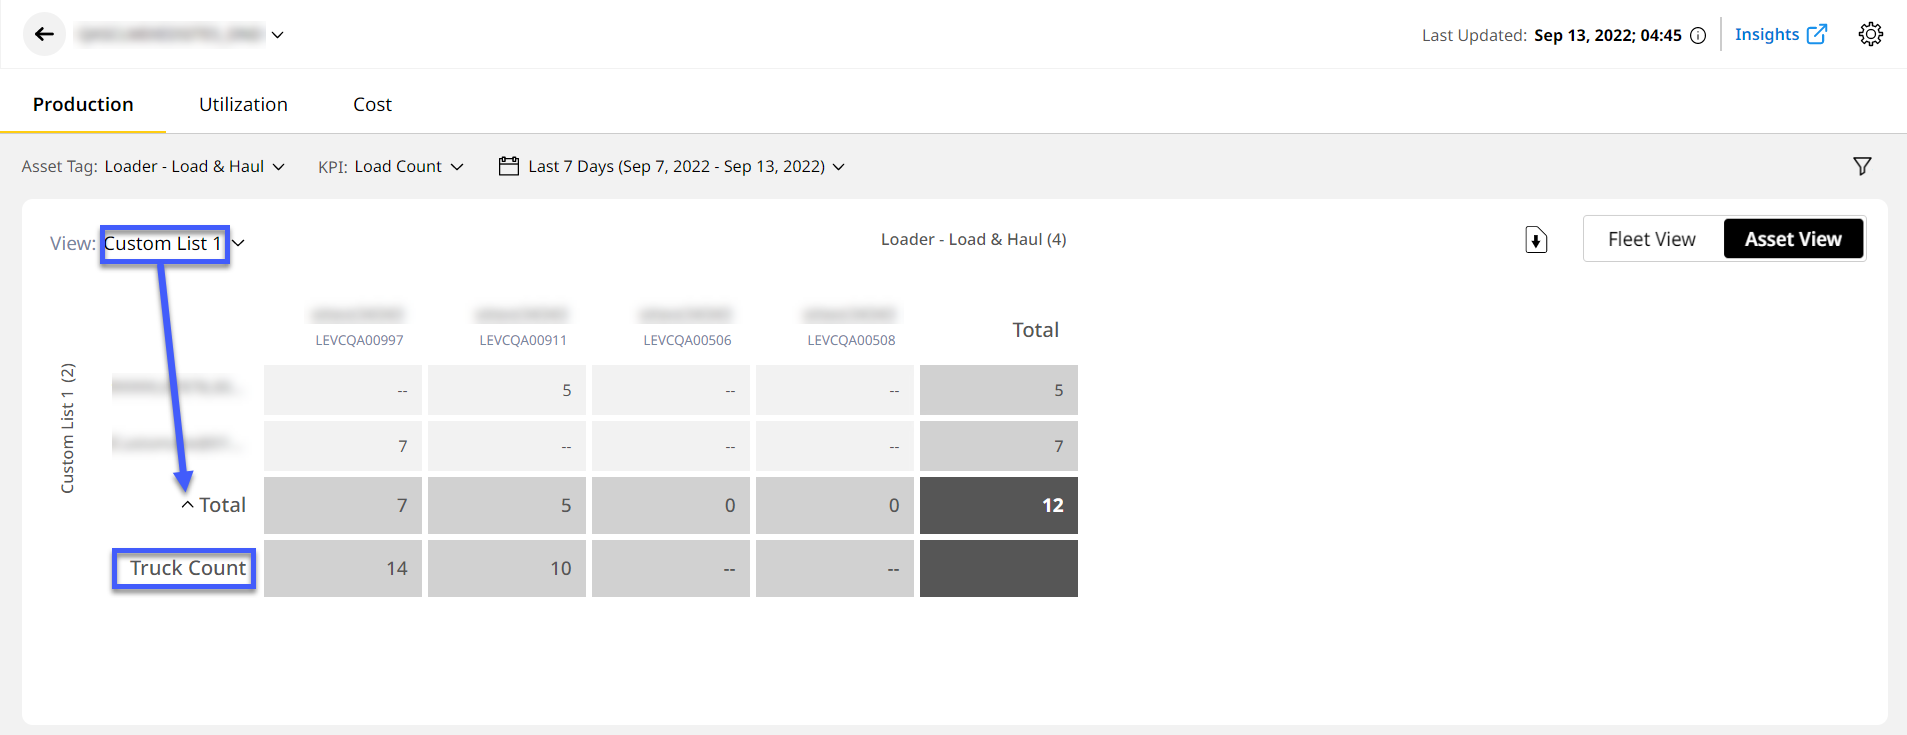
Custom List: Displays custom lists supported by the selected asset tags.
Available for Hauler – Load & Haul, Loader – Load & Haul and Load Out asset tags.
Select from one to four custom lists and click the arrow beside Total to view an optional Truck Count row.
-
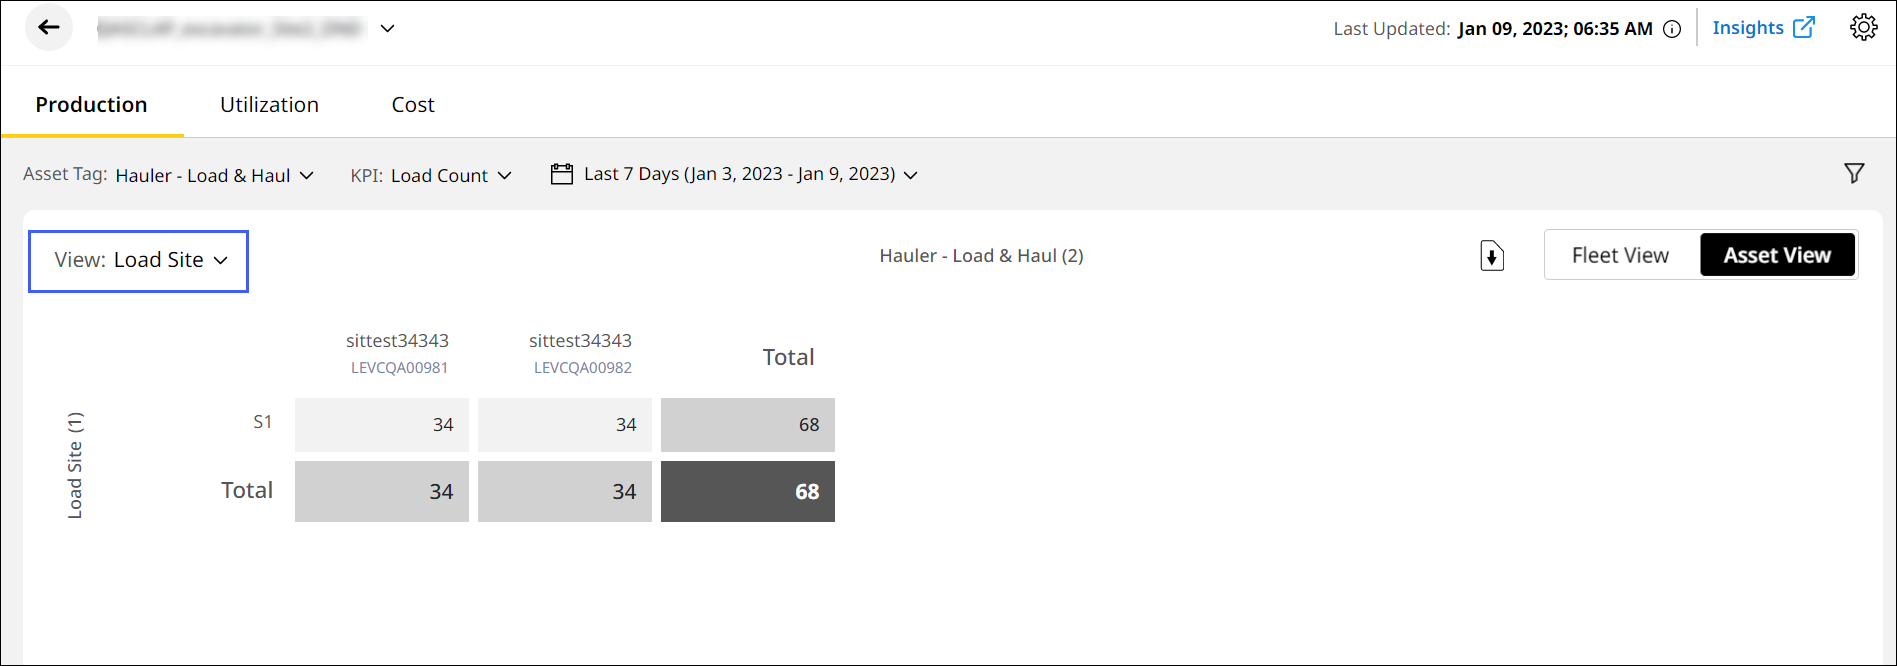
Load Site: Displays total material moved off the load site by a particular asset.
Available for Hauler – Load & Haul, Loader – Load & Haul and Load Out asset tags. Data is only available based on support by individual asset.
-
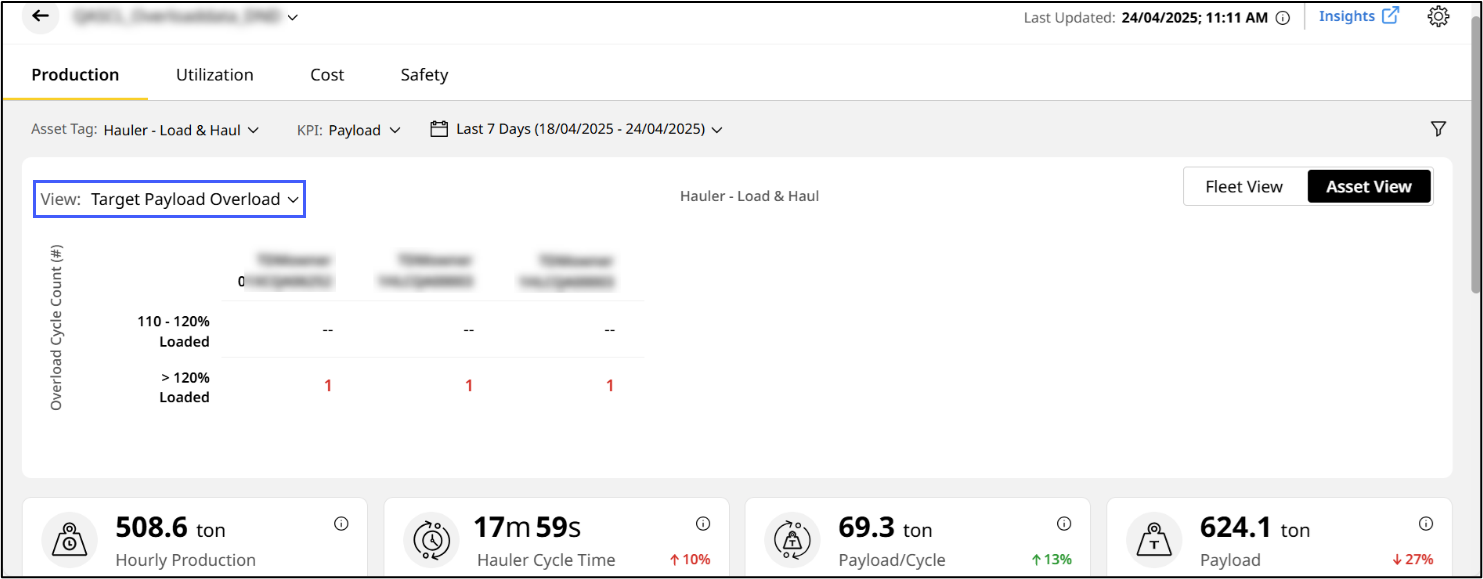
Target Payload Overload: Displays the list of overloaded assets and the limit each exceeded.
Available for only Hauler – Load & Haul asset tag subscribed to PerformancePro with Advanced Productivity. Data is only available based on support by individual asset.
Refer to Production (Site) Fleet and Asset Views for more information on Fleet and Asset View on Production (Site).