- + jobsite
- acceptable use policy
- account
- add user
- android
- answer
- april 2020
- archive
- asset tags
- assets
- assign schedule
- august 2020
- august 2021
- august 2022
- Average
- body up switch
- browser
- carbon footprint
- card error
- change KPI
- chrome
- CO2 emitted
- cookie
- copy site
- copyright
- cost kpi
- cost setup
- cost tab
- create
- currency
- custom list
- cut/fill
- dashboard
- december 2019
- december 2020
- december 2021
- delete site
- delete user
- digital offering
- dollar
- edit site
- edit targets
- edit user
- euro
- exemption
- FAQ
- favorite
- february 2020
- fill/dump
- filter
- firefox
- fleet
- frequently asked questions
- geofence
- getting started
- grid
- guide
- help
- ID
- insights reports
- introduction
- ios
- january 2020
- january 2021
- january 2022
- july 2020
- june 2022
- KPI
- KPI hierarchy
- landing page
- legal
- list
- list summary views
- load site
- login
- logout
- machine
- map tab
- march 2021
- march 2022
- material
- material list
- may 2020
- may 2021
- may 2022
- measurement
- more option
- november 2021
- october 2020
- october 2021
- october 2022
- overview
- playback view
- policy
- preferences
- primary KPI
- production tab
- productivity
- productivity insights
- question
- remove site
- renminbi
- report management
- report type
- restore site
- review
- safari
- schedule
- select assets
- september 2020
- set name and location
- shift
- shift comparison report
- step 1
- step 2
- step 3
- step 4
- step 5
- stockpile
- summary tab
- support
- telematics
- total cost
- user
- visionlink
- walkthrough
- zones
Site Summary Map View
Visualize selected KPIs along with respective asset IDs, serial number and other details on map view.
You can view map on the following Site Summary tabs:

-
Open the slider pane to select or deselect any zones or events to view. Events are clustered by default for locations where multiple events occur.

• Events in the slider pane will change based on the KPIs selected above. For instance, on Production (Site) and Cost (Site) tabs, selecting Load Count will display Load events data in the map view. Similarly, selecting Payload will show Dump events data.
• On Safety (Site), view the location of safety events based on the selected KPI and filters. -
Click on the cluster to zoom in and view individual event hotspot.
-
Click on a hotspot to view the info card that has the asset icon, asset ID, serial number, KPI data, timestamp, and Playback View.
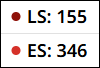
• If the site has multiple event hotspots close to each other, then, depending on the selected KPIs, these will display as clusters (the following image shows clusters for KPIs Loaded Stopped [LS] and Empty Stopped [ES]). Select any to zoom into the map view at that location.
View Image
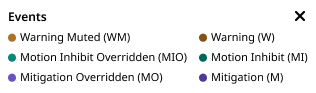
• The hotspot color will vary depending on the metric it visualizes. The legend or key for the same can be found in the bottom right of the map view. The following image shows the legend for Detect events.
View Image -
Use the navigation arrows on either side of the info card to view details of other events in the same location.
On Safety (Site), click on a zone to view zone color, zone name, zone type, number of assets with violations (for Seat Belt KPI) or number of assets contributing to the zone (for Detect KPI) and selected KPI details.
Right-click anywhere on the map to view latitude and longitude details. Click copy next to it to copy the coordinates.
View ImageItems
Features
Description

Zoom In
Zoom in the map for viewing all desired hotspots. 
Zoom Out
Zoom out the map for viewing all desired hotspots. 
Satellite View the map in satellite mode. 
Terrain View the map in terrain mode. 
Slider
• Select and visualize Site Images.
• Select or deselect Zones (if created) on map view.
• Toggle on/off site boundary.
• Toggle on/off deleted zones.

Double Up Arrow
View legend events on the map. 
Full Screen
Expand the entire screen of map view. 
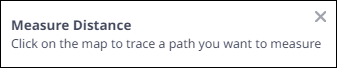
Polyline
Draw lines on the map for measuring distance and area. Connect lines through points to draw polygons on the map.
• When you click the polyline measure icon, the following measure distance pop-up is displayed on the map:
View Image
• The auto-calculated distance and area are displayed for the traced path on the map and measure distance pop-up.
• The drawn line can be completed by double-click on the plotted point and can be deleted by a single clicking on the specific point.
• The polyline measure can be turned off by clicking the closed icon of the measure distance pop-up.
.png)