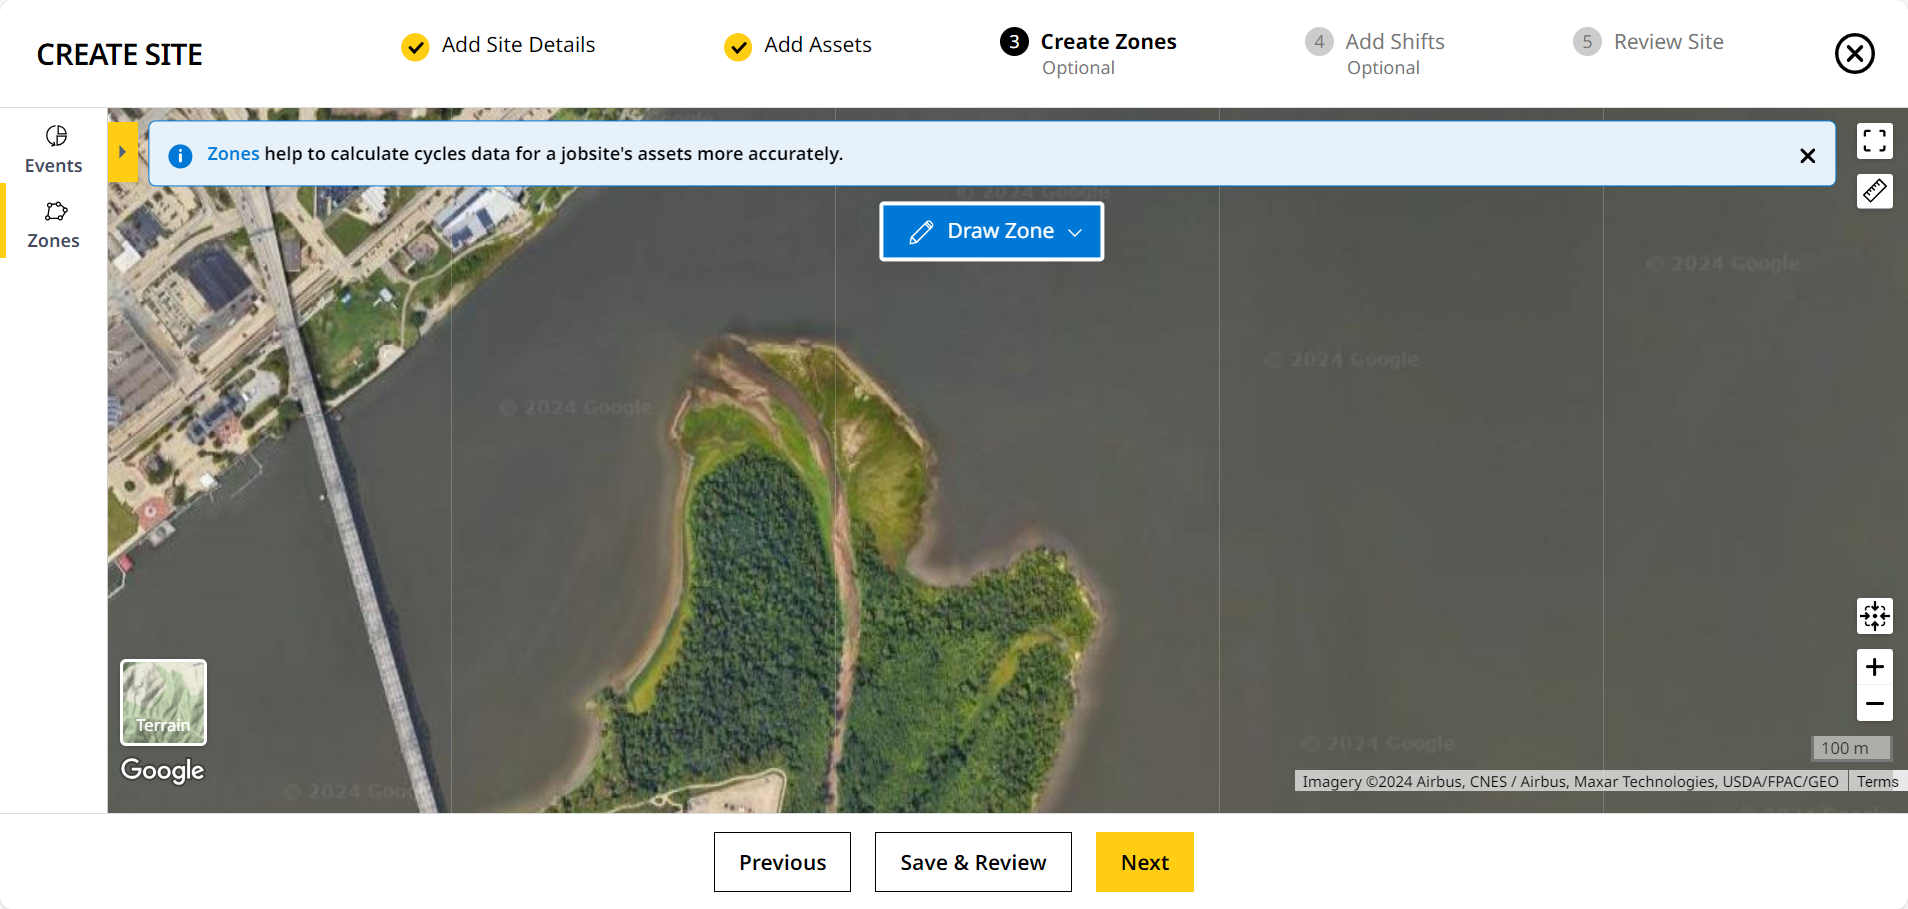
Create Zones
Zones represent sectioned area(s) within your site where specific functions take place. This can include areas where your assets dump material, pick up material, etc.
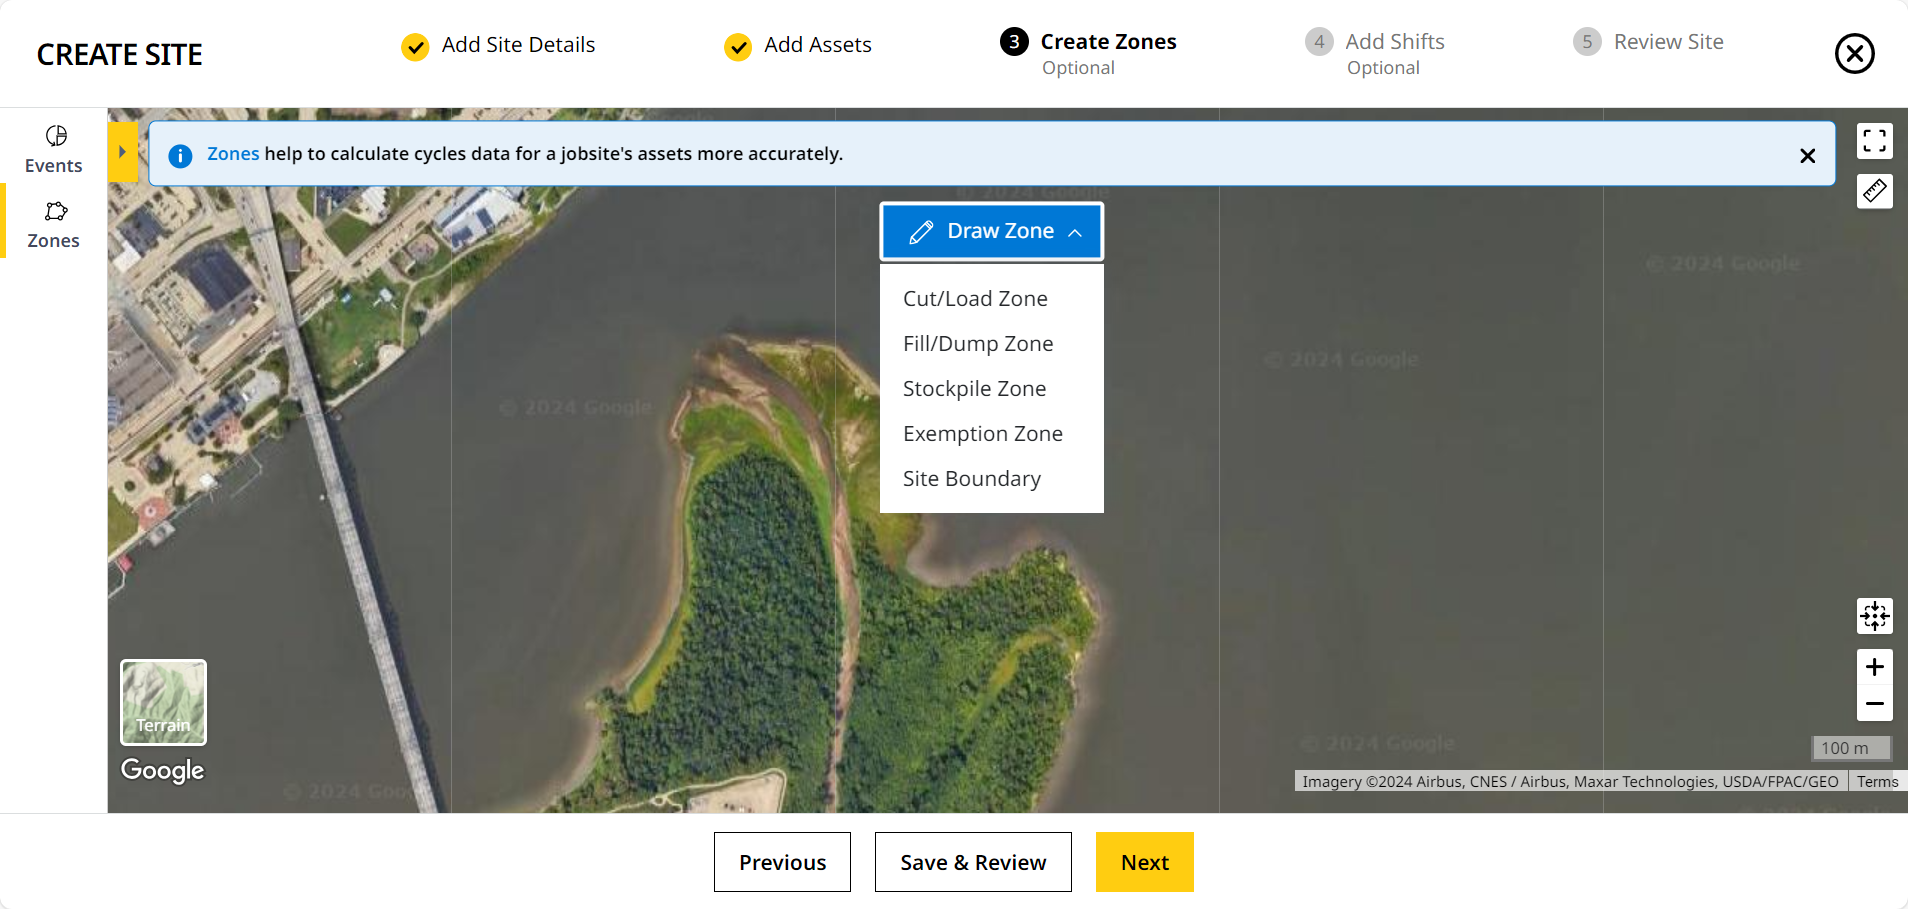
Use zones to improve logic. With Create Zones, you can draw and mark out different zones for a site in map view.The zones available are:
-
Cut/Load
-
Fill/Dump
-
Stockpile
-
Exemption
-
Site Boundary

Refer to Types of Zones for more information on the functionality of each zone type.
Also, identify the number of events that occurred in each zones, and when events (cut/fill, idle time,) are tied to the created zones. You can view zone information on Site Summary Fleet View, map view and on Insights Map.
Use these zones to help you create of cycles based on load and dump events and improve overall accuracy of the asset's performance.
Here, you can only create zones for load and dump events of Advanced Productivity- and Load-and Cycle-subscribed assets.
Zones
To create zones for your site:
-
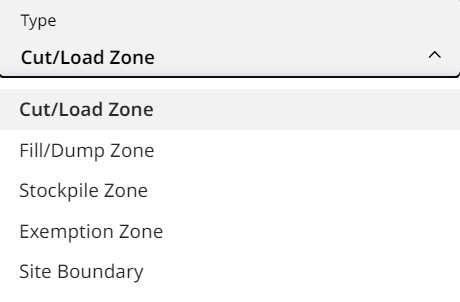
In Draw Zone, click drop down
 and select the zone type.
The selection of zone type helps in generating cycles. -
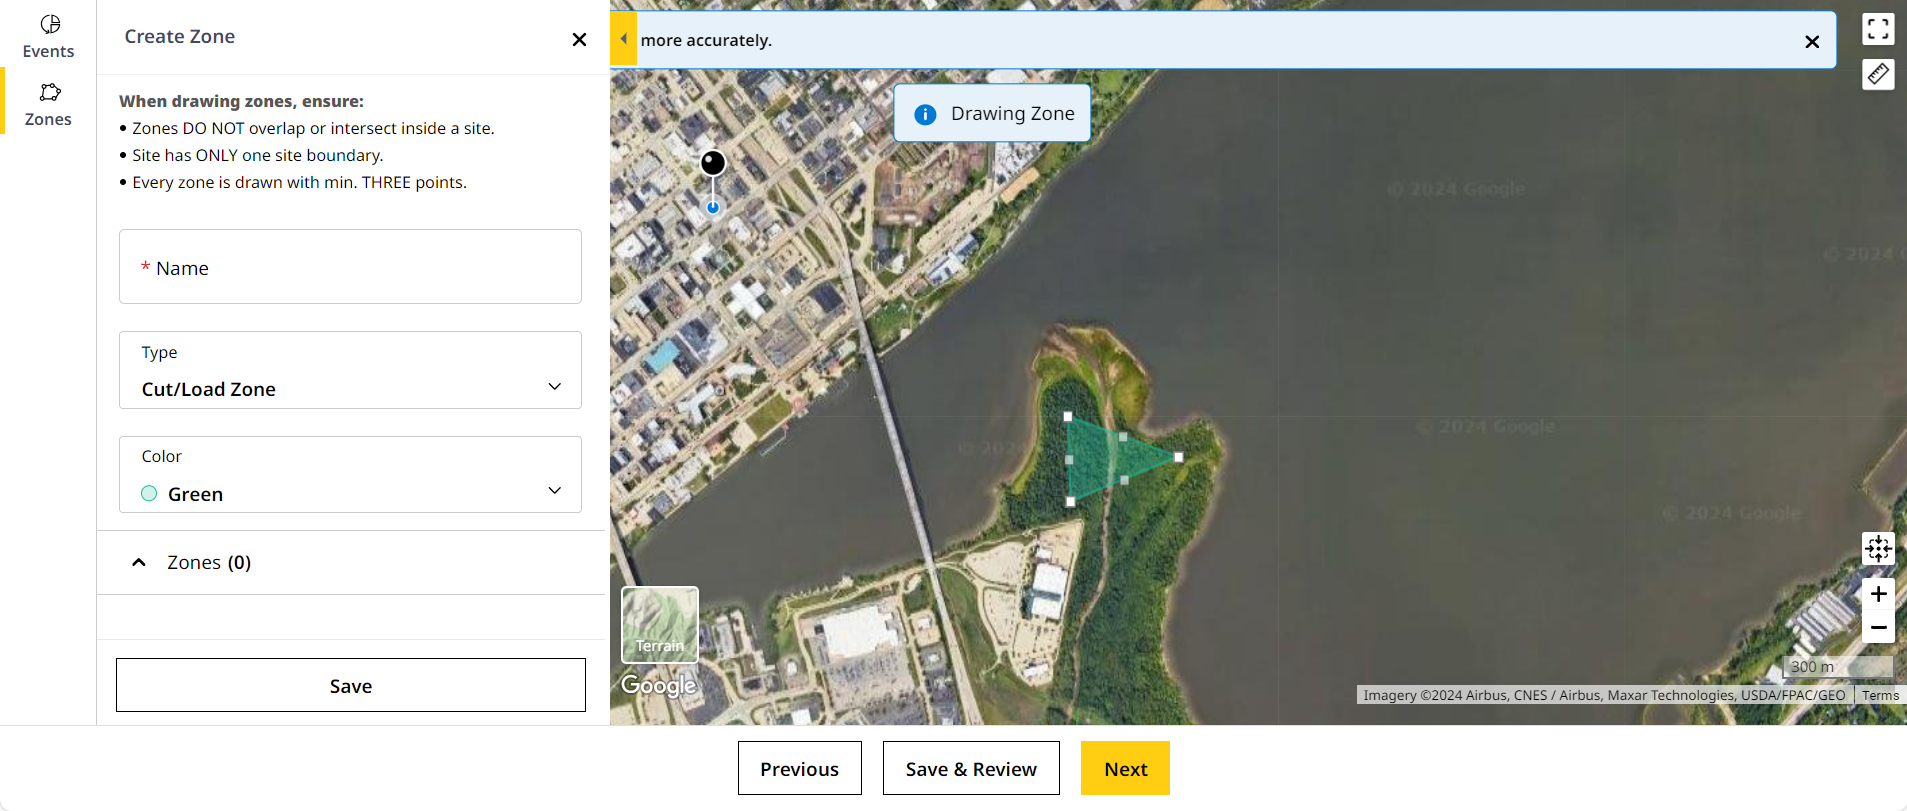
Draw the zone in free form shape with a minimum of three points. Click the same start and end points to complete the shape.
-
This displays the Create Zone pane on the left side, once the zone is drawn.
-
In the Create Zone pane, enter zone Name in the respective field.
As you create zones, please ensure:
-
Zones don't overlap or intersect.
-
Zones have minimum of THREE points while drawing
-
You only draw a SINGLE site boundary around the created zones.

• Zone names are case-insensitive and allows for spaces. If any of the required criteria is not met while entering the zone name, then it will be highlighted in red.
• When adding zone values, use different symbols other than a hyphen (_ & *) or add text to the numbers (eg. Area3-7, Dump4-5). Otherwise, while downloading the data as a.csv file, hyphenated numbers (eg. 3-7, 4-5, etc.) show up in a date format (3-7 becomes July 3).
-
-
Change the zone type in the slider pane, in case the incorrect type of zone was created.
-
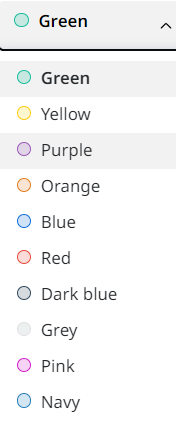
Select Color from drop-down list to select your preferred color for the zone and mark it out for easier viewing.
-
Click Save to check out the created zone within the map.

-
Once you create the zones, this updates the available zones in the zones section under the slider pane.
• The created zones are listed under each zone type. Each zone can be selected or deselected to update the zones on the map.
• If the Site Boundary zone type is created on the map, then the toggle button is auto-enabled.
• If there are any deleted zone on the map, then the toggle button is auto-enabled.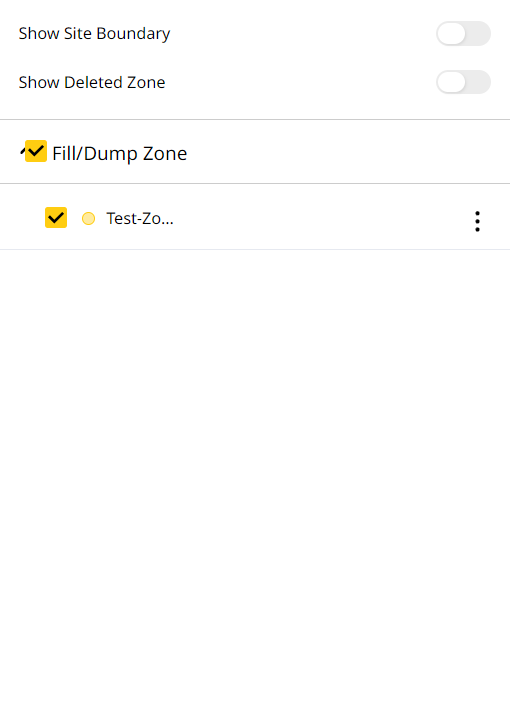
-
Select more options
 next to the created zone to edit or delete the zone.
The selected zone is highlighted with a thick border.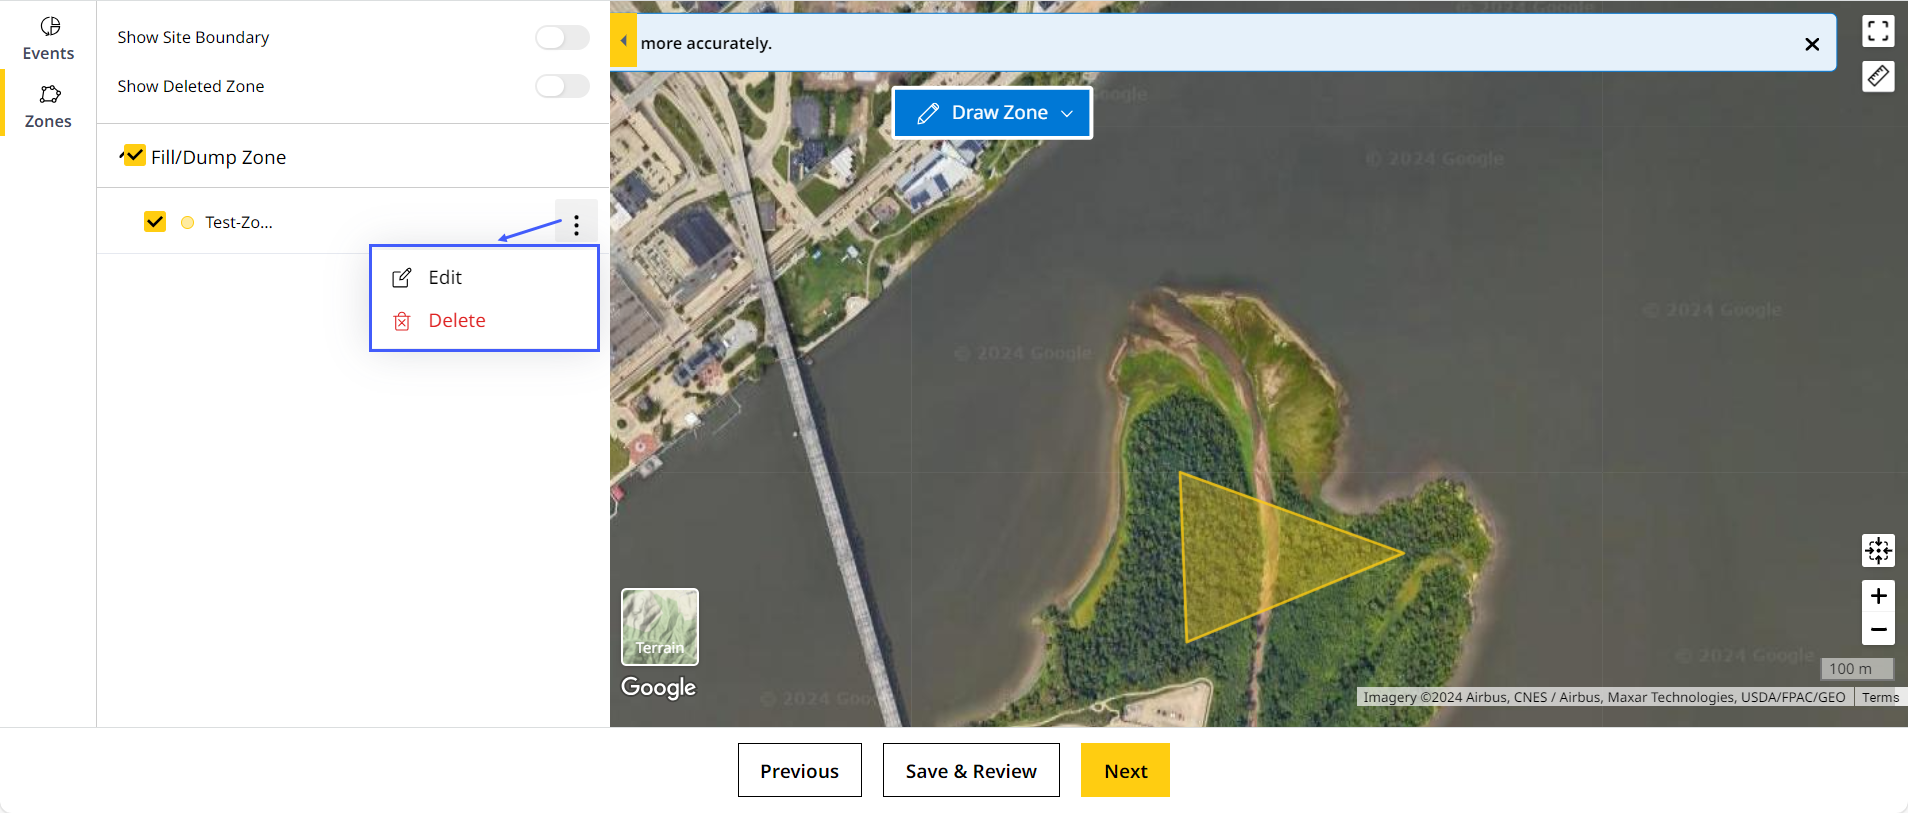
-
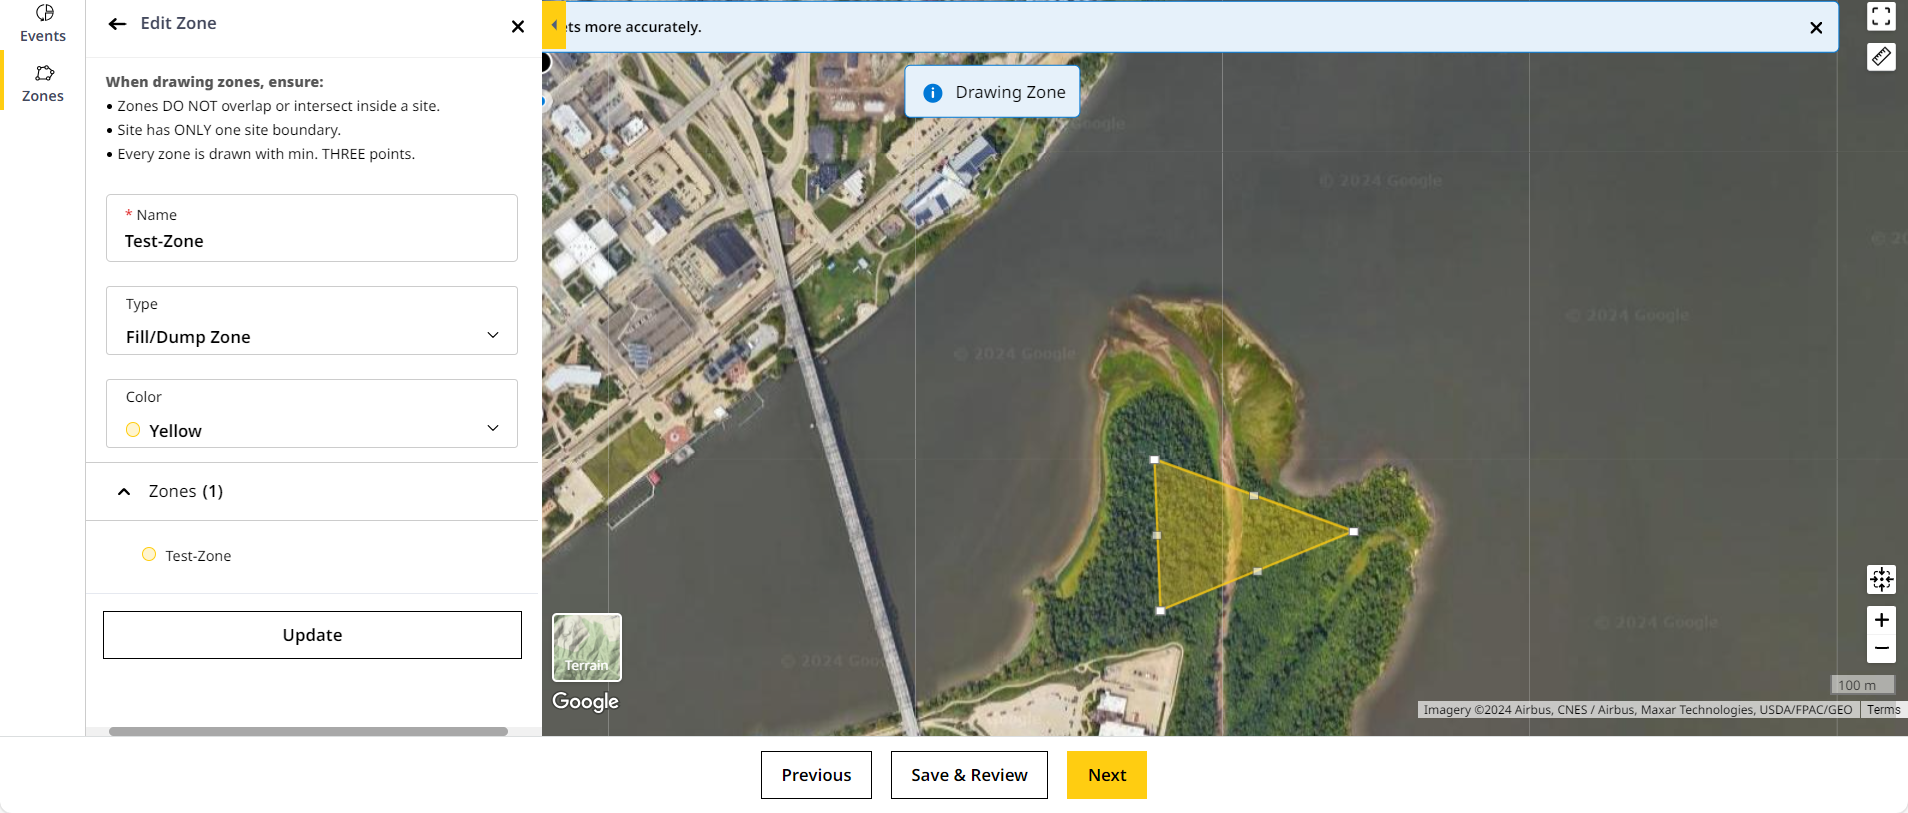
Click Edit. This displays Edit Zone.
-
Move the plotted end points and replot to create zones.
-
Rename, change zone type or modify zone color, if needed.
-
Click Update.
-
-
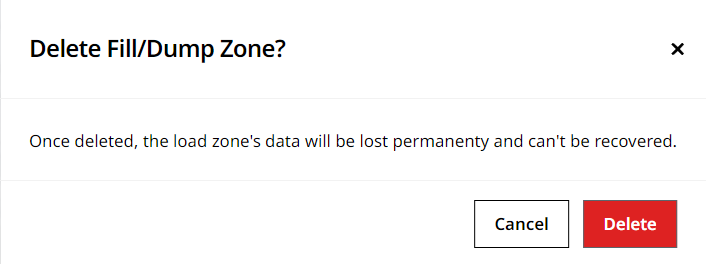
Click Delete. This displays Delete <Zone Type> Zone?. Click Delete to proceed.
-
-
Click Next to continue to Add Shifts.
Events
On Create Zones, you can also view events (production, idling, etc.) for your assets. To view events:
-
Select Events from slider
 .
. -
On the Select Asset drop down, select from the assets added in Add Assets. The assets are arranged under their respective asset tag drop down lists.
You can select only one asset at a time.
You can also the search bar to quickly find any relevant asset by its ID or serial number.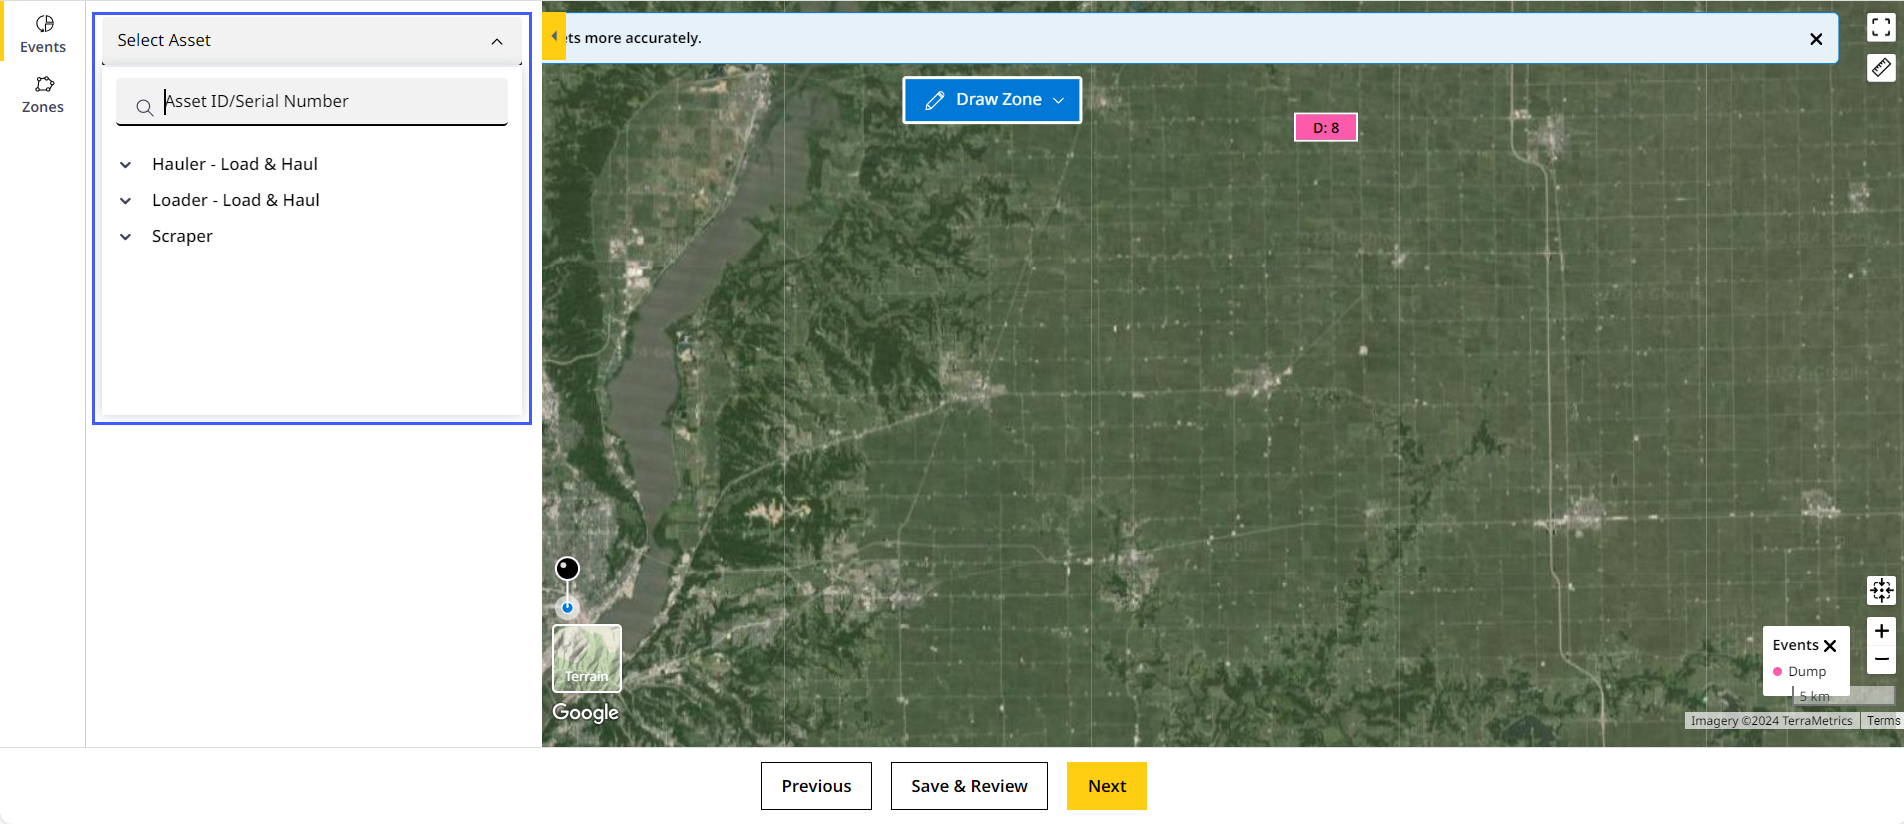
-
This displays all events performed by that particular asset. The events are further classified into:
-
Production Events: Includes all segments like load, dump, haul, etc.
-
Idling Events: Includes events like loaded stopped.
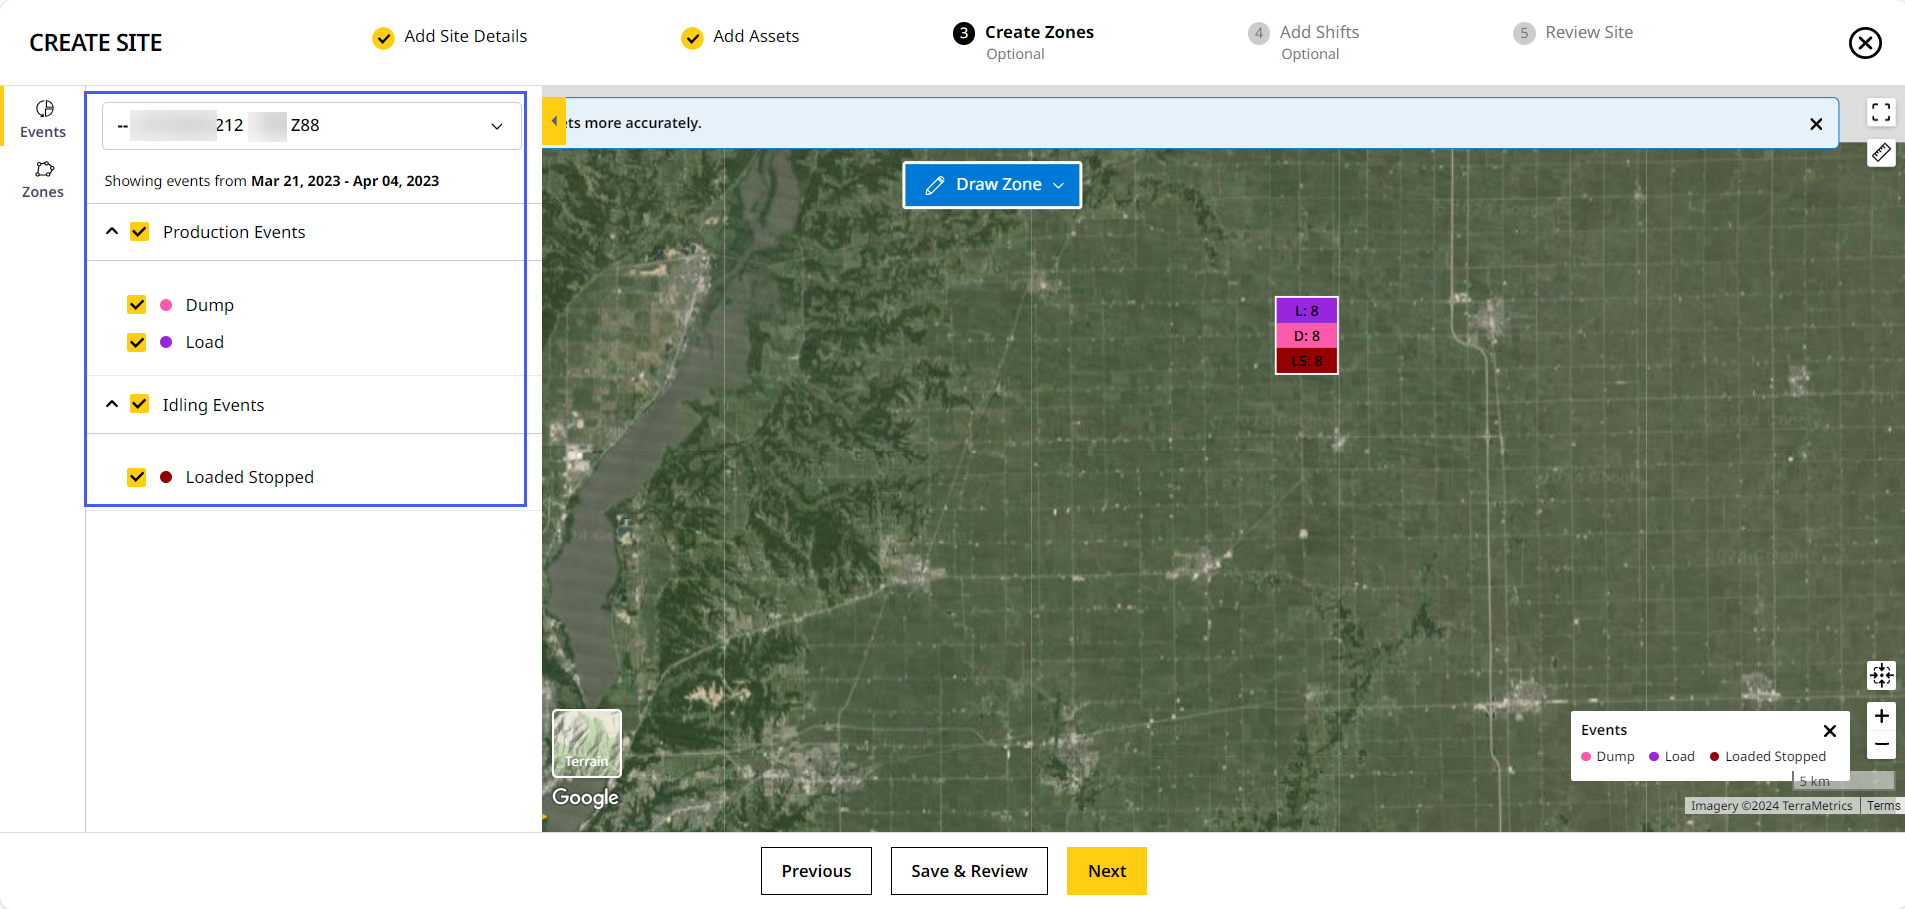
• Events data displays based on how long the asset was operational for. This is indicated by the date range above.
• Click check to toggle on/off a particular event, making it easier to focus on what matters. -
-
Click Next to continue to Add Shifts.
Map Icons and Corresponding Functions
The following table represents icons and their functions found within the map view:
| Items |
Features |
Description |
| Zoom In |
Zoom in the map for viewing the desired asset’s load and dump events. |
|
| Zoom Out |
Zoom out the map for viewing all the available asset’s load and dump events. |
|
 |
Satellite | View the map in Satellite mode. |
 |
Terrain | View the map in terrain mode. |
| Recenter |
Focus back on the selected location after panning the map. |
|
 |
Double Up Arrow | View the legend events on the map. |
 |
Full Screen | Expand the entire screen of the map. |
| Measure Distance |
Draw lines on the map for measuring distance and area. Connect lines through points to draw polygons on the map.
|