Production (Insights) Report
Production (Insights) report displays an offline copy of cycle and asset production data of the selected site based on selected asset tag and date range.
You can access Production (Insights) report from the following pages:
-
On Production (Insights), select download
 to access cycle and asset production data in detail for selected parameters.
 -
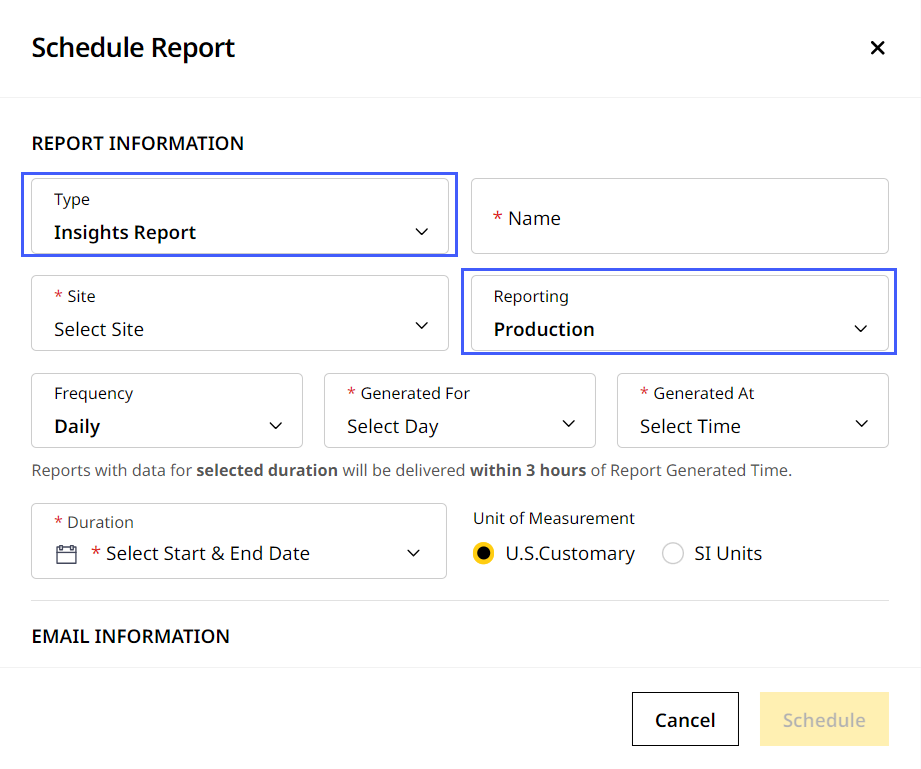
Select Type as Insights Report and Reporting as Production (this will be present as the default option). For information on filling in the remaining fields, refer to Insights Report (CSV).

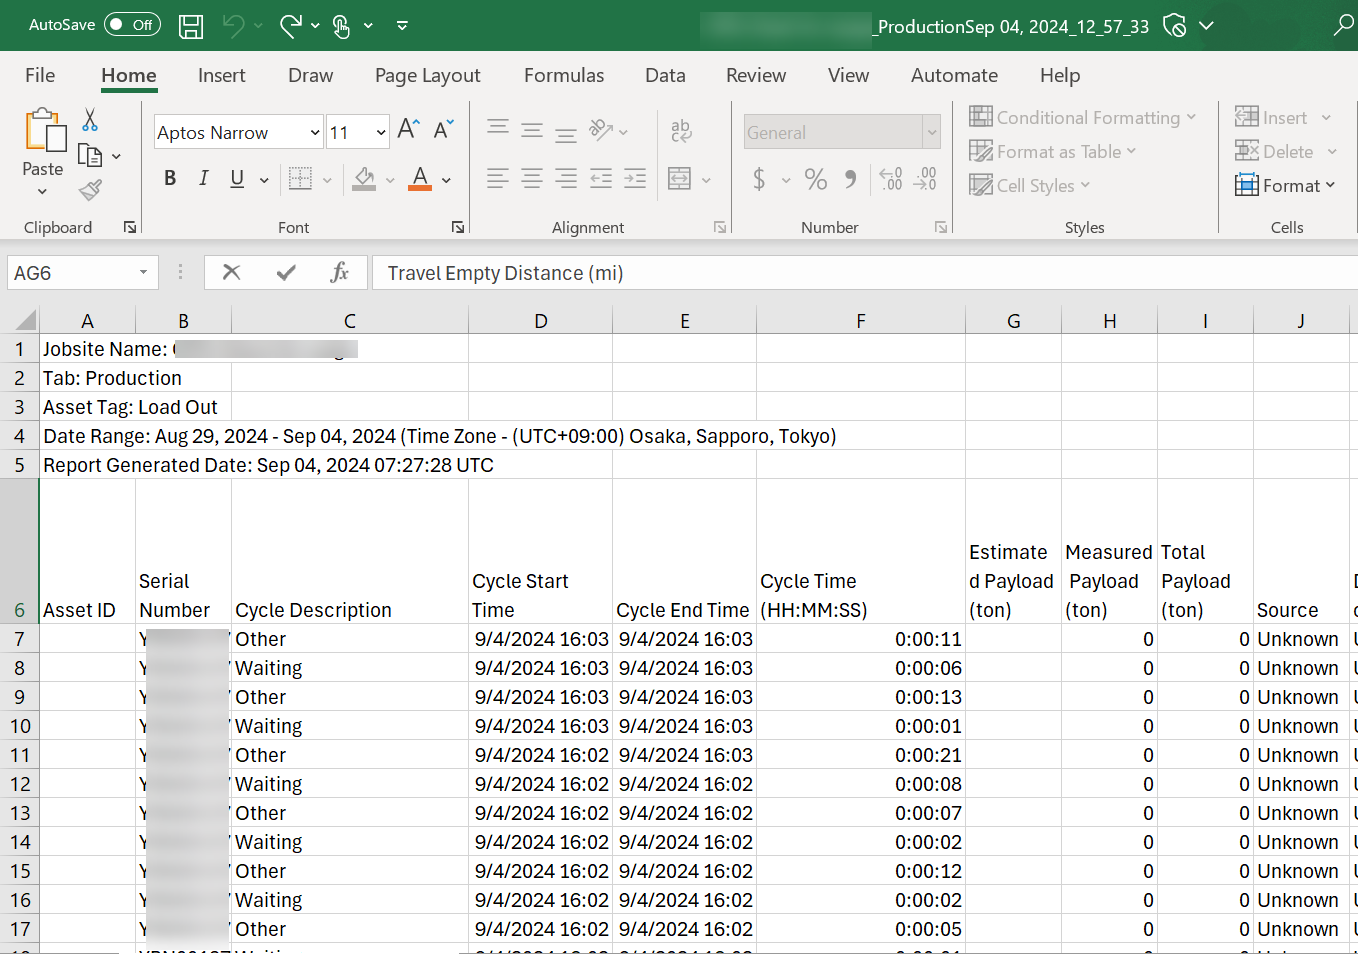
Based on available data, the report displays the following metrics in tabular format:
-
Asset ID
-
Serial number
-
Cycle description
-
Cycle start time (site timezone)
-
Cycle end time (site timezone)
-
Cycle time (duration)
-
Estimated payload
-
Measured payload
-
Total payload
-
Source
-
Destination
-
Dig time
-
Travel loaded time
-
Swing loaded time
-
Loaded stopped time
-
Dump time
-
Partial dump time
-
Travel empty time
-
Empty stopped time
-
Back dragging time
-
Miscellaneous time
-
Swing empty time
-
Total cost
-
Cost per payload
-
Total distance
-
Travel time
-
Load time
-
Key-on, engine-off time
-
Dig distance
-
Travel loaded distance
-
Dump distance
-
Partial dump distance
-
Travel empty distance
-
Back dragging distance
-
Miscellaneous distance
-
Travel distance
-
Load distance
-
Fuel quantity used
-
Load latitude
-
Load longitude
-
Dump latitude
-
Dump longitude
-
Make
-
Model
-
Truck ID
-
Material name
-
Printer ticket number
-
Custom lists 1-4
-
Bucket payload sequence
-
Total truck buckets
-
Truck payload
-
Load site
-
Shift data (if tracked on the site)
Here is a sample Production (Insights) report (as a .csv file):
