- + jobsite
- acceptable use policy
- account
- add user
- android
- answer
- april 2020
- archive
- asset tags
- assets
- assign schedule
- august 2020
- august 2021
- august 2022
- Average
- body up switch
- browser
- carbon footprint
- card error
- change KPI
- chrome
- CO2 emitted
- cookie
- copy site
- copyright
- cost kpi
- cost setup
- cost tab
- create
- currency
- custom list
- cut/fill
- dashboard
- december 2019
- december 2020
- december 2021
- delete site
- delete user
- digital offering
- dollar
- edit site
- edit targets
- edit user
- euro
- exemption
- FAQ
- favorite
- february 2020
- fill/dump
- filter
- firefox
- fleet
- frequently asked questions
- geofence
- getting started
- grid
- guide
- help
- ID
- insights reports
- introduction
- ios
- january 2020
- january 2021
- january 2022
- july 2020
- june 2022
- KPI
- KPI hierarchy
- landing page
- legal
- list
- list summary views
- load site
- login
- logout
- machine
- map tab
- march 2021
- march 2022
- material
- material list
- may 2020
- may 2021
- may 2022
- measurement
- more option
- november 2021
- october 2020
- october 2021
- october 2022
- overview
- playback view
- policy
- preferences
- primary KPI
- production tab
- productivity
- productivity insights
- question
- remove site
- renminbi
- report management
- report type
- restore site
- review
- safari
- schedule
- select assets
- september 2020
- set name and location
- shift
- shift comparison report
- step 1
- step 2
- step 3
- step 4
- step 5
- stockpile
- summary tab
- support
- telematics
- total cost
- user
- visionlink
- walkthrough
- zones
Safety (Site) Tab
When you're on Safety Dashboard, clicking any site card takes you to its respective Safety (Site).
With Safety (Site), drill-down and view detailed chart, tabular and map-wise breakdown of vital safety data. This includes seat belt and detect metrics, to understand operators’ level of compliance.
You can also
-
sort the data displayed by KPI and date range,
-
toggle between Fleet View and Asset View and
-
filter by assets operating within the site.

Now, access Safety (Site) using one of two ways:
• Navigate to Sites Dashboard > click Site Summary > select Safety.
• Navigate to Safety Dashboard > click Safety Summary.
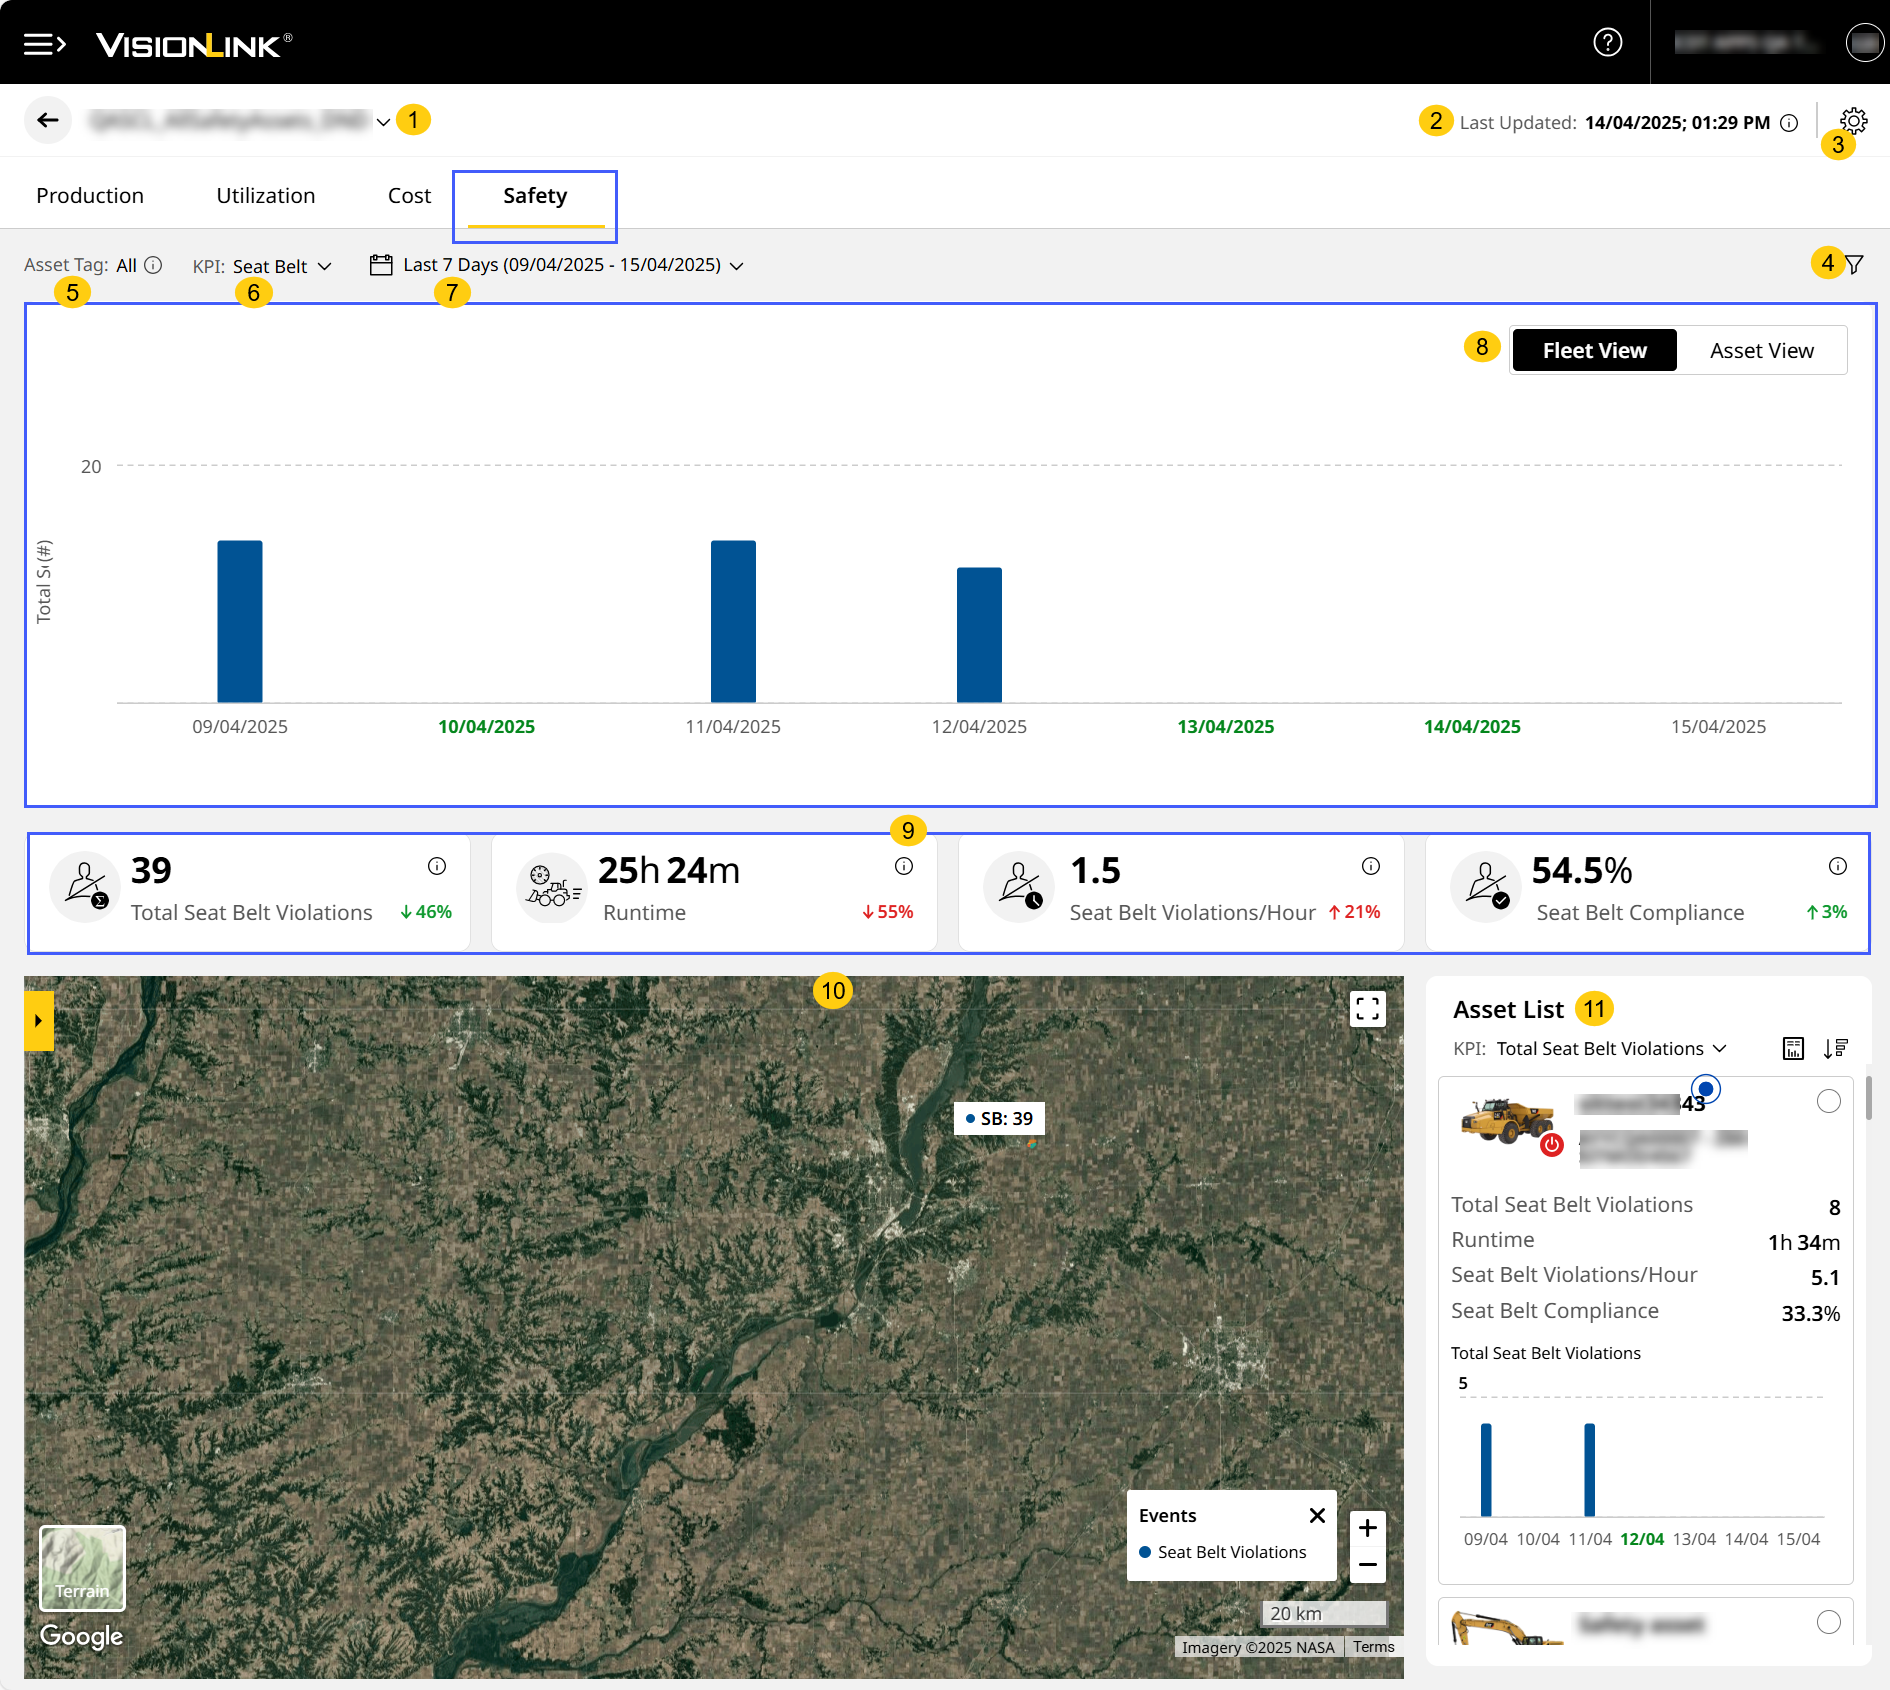
Safety (Site) displays data based on preferences selected in your account settings and asset tags added during site creation.
-
Site Name: View the site name here. Use the drop down to switch sites without navigating back to Sites Dashboard.
-
Last Updated: View the timestamp of the last reported data. Click info
 to view the time zone (country/city) of the selected site.
 -
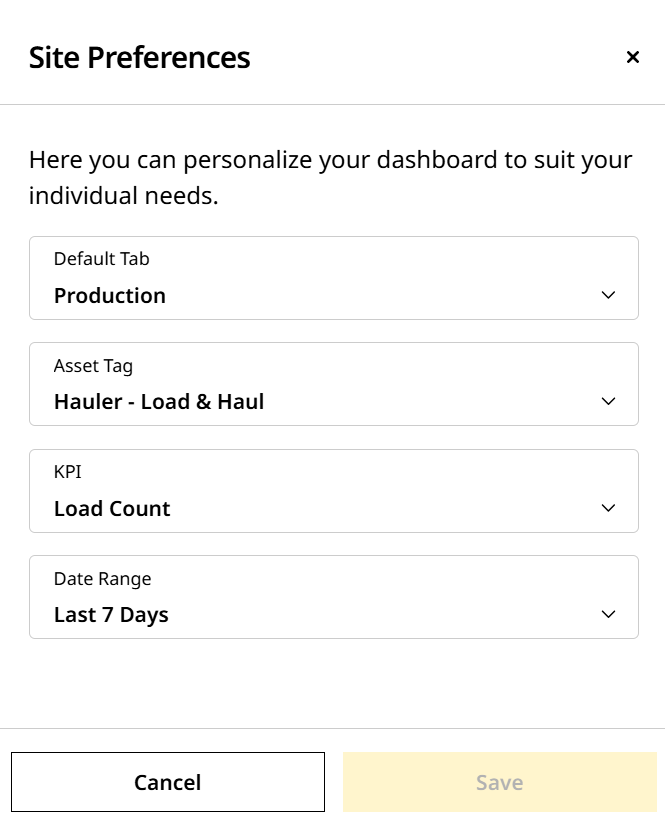
Site Preferences: Customize Site Summary to fit your needs. You can change the Default Tab, Asset Tags, KPI, and Date Range.
-
Filters
 : Filter based on preferred assets and type of detected obstructions.
 -
Asset Tag: View safety data for all assets regardless of the asset tags.

Asset tags selected in Production (Site), Utilization (Site), Cost (Site) will not be carried over to Safety (Site). -
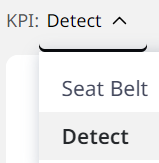
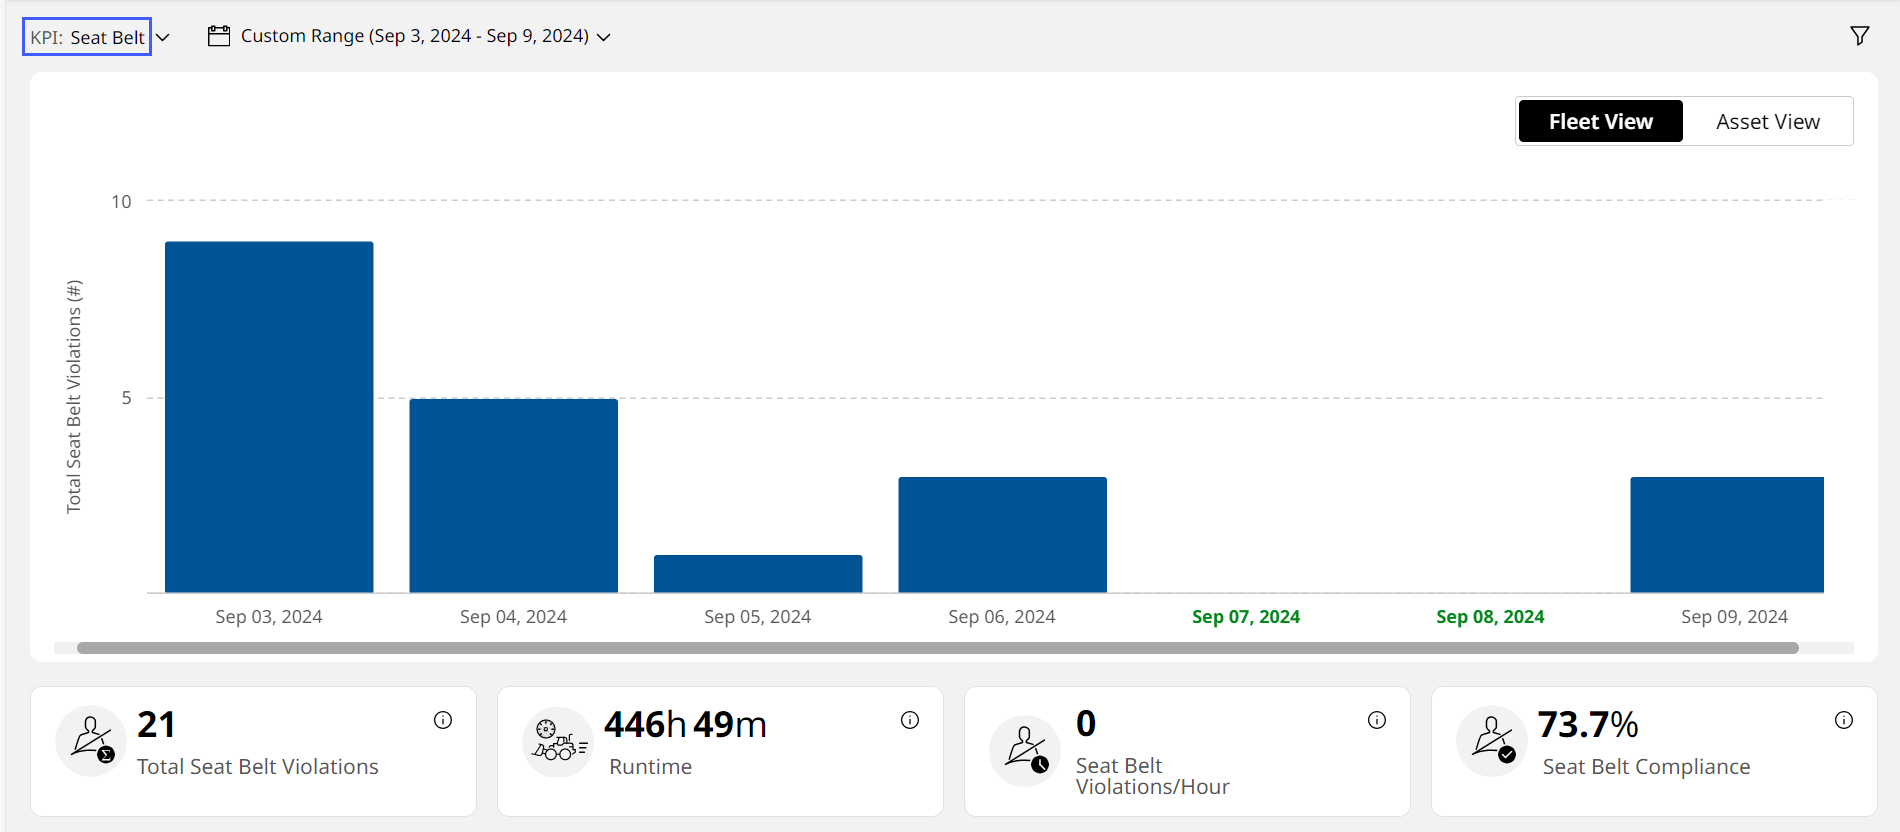
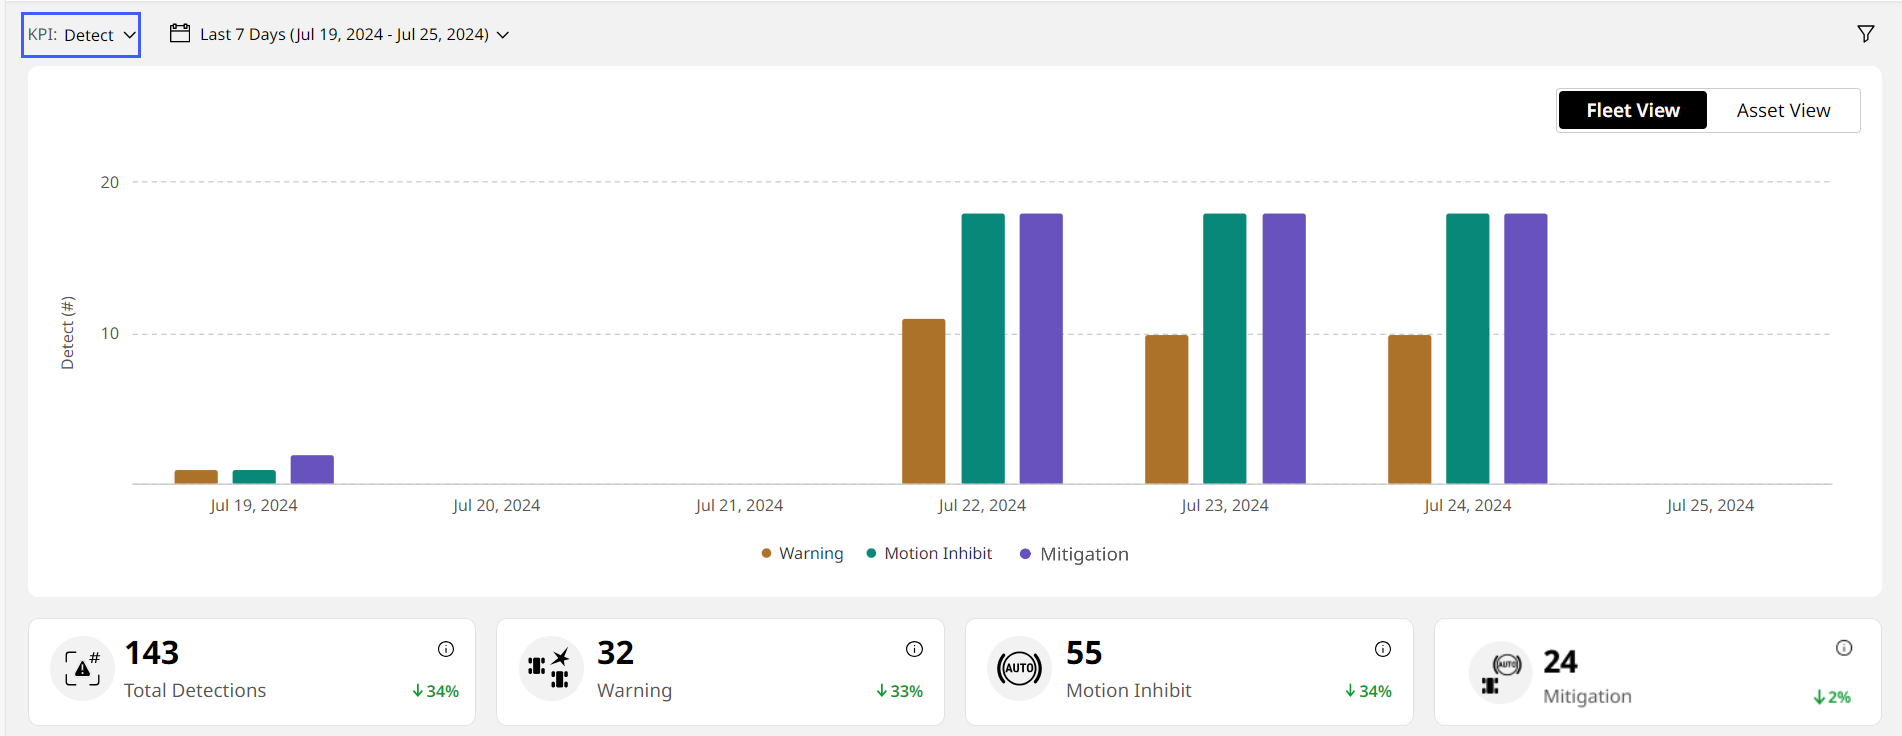
KPI: Select from the following KPIs to view corresponding chart, KPI card, tabular and map data:
-
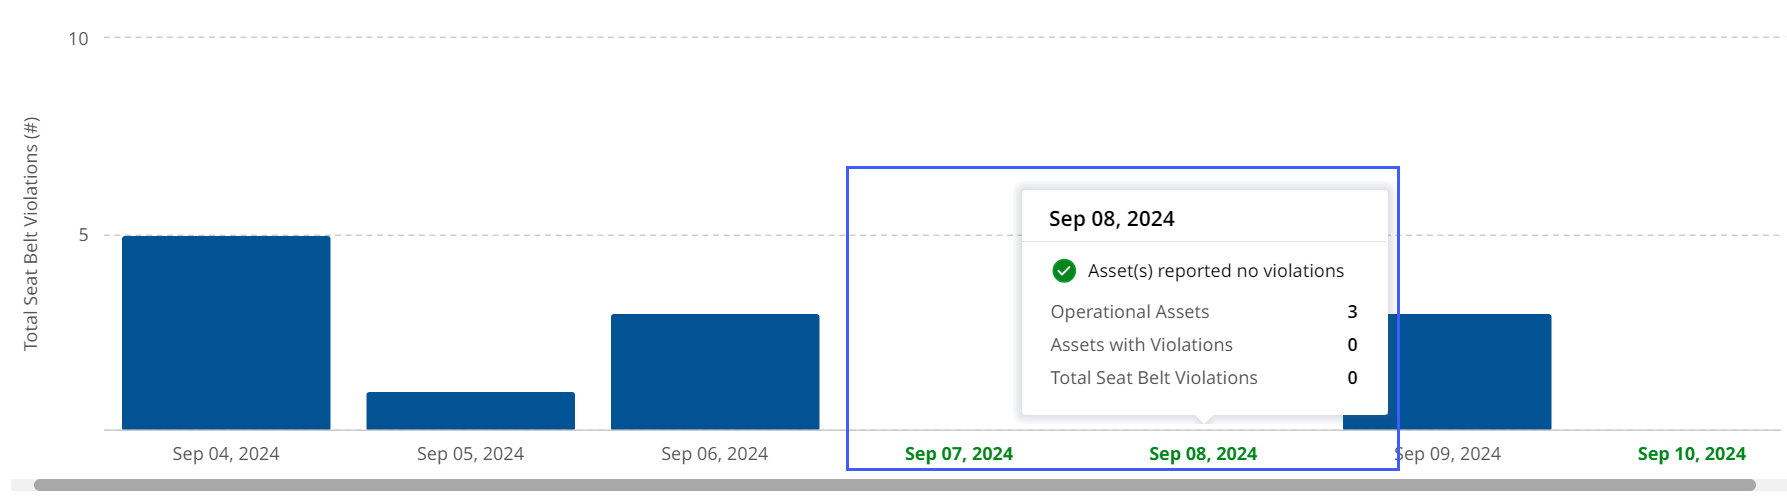
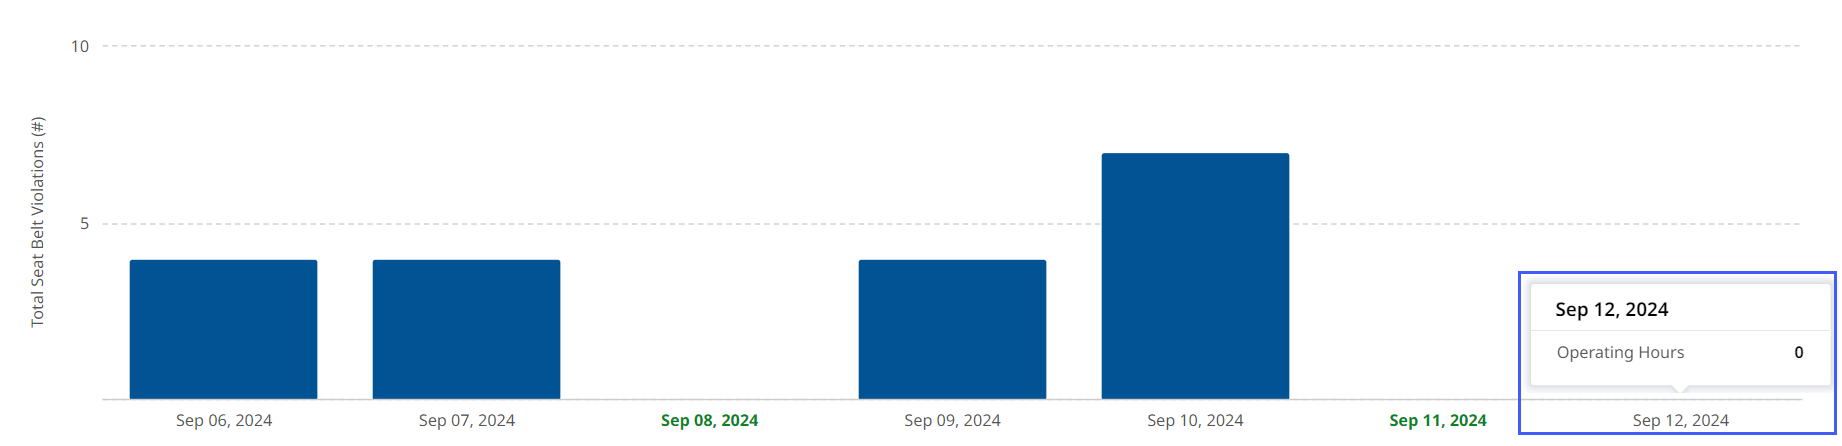
Seat Belt: Provides a total count of seat belt violations for the site’s fleet of assets or individual assets for the selected date range. Also provides compliance data from zero to 100 percentage, denoting no violation and violation respectively.
When selecting Seat Belt, the column chart and Asset List will sometimes display fleet-wise or asset-wise data in the following colors:
• Green, which indicates that the asset/fleet was operational and hasn’t reported any violation for that time period.
View Image
• Grey, which indicates that the asset/fleet wasn’t operational for that time period.
View Image -
Detect: Number of times a person or object was detected in the critical (red on the display) zone while the asset traveled in reverse.
-
-
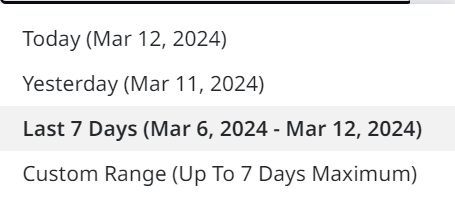
Date Range: Choose the date range to view the KPI data from the following:
-
Today
-
Yesterday
-
Last 7 Days
-
Custom Date Range: Up to seven days in one stretch from a period of 13 months.
-
-
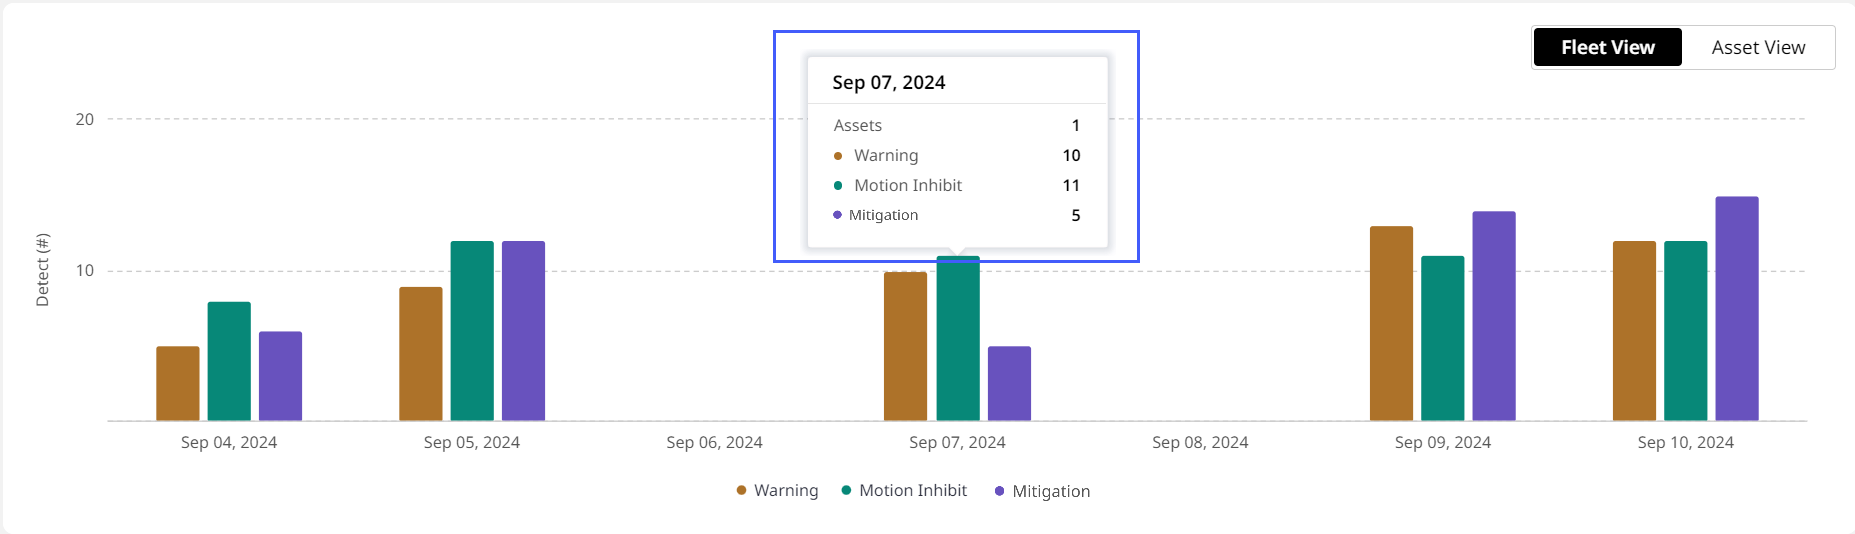
Fleet/Asset View
 : Toggle between Fleet View or Asset View, based on the selected KPI, date range and filters. This displays data in the form of bar graphs.
-
Fleet View displays safety data for the entire site, aggregating all assets together. This appears by default.
Hover over a column to view the following:
-
Seat Belt: Number of assets operating, number of assets that reported violations and total violations reported for that date range.

-
Detect: Asset count, number of warnings, motion inhibits and coming soon events for that date range.
-
-
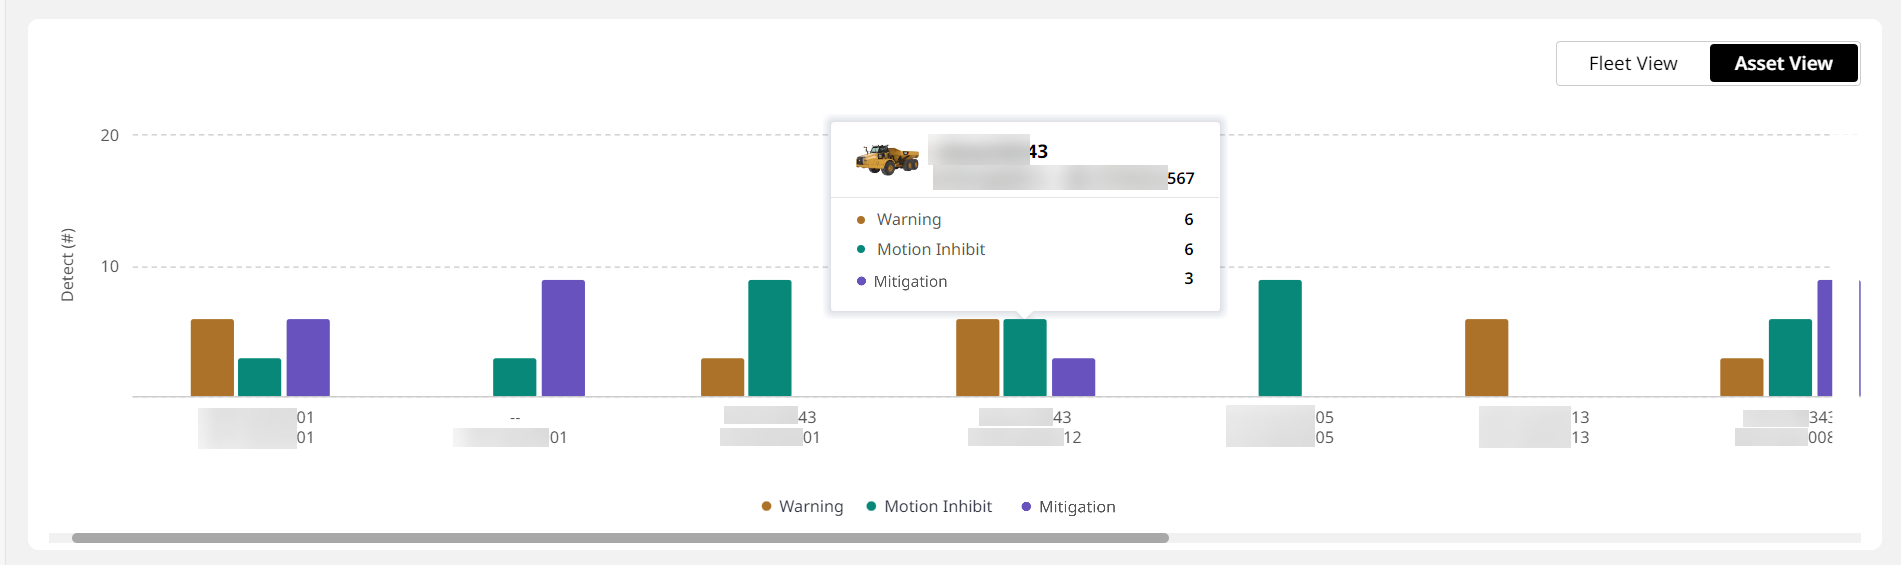
Asset View displays safety data for each individual asset within the site.
-
Hover over a column to view the asset ID, serial number and selected KPI values for that date range.
-
-
-
KPI Cards: The following KPI cards display data based on the KPI and date range selected:
Seat Belt Detect Total Seat Belt Violations Total Detections Runtime Warning Seat Belt Violations/Hour Motion Inhibit Seat Belt Compliance Mitigation You can not only view the KPI data but also track the percentage change as one of the following:
-
Beneficial increase

-
Detrimental increase

-
Beneficial decrease

-
Detrimental decrease

The value displayed is in comparison to the prior range (single day or multiple days).
If you select Custom Date Range, then the KPI card values won't display the percentage increase or decrease . -
-
Map View: Displays the location of safety events based on KPI, date range and filters selected above.

-
Open slider
 to visualize the site image, select or deselect any created zones and show site boundary or deleted zones.
 -
Click on a hotspot
 to view asset icon, asset ID, serial number, timestamp and KPI details.
-
If the site has multiple event hotspots close to each other, then these will display as clusters. Select any to zoom into the map view at that location.

-
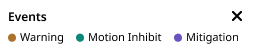
The hotspot color will vary depending on the metric it visualizes. The legend or key for the same can be found in the bottom right of the map view.
-
-
Click on a zone to view zone color, zone name, zone type, number of assets with violations (for Seat Belt KPI) or number of assets contributing to the zone (for Detect KPI) and selected KPI details.
-
Use the navigation arrows on either side of the info card to view details of other events in the same location.
Items
Features
Description

Zoom In
Zoom in the map for viewing all desired hotspots. 
Zoom Out
Zoom out the map for viewing all desired hotspots. 
Satellite View the map in satellite mode. 
Terrain View the map in terrain mode. Slider
• Select and visualize Site Images.
• Select or deselect Zones (if created) on map view.
• Toggle on/off site boundary.
• Toggle on/off deleted zones.

Double Up Arrow
View legend events on the map. 
Full Screen
Expand the entire screen of map view.
-
-
Asset List: Find list of all the configured assets in the site and a brief overview of each.
Look out for red error displayed next to an asset ID if any active faults are detected in a site. Connectivity issues or failure to retrieve data are common issues.