- + jobsite
- acceptable use policy
- account
- add user
- android
- answer
- april 2020
- archive
- asset tags
- assets
- assign schedule
- august 2020
- august 2021
- august 2022
- Average
- body up switch
- browser
- carbon footprint
- card error
- change KPI
- chrome
- CO2 emitted
- cookie
- copy site
- copyright
- cost kpi
- cost setup
- cost tab
- create
- currency
- custom list
- cut/fill
- dashboard
- december 2019
- december 2020
- december 2021
- delete site
- delete user
- digital offering
- dollar
- edit site
- edit targets
- edit user
- euro
- exemption
- FAQ
- favorite
- february 2020
- fill/dump
- filter
- firefox
- fleet
- frequently asked questions
- geofence
- getting started
- grid
- guide
- help
- ID
- insights reports
- introduction
- ios
- january 2020
- january 2021
- january 2022
- july 2020
- june 2022
- KPI
- KPI hierarchy
- landing page
- legal
- list
- list summary views
- load site
- login
- logout
- machine
- map tab
- march 2021
- march 2022
- material
- material list
- may 2020
- may 2021
- may 2022
- measurement
- more option
- november 2021
- october 2020
- october 2021
- october 2022
- overview
- playback view
- policy
- preferences
- primary KPI
- production tab
- productivity
- productivity insights
- question
- remove site
- renminbi
- report management
- report type
- restore site
- review
- safari
- schedule
- select assets
- september 2020
- set name and location
- shift
- shift comparison report
- step 1
- step 2
- step 3
- step 4
- step 5
- stockpile
- summary tab
- support
- telematics
- total cost
- user
- visionlink
- walkthrough
- zones
Site List Summary Report
Use Site List Summary report to obtain key production and utilization data for all sites in the account. You can view each site's metrics categorized by asset tag for easier tracking and measurement.
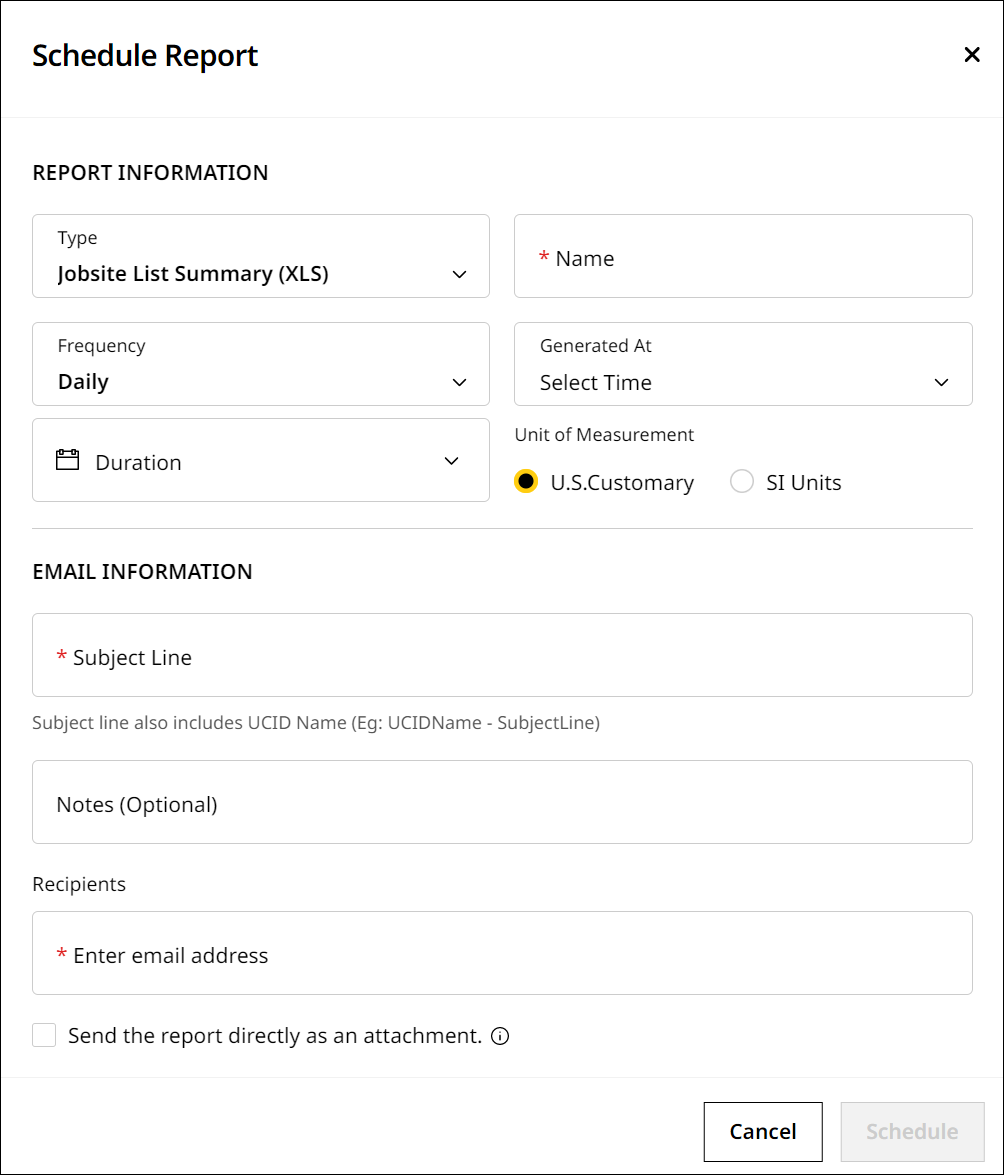
Schedule this report to receive summary updates of your site on a daily, weekly and monthly basis.
You can also edit, copy and delete site list summary report on Reports.
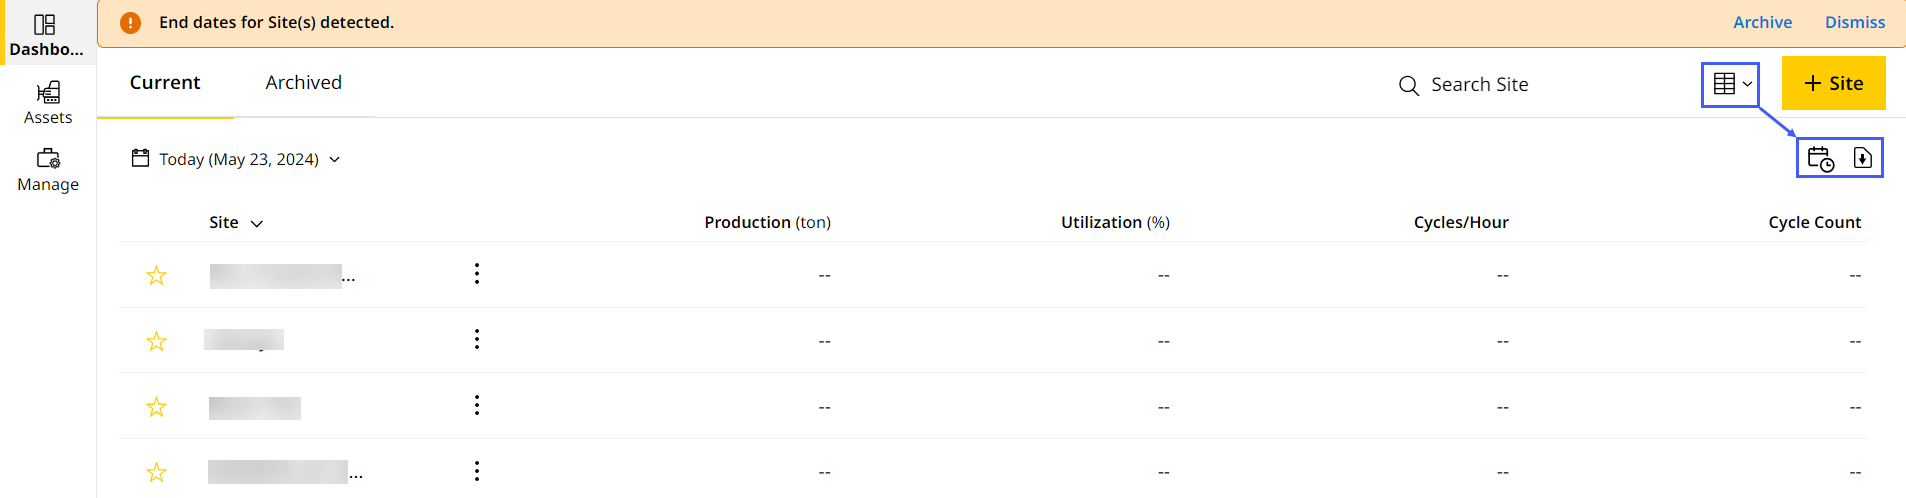
Directly schedule or download the site list summary report as an .xls file under Sites Dashboard List View.
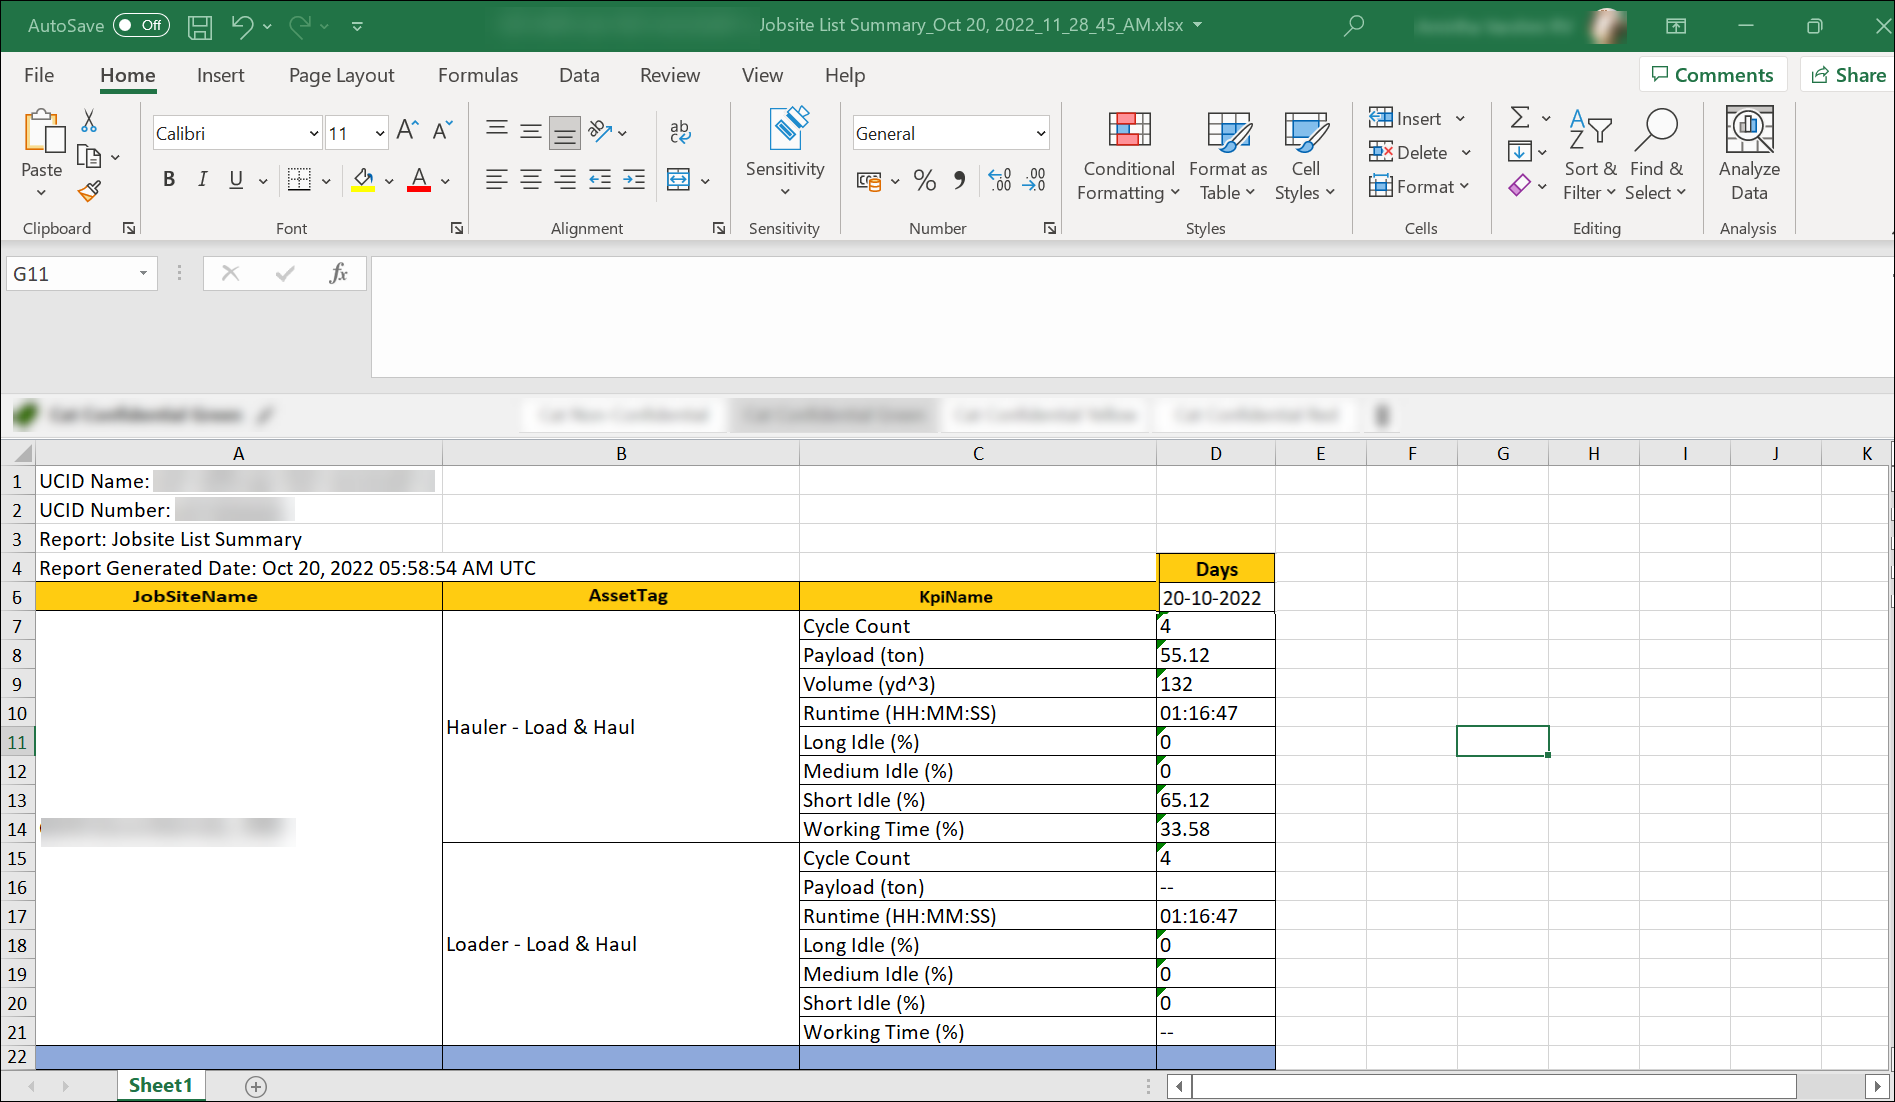
Based on available data, the report displays the following key metrics in a tabular format:
-
Site name
-
Asset tag
-
Days
-
KPI name
-
All tags except Support:
-
Cycle count
-
Payload
-
Runtime
-
Volume
-
Long idle (%)
-
Medium idle (%)
-
Short idle (%)
-
Working time (%)
-
-
Support
-
Runtime
-
Long idle
-
Medium idle
-
Short idle
-
Working time
-
-
The following is a sample Site List Summary Report: