Safety Summary Report
Use Safety Summary Report to compile, share and analyze offline the safety data for your site. You can send this report to your team members on a regular basis and keep them updated. It covers seat belt and detect metrics, presented in a .pdf file in the form of charts, tables and maps.

To know which assets support safety data and included in Safety Summary Report, refer to Safety Data Visibility by Subscription.
To schedule a Safety Summary Report:
-
Navigate to Manage > Reports > click
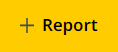 to open Schedule Report.
-
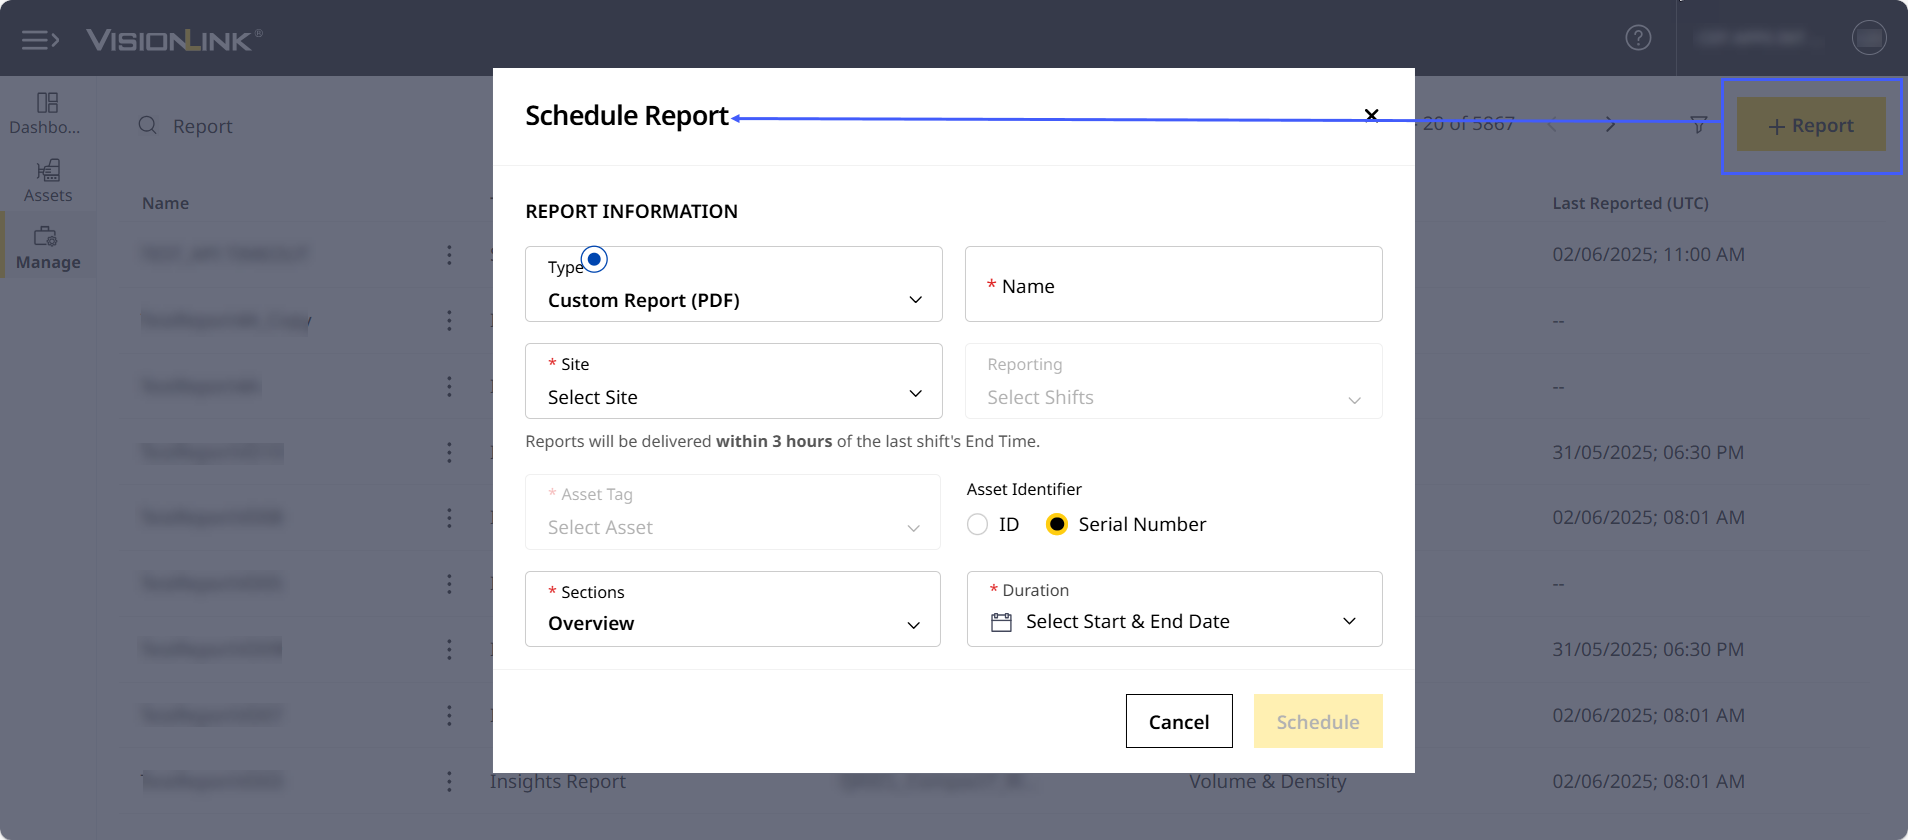
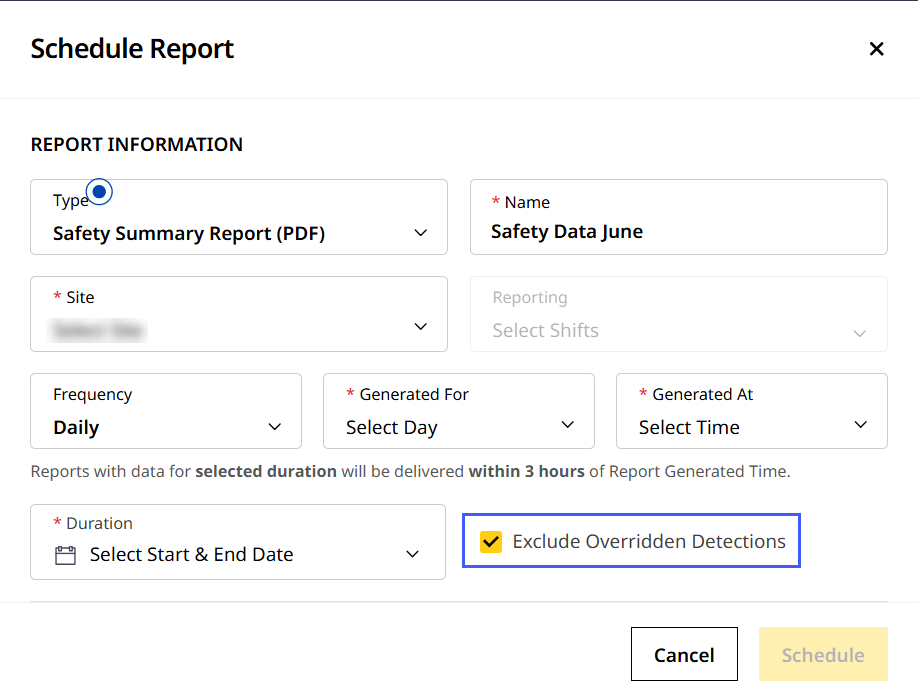
Under Type, select Safety List Summary (PDF).
-
Enter a report Name that is unique, matches the given criteria and easily relates to its use.
-
Under Site, type to search or directly select the site name.

-
Set Frequency to Daily, Weekly or Monthly as required. Depending on what you select, the following must be kept in mind:
Daily Reports:
Under Generated For, you can choose Today, Yesterday or the Last 24 Hours. Under Generated At, set time between 12:00 AM and 11:59 PM to generate the daily report.
-
If Generated For is selected as Last 24 Hours or Today:
-
The report will be delivered every day within three hours of the selected Generated At option.
-
-
If Generated For is selected as Yesterday:
-
The Generated At will be set at 11:59PM by default and disabled for changes. Hence, the report will contain data from 12:00AM to 11:59PM of the previous day and be delivered by 3:00AM of the current day.
-
Weekly Reports:
Under Generated On, select a day of the week:
-
Set Generated At between 12:00AM and 11:59PM of the report generated day.
Monthly Reports:
Under Generated Date, select a date:
-
Set Generated At between 12:00AM and 11:59PM of the report generated day.

-
-
Select the Duration (start and end date) of the report.
-
Check
 Exclude Overridden Detections if you don’t want muted and overridden detection event data to appear in the report.
-
Email Information
-
Add a custom Subject Line for easy reference. Note that it will be prefixed with the selected site name to enable easy identification.
-
Enter any notes to provide further details or context to the email’s recipients, if required.
-
Type in the email IDs you want to send the new Safety Summary Report.
If you want to add multiple email IDs, press Enter to separately add each one. -
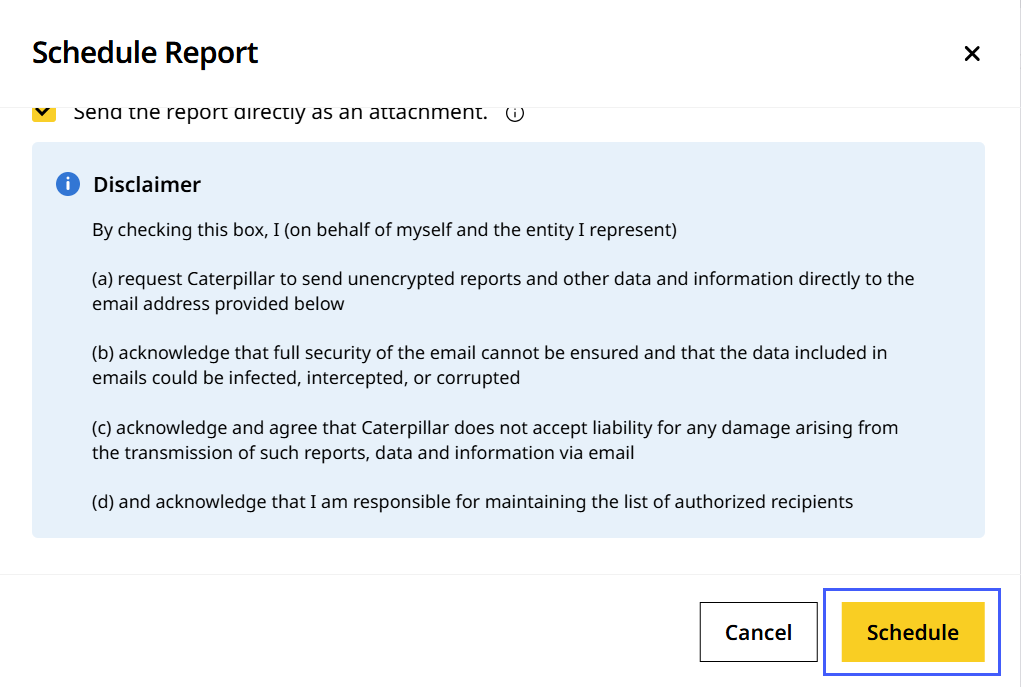
Select check
Send the report directly as an attachment. if you want to just share the report for instant download.
• This option is applicable only if the attachment has a file size of less than 10MB.
• By checking the box, you are agreeing to certain terms and conditions regarding the report. Read through the Disclaimer text given below the option.
-
-
Click Schedule to save the details and schedule the report.
Once scheduled, you can find this Safety Summary Report on Reports like any other report, in the order they were scheduled.
To edit, copy or download a Safety Summary Report, refer to Manage Reports: More Options.
Based on available data, the report displays the following metrics in KPI cards, chart, tabular and map format:
-
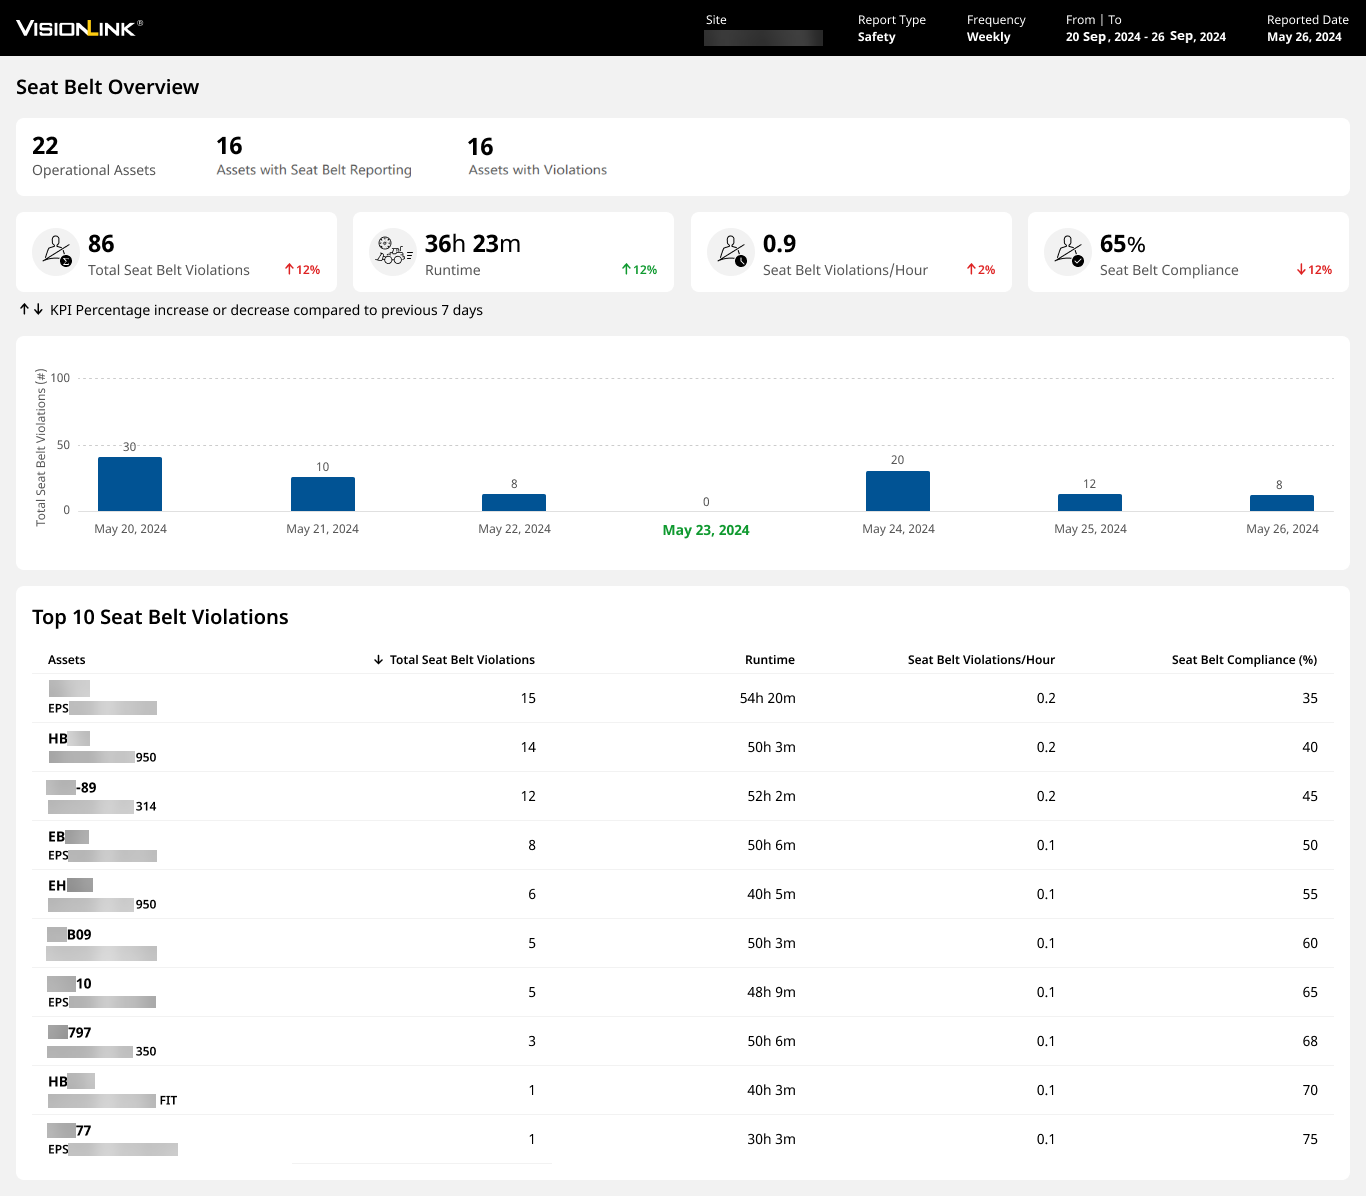
Seat belt metrics overview
Not all assets operating in the site will support seat belt event reporting. The Assets with Seat Belt Reporting metric provides a count of supported assets for that site out of the total operational assets for the selected date range. -
Seat belt KPI card information
-
Hourly/daily/weekly total seat belt violation trend
-
Top 10 assets with the largest seat belt violation count
-
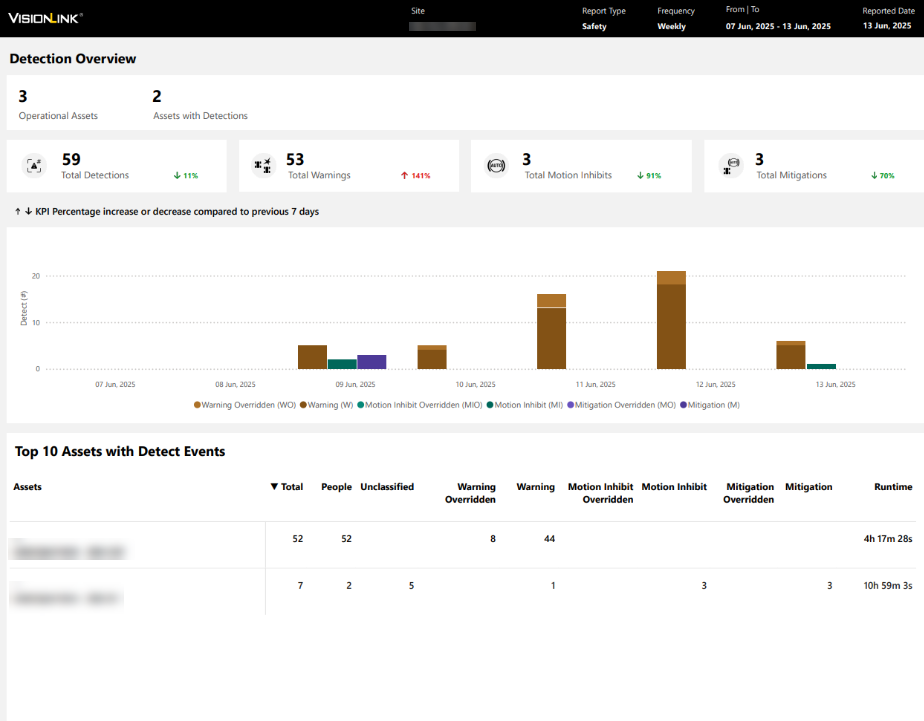
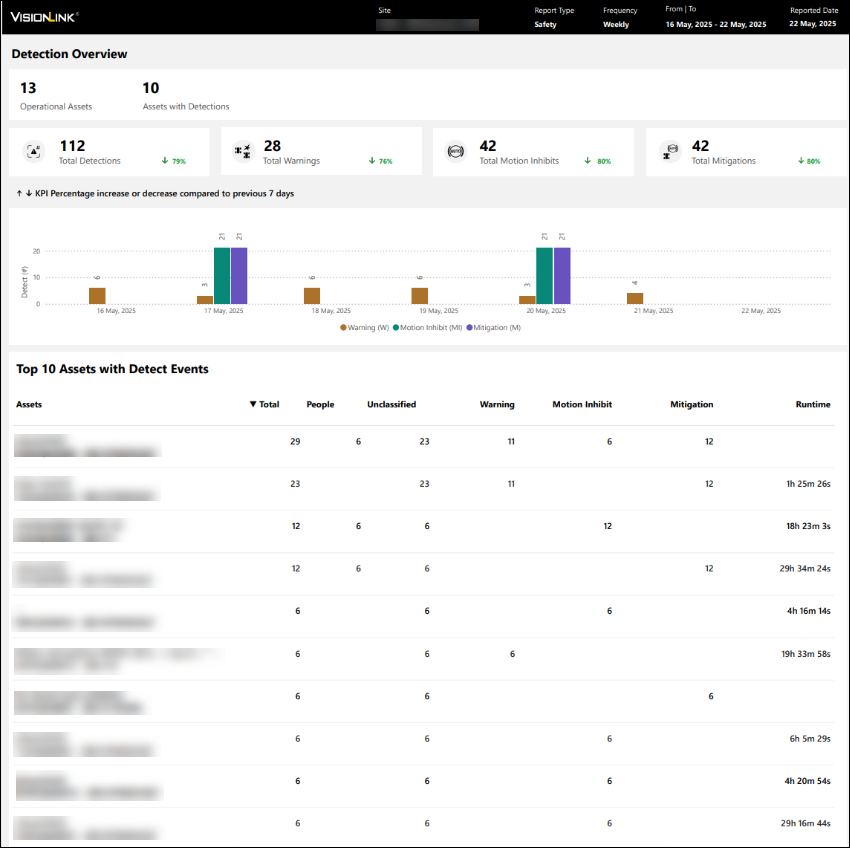
Detection metrics overview
-
Detection KPI card information
-
Hourly/daily/weekly total detections trend
-
Top 10 assets with the largest detect event count
-
Safety map showing all seat belt and detect events with legend
-
Safety events overview and tabular data for each asset
-
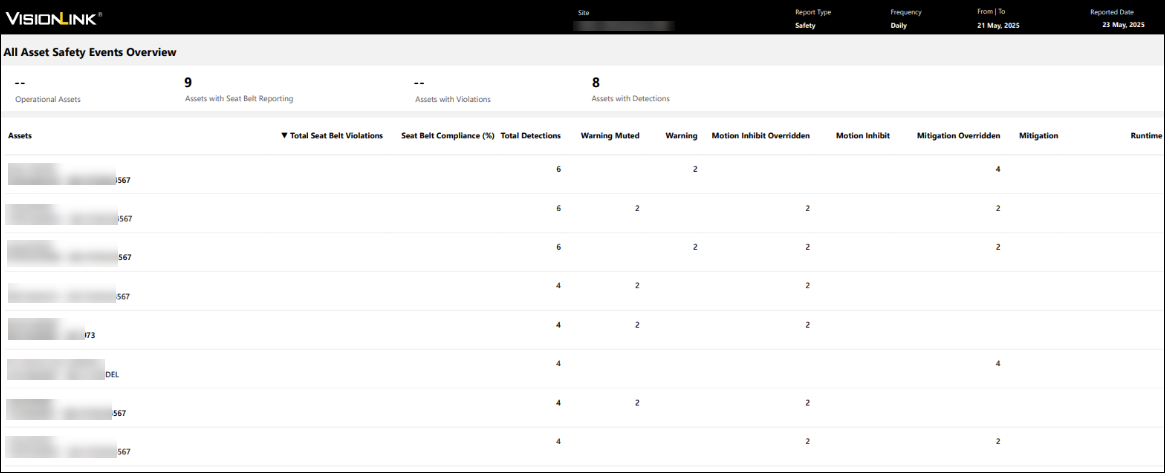
All asset safety events overview and details table listing seat belt and detect action counts for each asset in the site
This is how a sample report page looks like:
-
Seat belt section
-
Detect section
-
Default report
-
Report after excluding overridden events
-
-
All asset safety events section