- + jobsite
- acceptable use policy
- account
- add user
- android
- answer
- april 2020
- archive
- asset tags
- assets
- assign schedule
- august 2020
- august 2021
- august 2022
- Average
- body up switch
- browser
- carbon footprint
- card error
- change KPI
- chrome
- CO2 emitted
- cookie
- copy site
- copyright
- cost kpi
- cost setup
- cost tab
- create
- currency
- custom list
- cut/fill
- dashboard
- december 2019
- december 2020
- december 2021
- delete site
- delete user
- digital offering
- dollar
- edit site
- edit targets
- edit user
- euro
- exemption
- FAQ
- favorite
- february 2020
- fill/dump
- filter
- firefox
- fleet
- frequently asked questions
- geofence
- getting started
- grid
- guide
- help
- ID
- insights reports
- introduction
- ios
- january 2020
- january 2021
- january 2022
- july 2020
- june 2022
- KPI
- KPI hierarchy
- landing page
- legal
- list
- list summary views
- load site
- login
- logout
- machine
- map tab
- march 2021
- march 2022
- material
- material list
- may 2020
- may 2021
- may 2022
- measurement
- more option
- november 2021
- october 2020
- october 2021
- october 2022
- overview
- playback view
- policy
- preferences
- primary KPI
- production tab
- productivity
- productivity insights
- question
- remove site
- renminbi
- report management
- report type
- restore site
- review
- safari
- schedule
- select assets
- september 2020
- set name and location
- shift
- shift comparison report
- step 1
- step 2
- step 3
- step 4
- step 5
- stockpile
- summary tab
- support
- telematics
- total cost
- user
- visionlink
- walkthrough
- zones
Summary (Insights) Report
Summary (Insights) report displays an offline copy, listing a broad summary view of all vital asset KPIs and metrics in tabular form.
You can access Summary (Insights) report from the following pages:
-
On Summary (Insights), select download
to access broad summary data in detail for selected parameters.
-
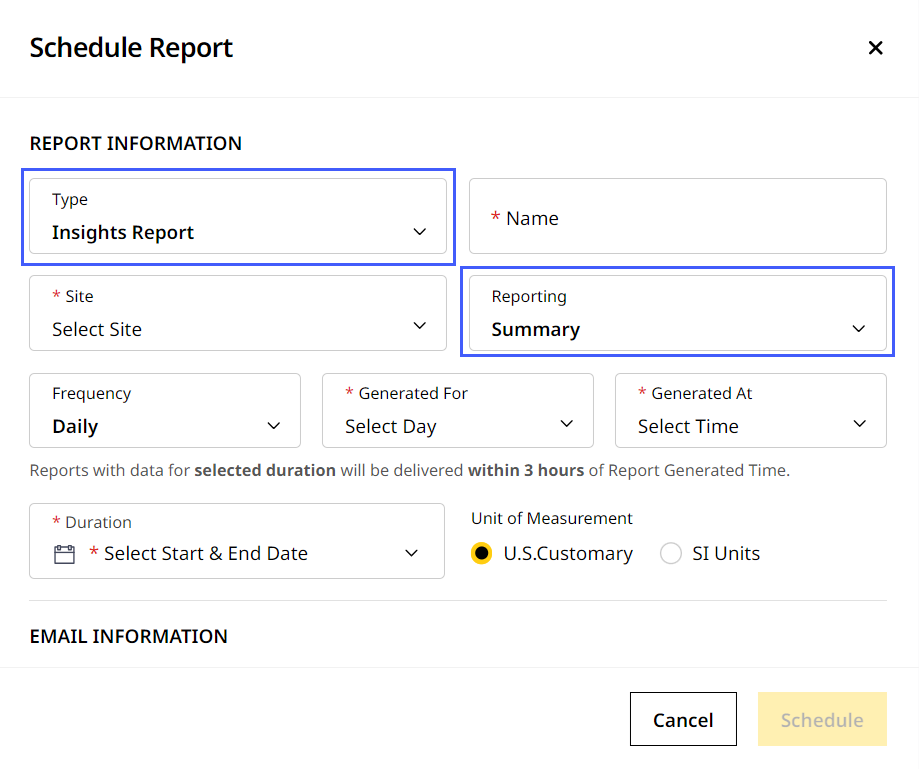
Select Type as Insights Report and Reporting as Summary. For information on filling in the remaining fields, refer to Insights Report (CSV).
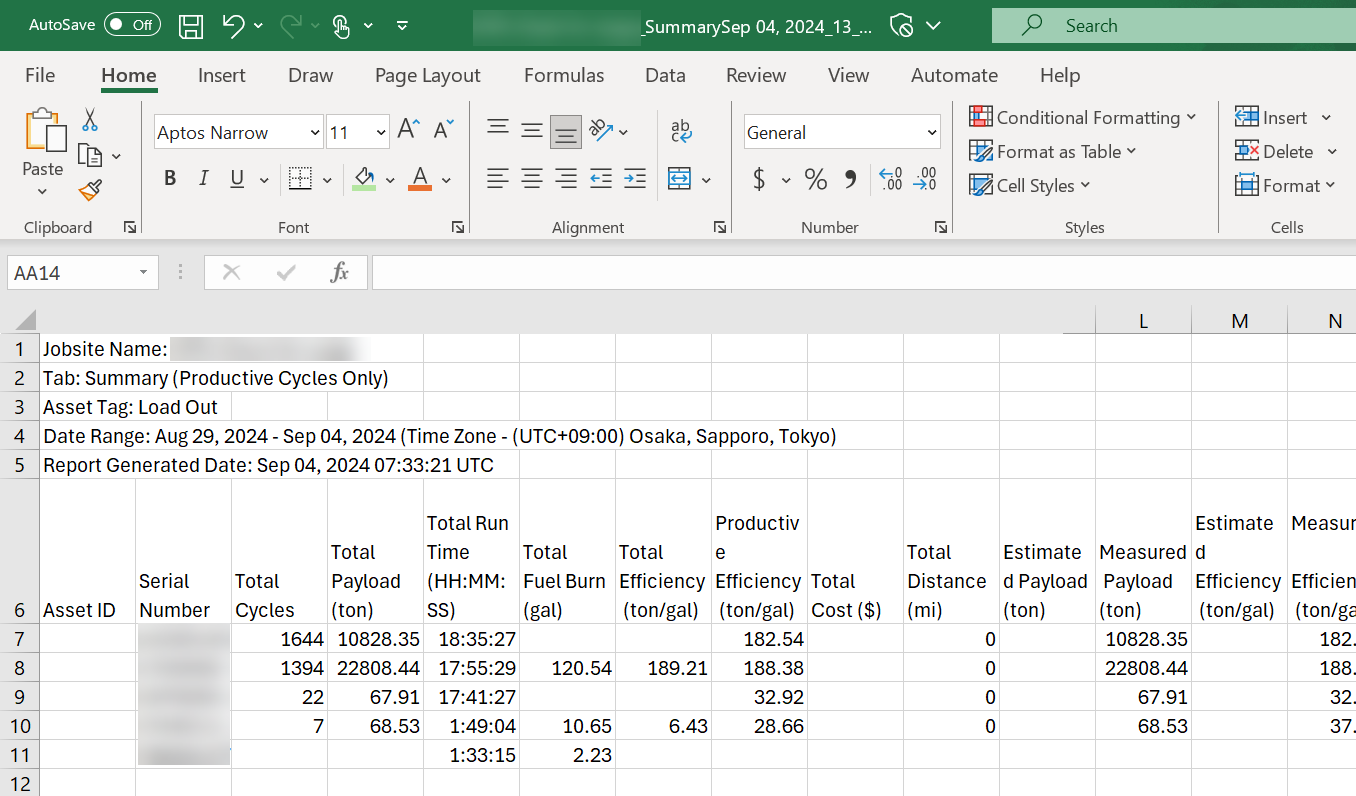
Based on available data, the report displays the following metrics in tabular format:
-
Date and time
-
Total asset count
-
Asset ID
-
Serial number
-
Total cycles count
-
Total payload
-
Total runtime
-
Total fuel burned
-
Total efficiency
-
Productive efficiency
-
Total cost
-
Total distance
-
Estimated payload
-
Measured payload
-
Estimated efficiency
-
Measured efficiency
-
Total idle time
-
Long idle time
-
Total working time
-
Average cycle time
-
Total working fuel burned
-
Total idle fuel burned
-
Fuel burn rate
-
Make
-
Model
-
Cycles per hour
-
Payload per hour
-
Payload per cycle
-
Cost per cycle
-
Cost per payload
-
Cost per hour
-
Fuel cost
-
Operating cost
-
Working cost
-
Idle cost
-
CO2/Carbon emitted
Here is a sample Summary (Insights) report (as a .csv file):