Custom Report

Custom Reports will replace Shift Summary and Runtime Reports. To know how to schedule custom reports with either data set, refer to:
• Configuring Shift Summary Data Using Custom Reports
• Configuring Runtime Data Using Custom Reports
Use Custom Report to create a tailor-made report, suited to your specific needs. Choose required asset tags (Hauler - Load & Haul, Loader - Load & Haul, Scraper, Load Out and Support), different data sets, and even specific shifts and time periods. It reports a site’s production and utilization data for the selected date range as a .pdf file.
If shifts are available and selected, custom reports are sent three hours from shift end time. Otherwise, it is sent as a daily report.
You can choose the required Sections to be displayed (as its own page) in the report:
-
Selecting this section provides an overview of all major KPIs related to your selected asset tags. This information will be available in a chart or KPI card format.
This is how a sample report page looks like:

Based on available data, this report section displays the following key metrics:
-
Total hauler/load out/scraper payload
-
Total hauler/load out/scraper cycles
-
Overall utilization
-
Hauler volume/hour
-
Average hauler/loader/load out/scraper cycle time
-
Hauler/loader/load out/scraper utilization
-
-
Load/Cycle CountLoad/Cycle Count
Selecting this section provides load/cycle count information related to your selected asset tag(s). This information will be available in a chart or matrix table format.
This is how a sample report page looks like:

Based on available data, this report section displays the following key metrics:
-
Hauler/load out/scraper cycle count per hour
-
Loader load count per hour
-
Hauler/loader assets' cycle count
-
Hauler/loader/load out/scraper zone-wise cycle count
-
-
Selecting this section provides payload-related metrics for your selected asset tag(s). This information will be available in a chart or matrix table format.
This is how a sample report page looks like:
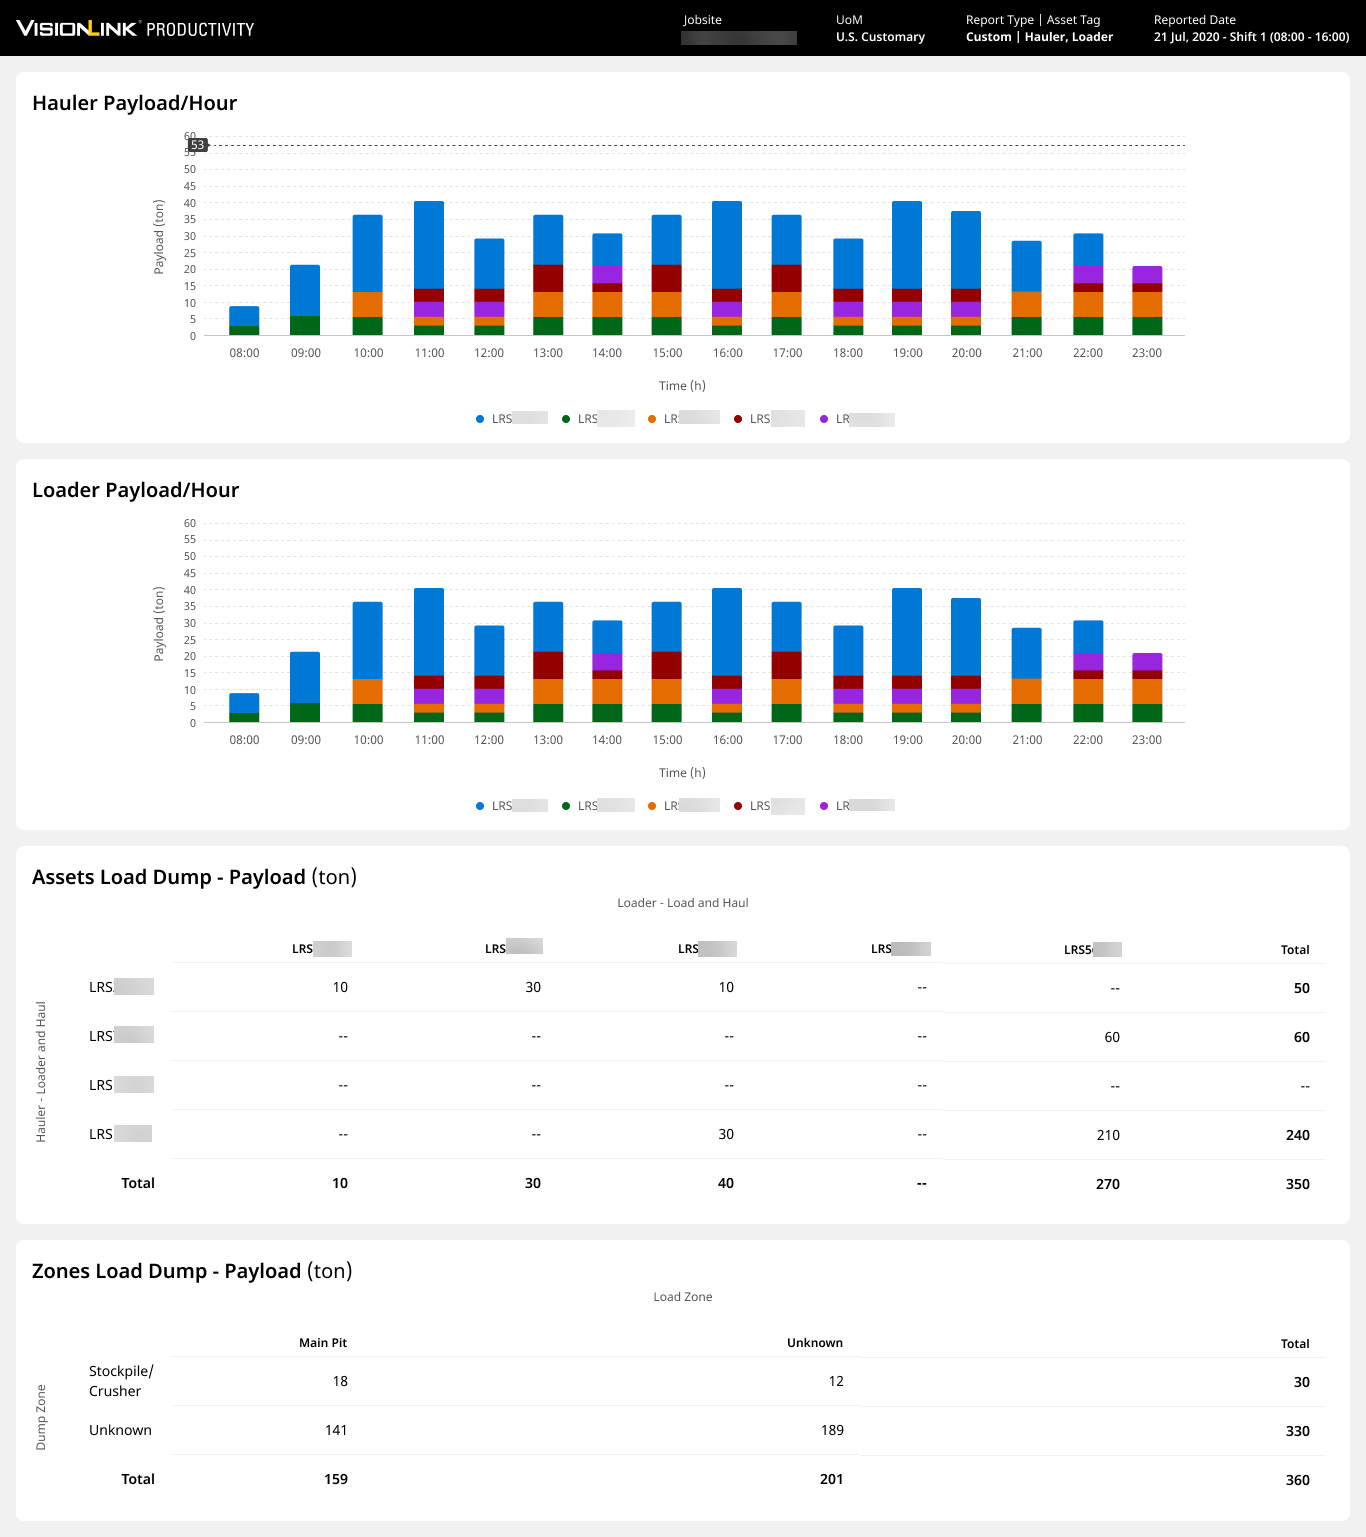
Based on available data, this report section displays the following key metrics:
-
Hauler/loader/load out/scraper payload per hour
-
Hauler/loader asset-wise payload load dump
-
Hauler/loader zone-wise payload load dump
-
Load out/scraper material-wise payload summary
-
Load out/scraper truck-wise payload summary
-
Load out/scraper zone-wise payload summary
-
-
Selecting this section provides volume metrics for your selected asset tag(s). This information will be available in a chart or matrix table format.
This is how a sample report page looks like:
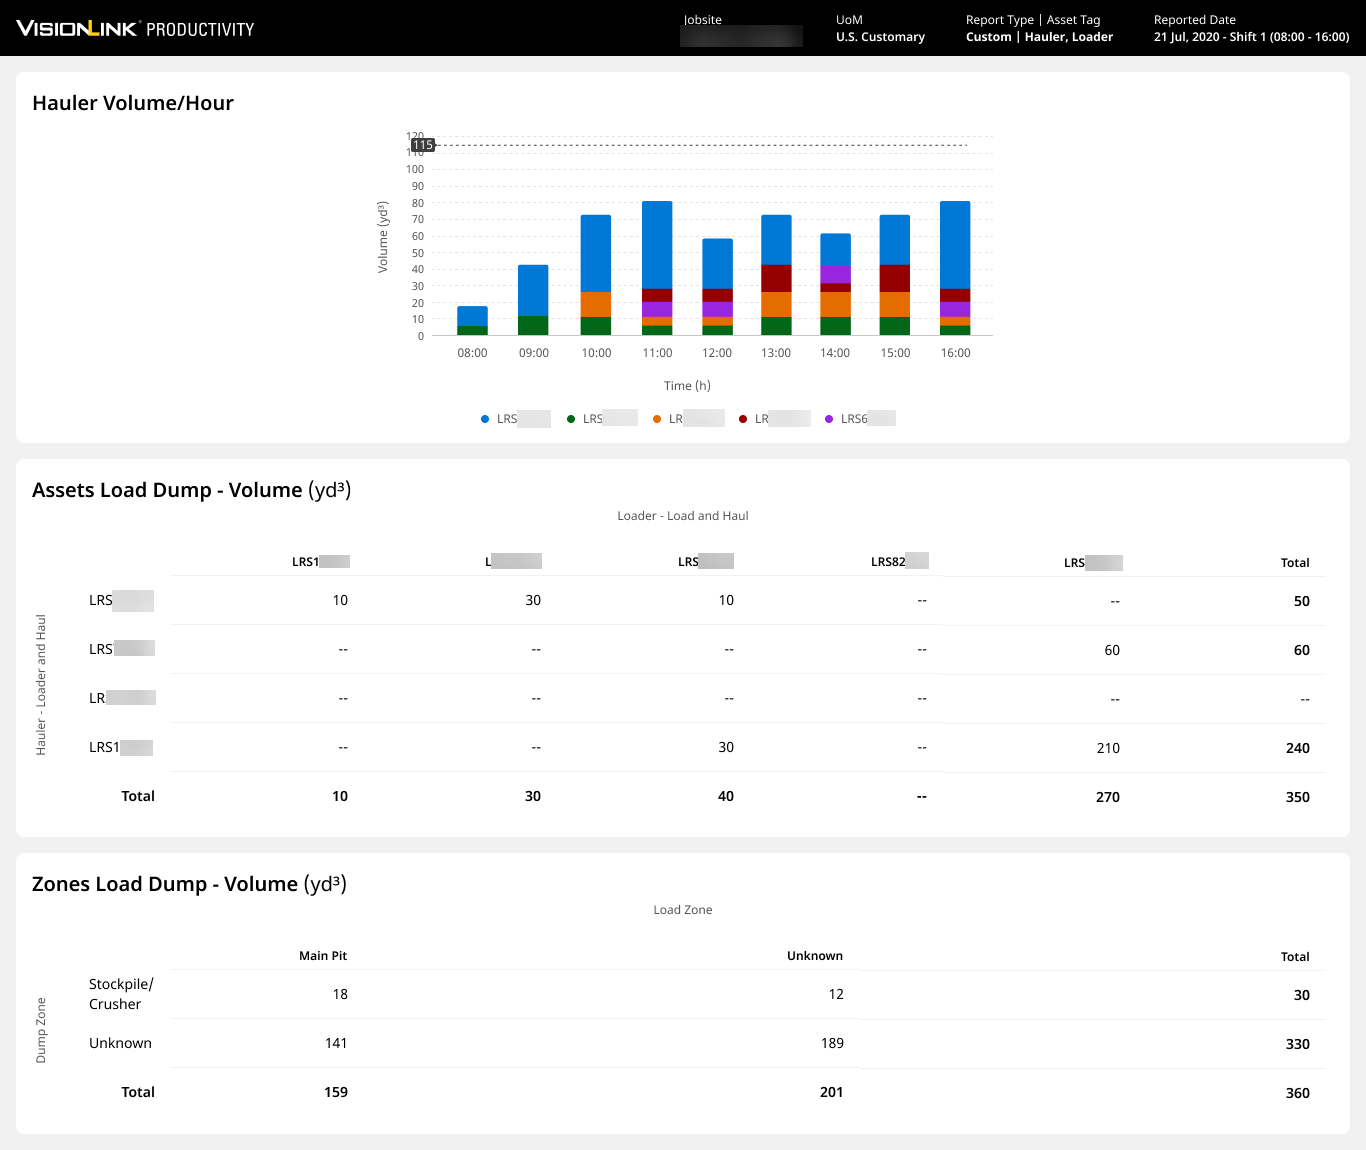
Based on available data, this report section displays the following key metrics:
-
Hauler volume/hour
-
Hauler/loader asset-wise payload load dump
-
Hauler/loader zone-wise payload load dump
-
-
Productivity MapProductivity Map
Selecting this section provides a map-wise display of productivity data related to your selected asset tag(s). This information will be available as a map image with highlighted hotspots in relevant, distinct colors.
This is how a sample report page looks like:
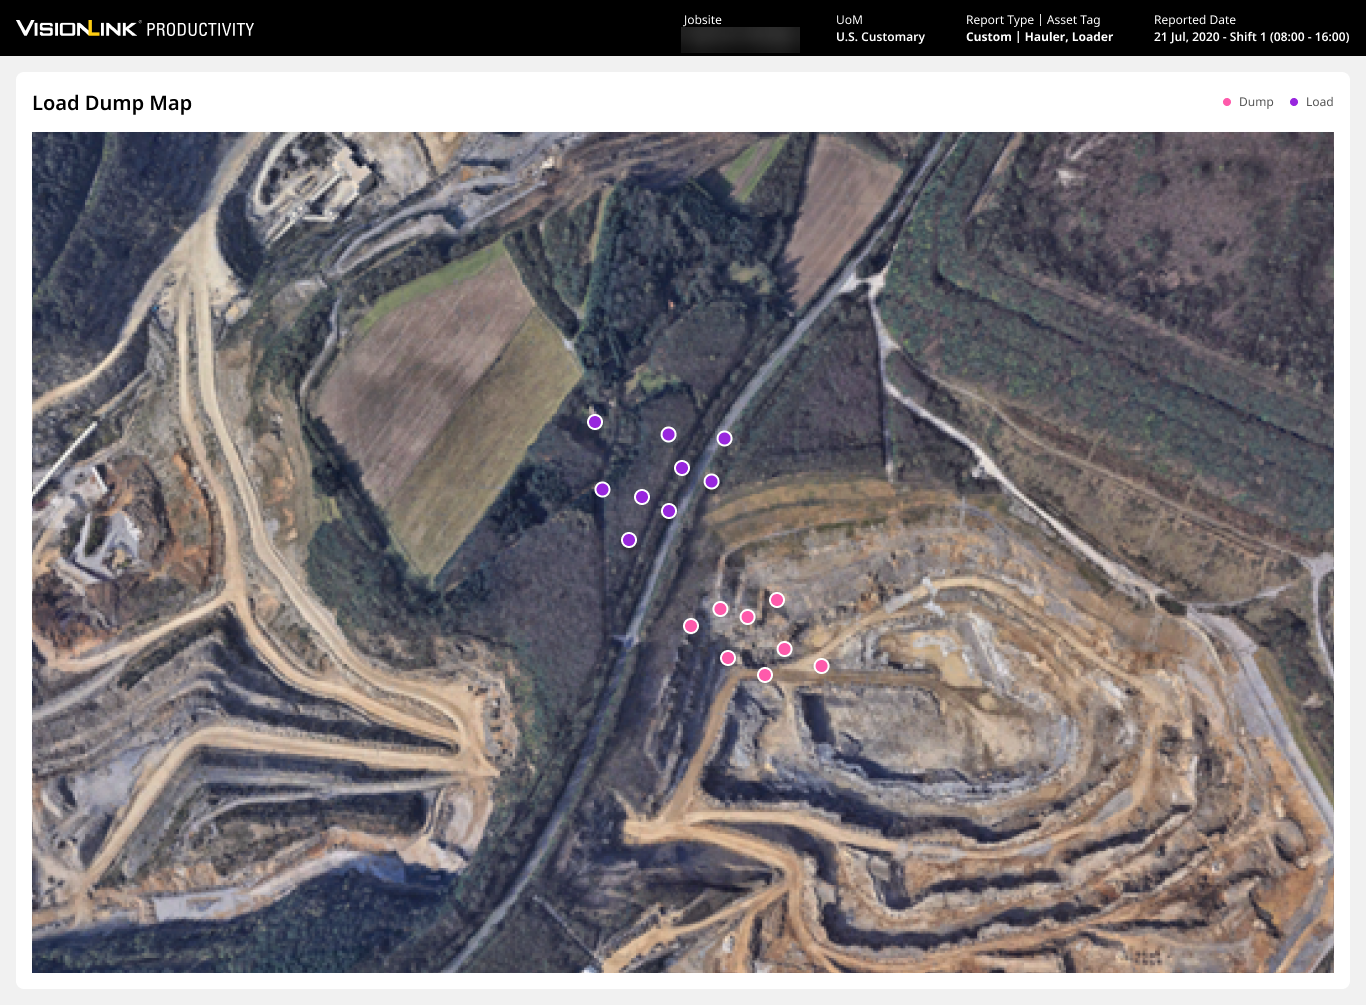
Based on available data, this report section displays the following key metrics:
-
Load and dump events (map-wise)
-
-
Utilization MapUtilization Map
Selecting this section provides a map-wise display of utilization data related to your selected asset tag(s). This information will be available as a map image with highlighted hotspots in relevant, distinct colors.
This is how a sample report page looks like:

Based on available data, this report section displays the following key metrics:
-
Medium and long idle events (map-wise)
-
-
Selecting this section provides runtime data (working, idle, etc.) related to your selected asset tag(s). This information will be available as a time-based tabular chart.
This is how a sample report page looks like:
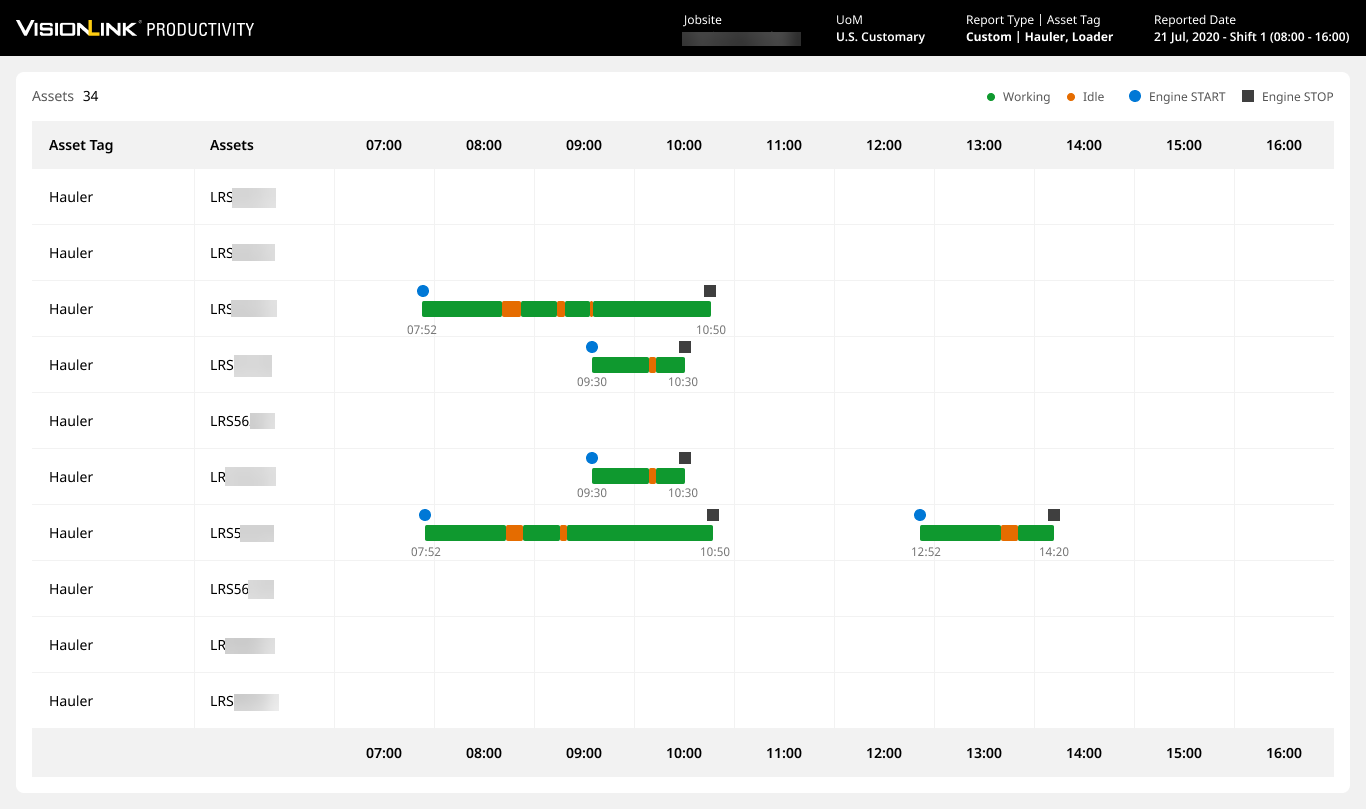
Based on available data, this report section displays the following key metrics:
-
Working time data
-
Idle time data
-
Start engine time data
-
Stop engine time data
-
-
Selecting this section provides utilization-related metrics of your selected asset tag(s). This information will be available in a tabular format.
This is how a sample report page looks like:
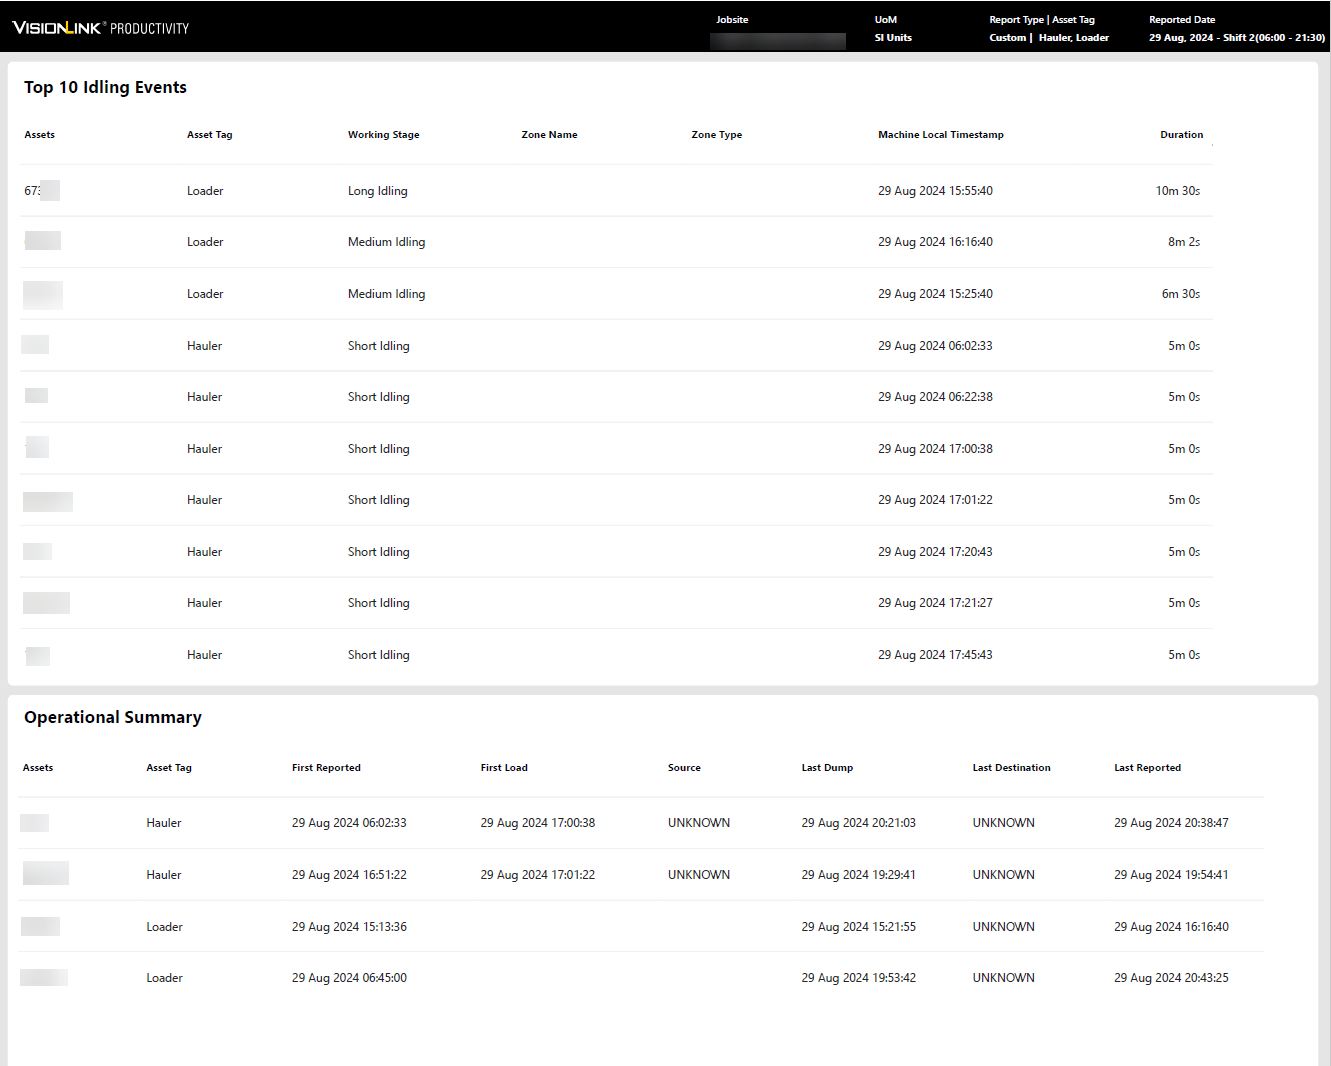
Based on available data, this report section displays the following key metrics:
-
Top 10 idling events
-
Operational summary
-
-
Selecting this section details out all operational metrics for your selected asset tag(s). This information will be available in a tabular format.
This is how a sample report page looks like:
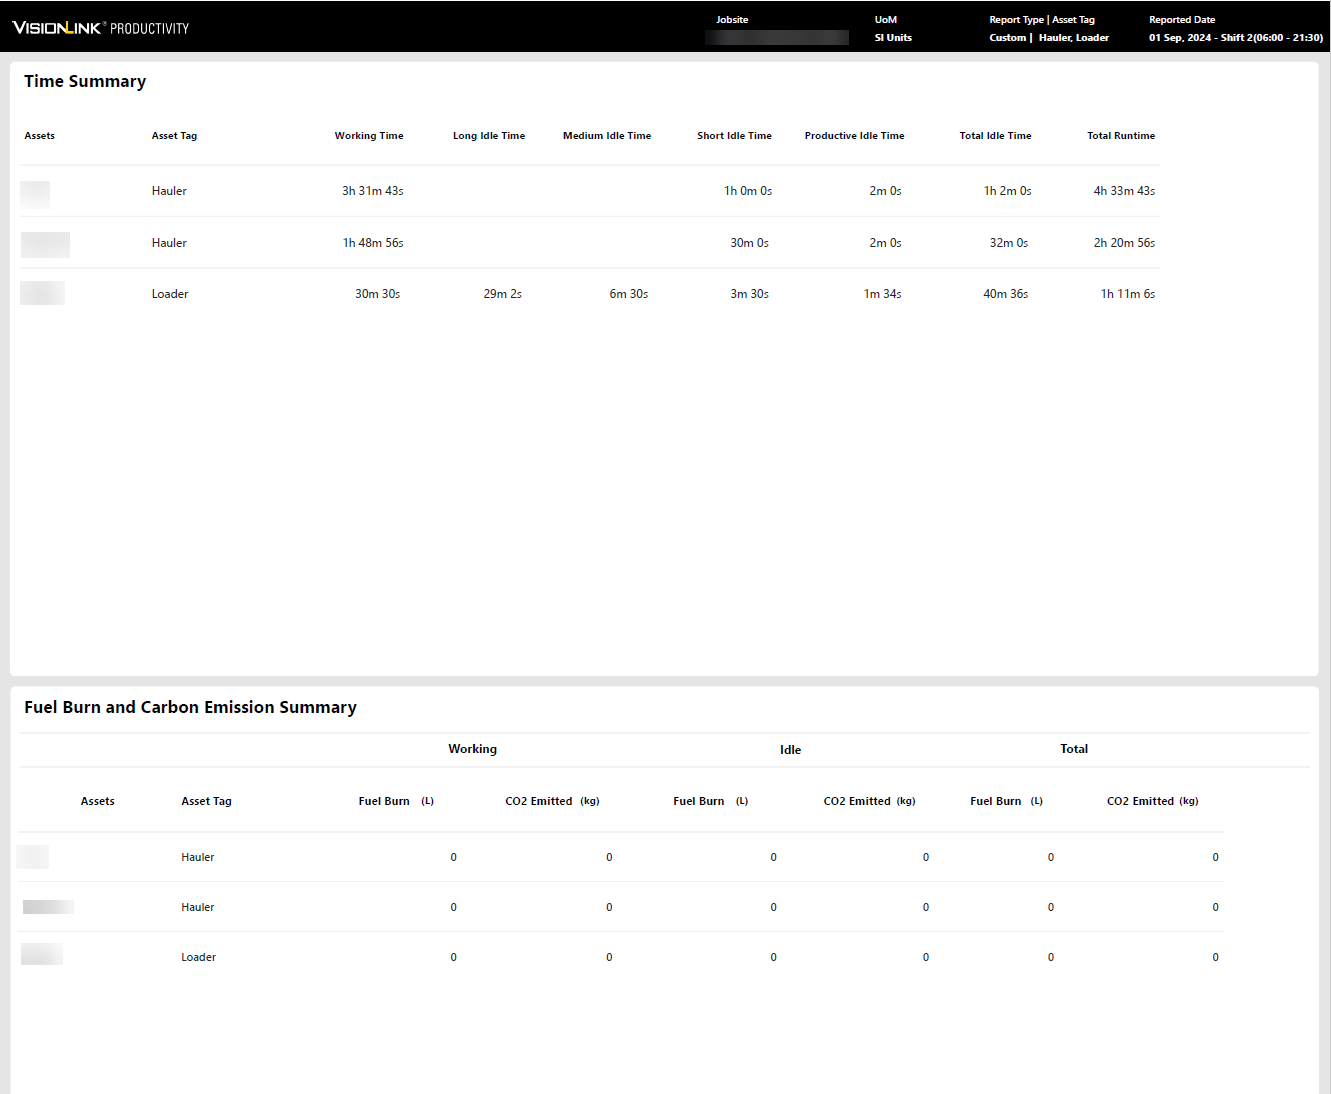
Based on available data, this report section displays the following key metrics:
-
Time summary
-
Fuel burn and carbon emission summary
-
• When Support asset tag is selected, only Runtime will be available to select under Sections.
• Grade and Compact asset tags are currently not supported.
Configuring Shift Summary Data Using Custom Reports
You can schedule a customized Custom Report to access all shift data offline to share or further analyze.
This replaces Shift Summary Report.
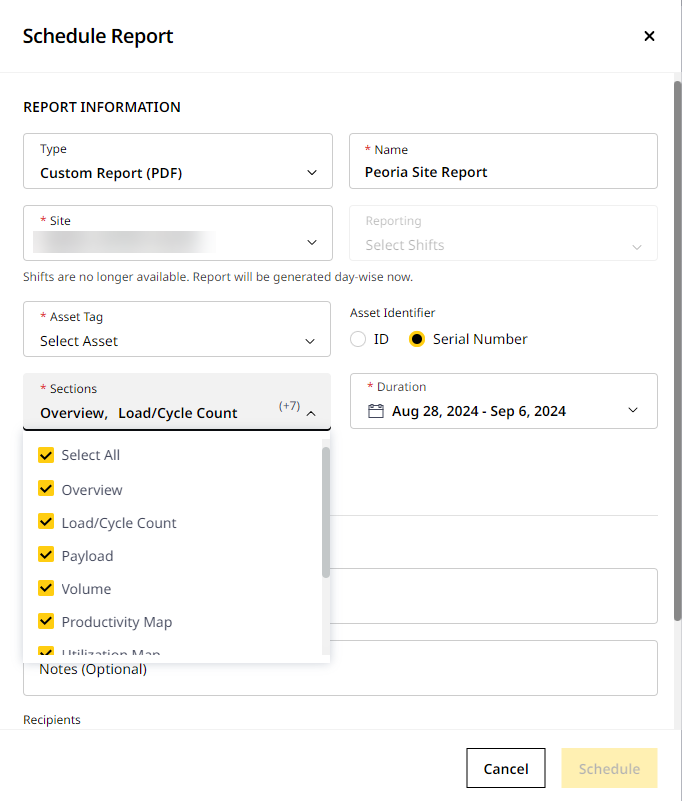
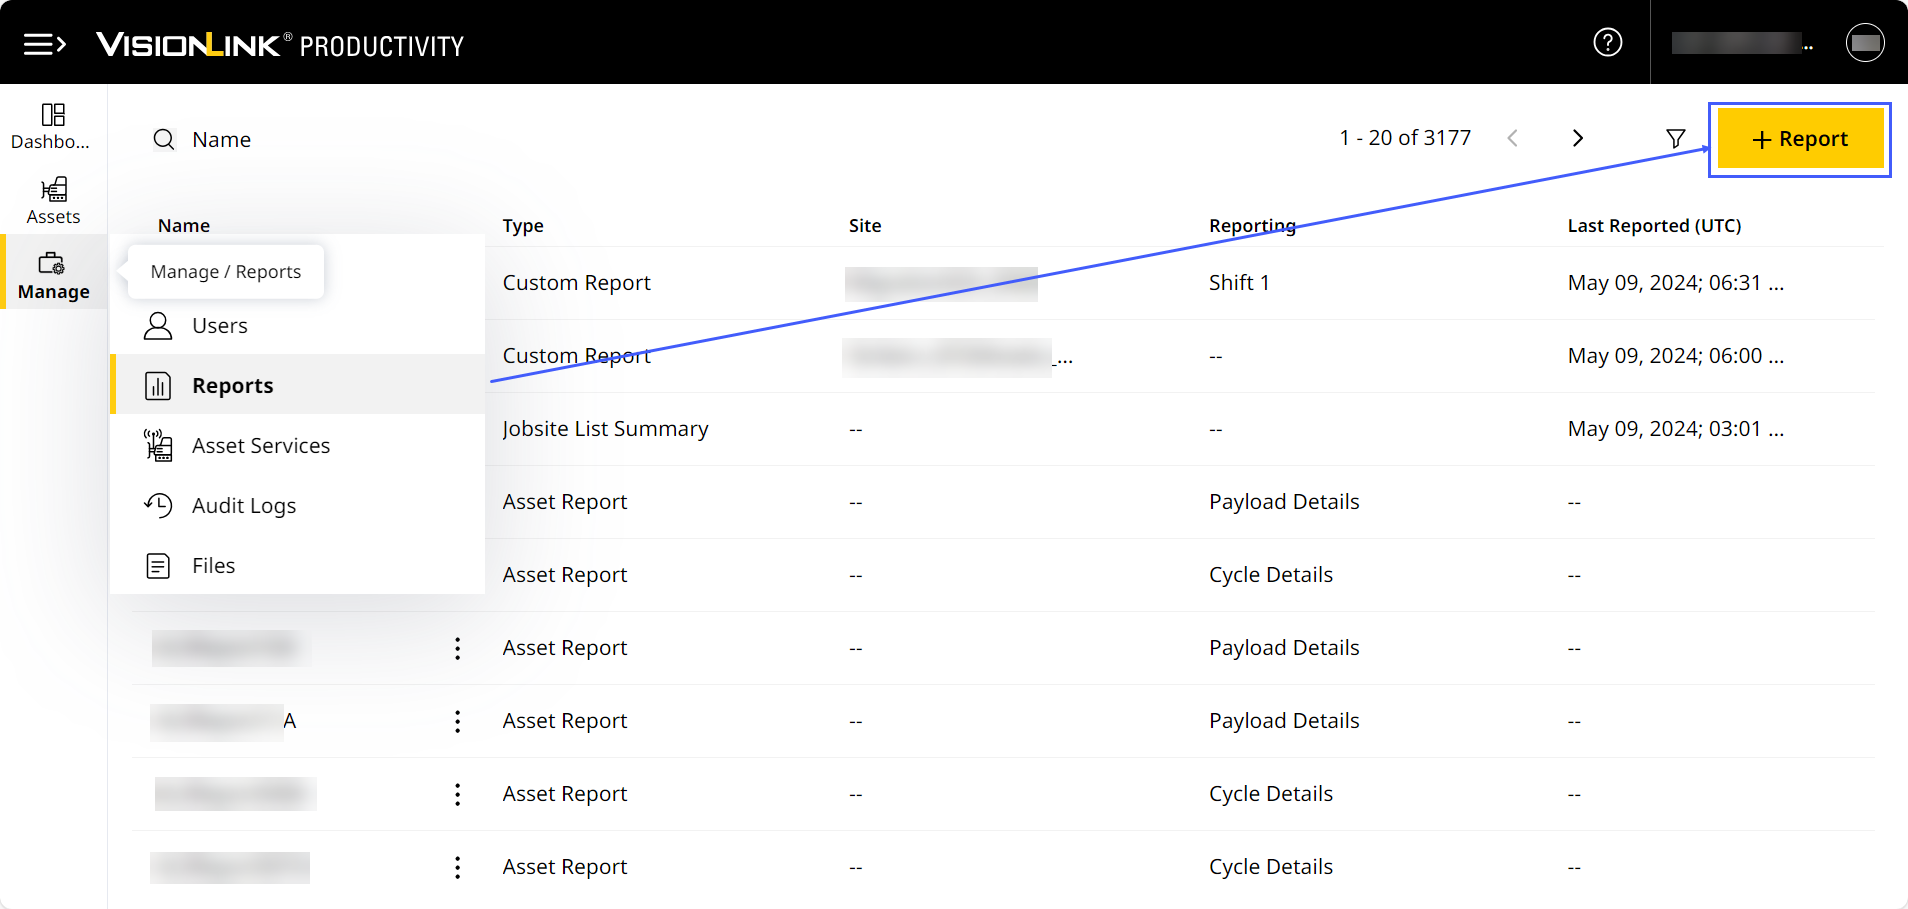
To schedule Custom Report with shift summary data:
-
Click
 .
.
-
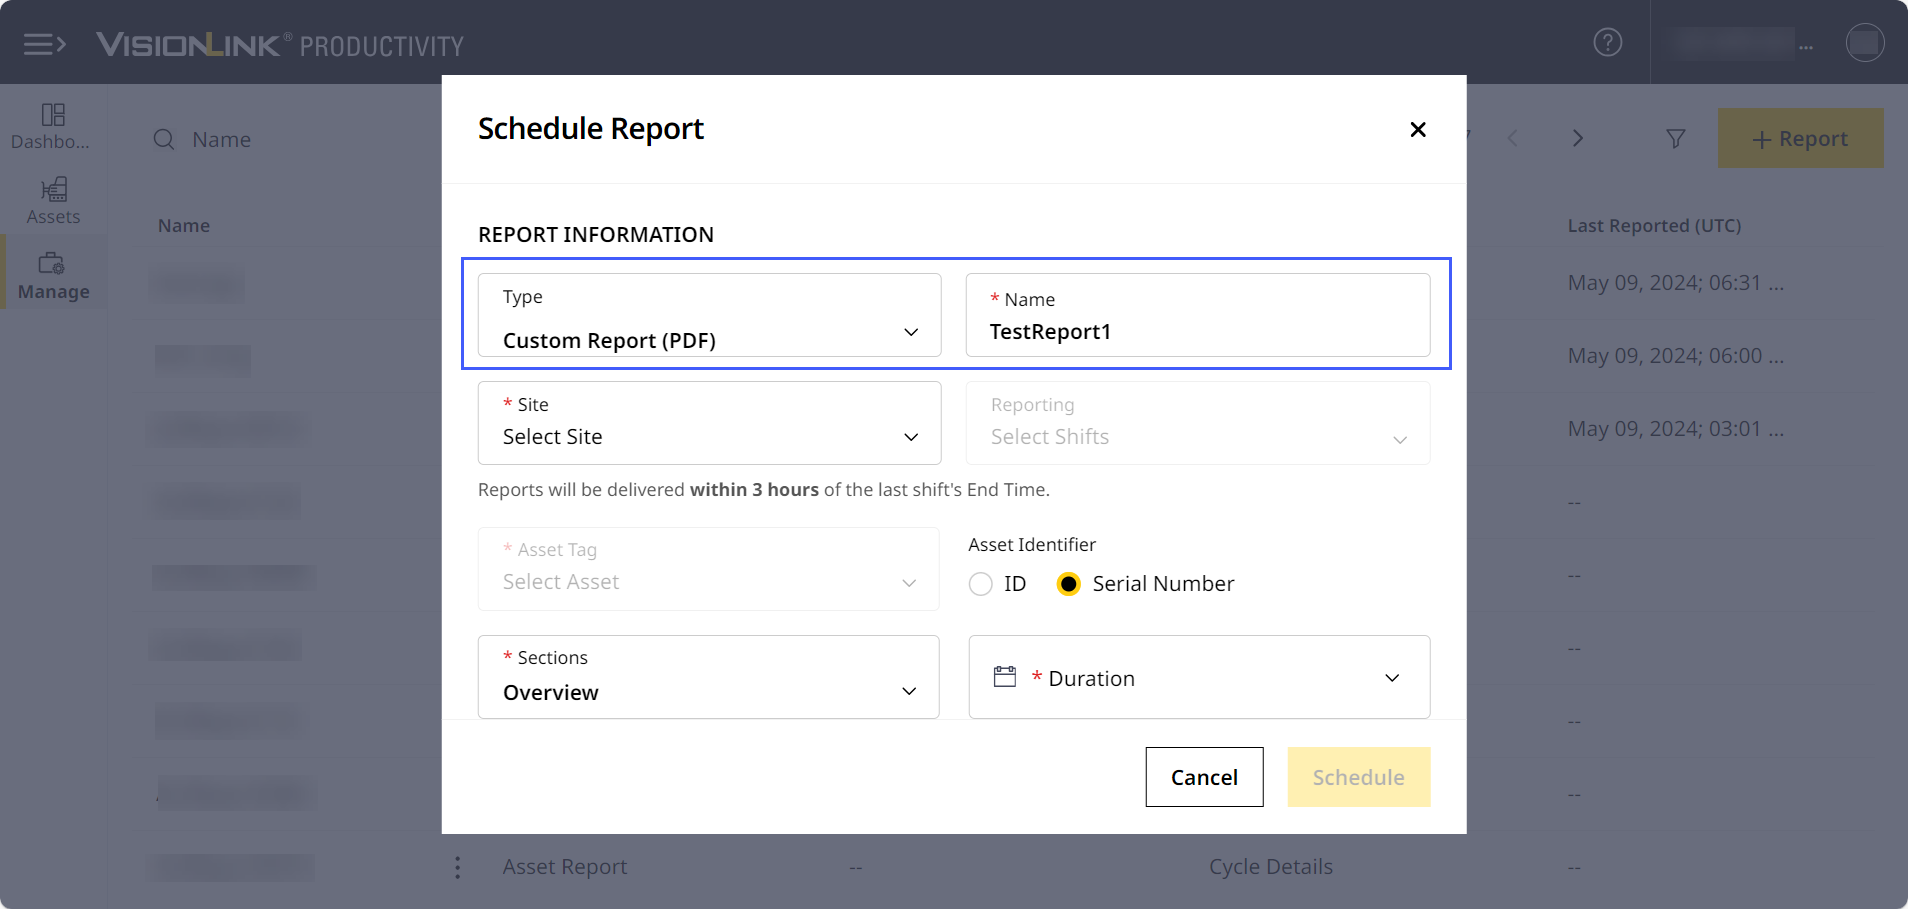
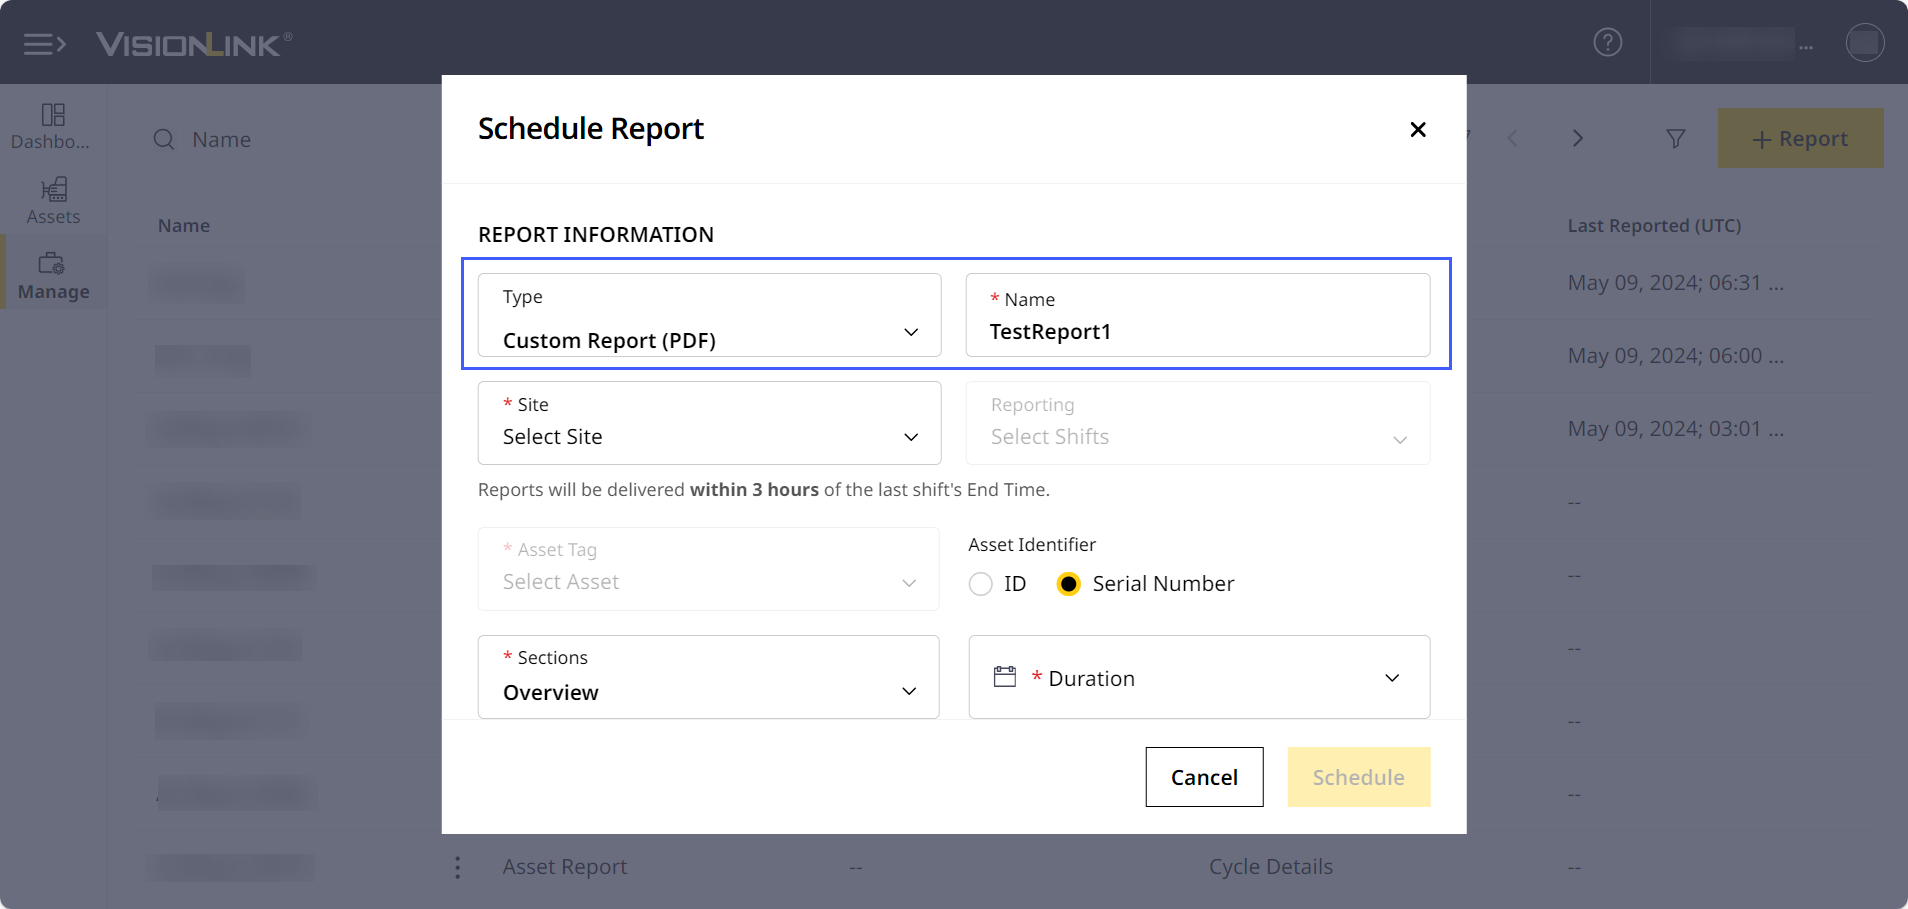
This displays Schedule Report. Under Type, Custom Report will be selected by default.
-
Add Report Name.
-
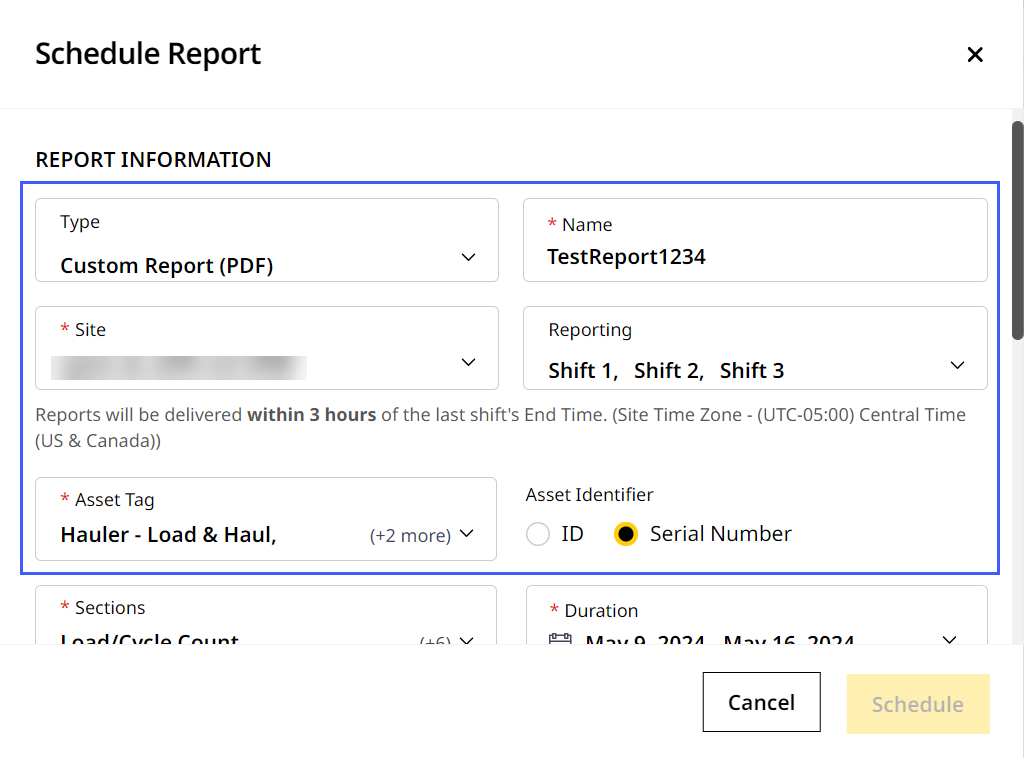
Select a site that supports shifts. This enables the Reporting drop down.
-
Under Shifts, select from Shift 1-3.
-
Choose Asset Tag and Asset Identifier.
-
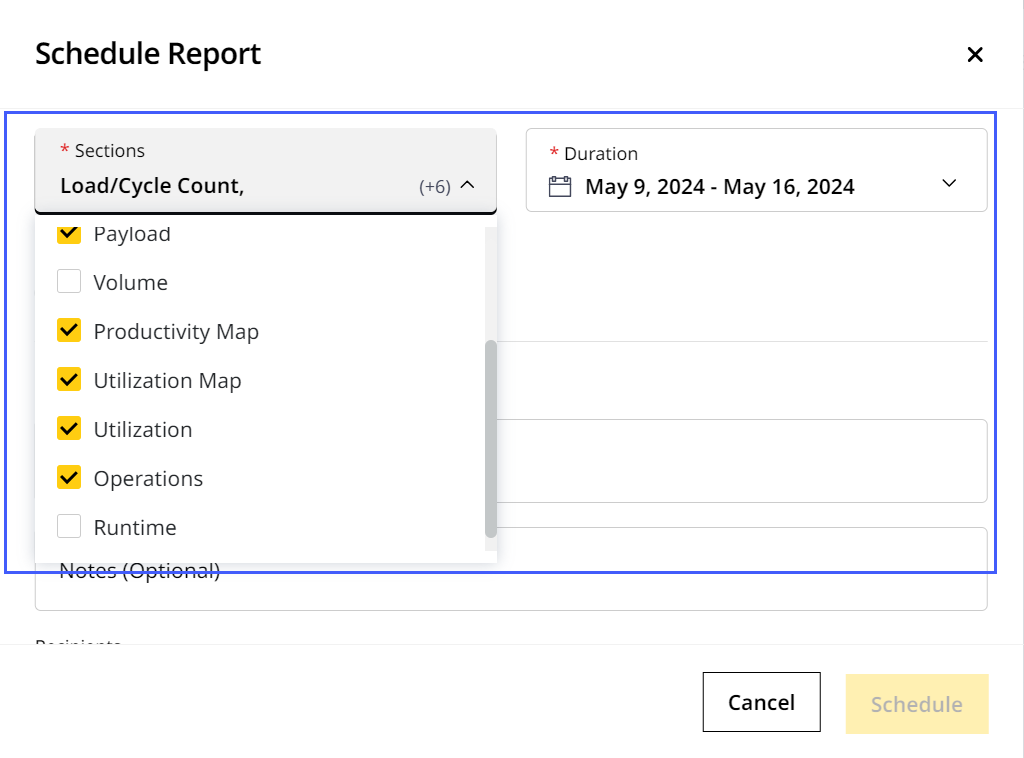
Under Sections, select every option EXCEPT Volume and Runtime.
-
Set Duration as you wish.
-
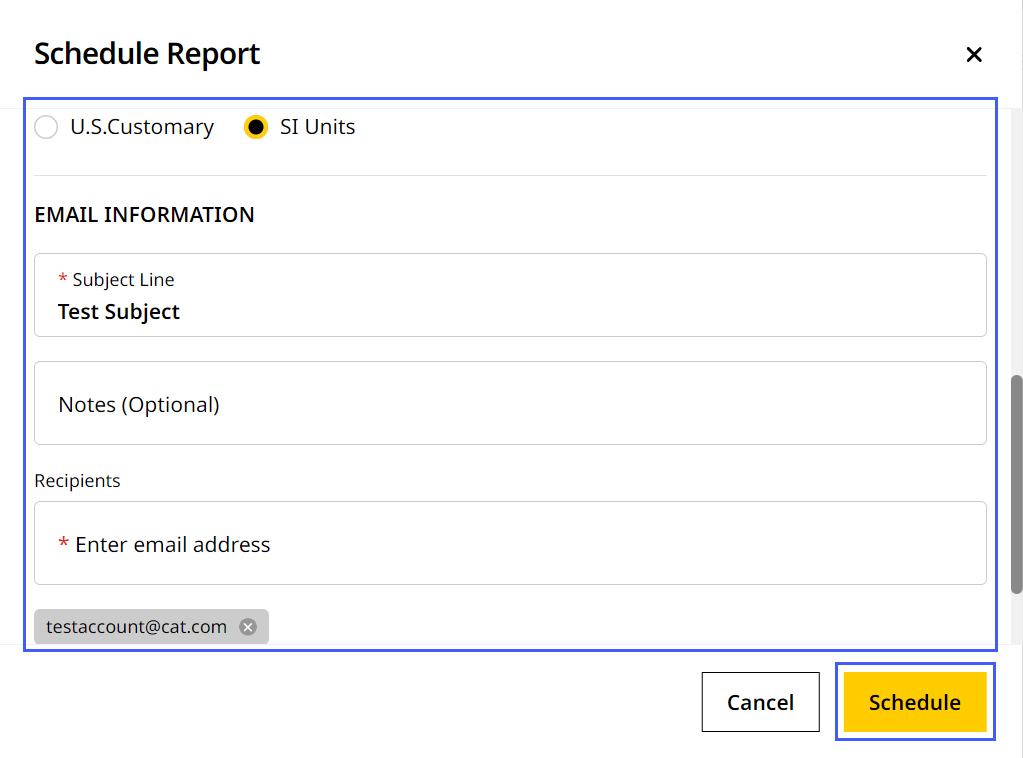
Fill in the remaining details (units of measurement and email information). To know more, refer to Schedule Report.
-
Click Schedule.
You can now access a report with shift summary data containing the following metrics (by asset tag):
-
Hauler and loader:
-
Total hauler payload
-
Total hauler cycles
-
Overall utilization
-
Average hauler cycle time
-
Average loader cycle time
-
Average loader payload (AP Assets)
-
Hauler utilization
-
Loader utilization
-
Hauler cycle count/hour
-
Loader cycle count/hour
-
Load & Haul assets - cycle count
-
Load & Dump zones - cycle count
-
Load dump map
-
Hauler payload/hour
-
Loader payload/hour
-
Assets load dump
-
Zones load dump
-
Top 10 idling events
-
Operational summary
-
Utilization time summary
-
Utilization fuel burn summary
-
-
Load out:
-
Total load out payload
-
Total load out cycles
-
Overall utilization
-
Average load out cycle time
-
Average load out payload
-
Load out utilization
-
Load out cycle count/hour
-
Load & Dump zones - cycle count
-
Load dump map
-
Material ID summary - payload
-
Truck ID summary - payload
-
Zones summary
-
Top 10 idling events
-
Operational summary
-
Utilization time summary
-
Utilization fuel burn summary
-
-
Scraper:
-
Total scraper payload
-
Total scraper cycles
-
Overall utilization
-
Average scraper cycle time
-
Average scraper payload
-
Scraper utilization
-
Scraper cycle count/hour
-
Load & Haul zones - cycle count
-
Load dump map
-
Scraper payload/hour
-
Material ID summary - payload
-
Truck ID summary - payload
-
Zones summary - payload
-
Top 10 idling events
-
Operational summary
-
Utilization time summary
-
Utilization fuel burn summary
-
Configuring Runtime Data Using Custom Reports
You can schedule a customized Custom Report to access all runtime data offline to share or further analyze.
This replaces Runtime Report.
To schedule Custom Report with runtime data:
-
Click
.
-
This displays Schedule Report. Under Type, Custom Report will be selected by default.
-
Add Report Name.
-
Runtime data is available for the following time periods:
-
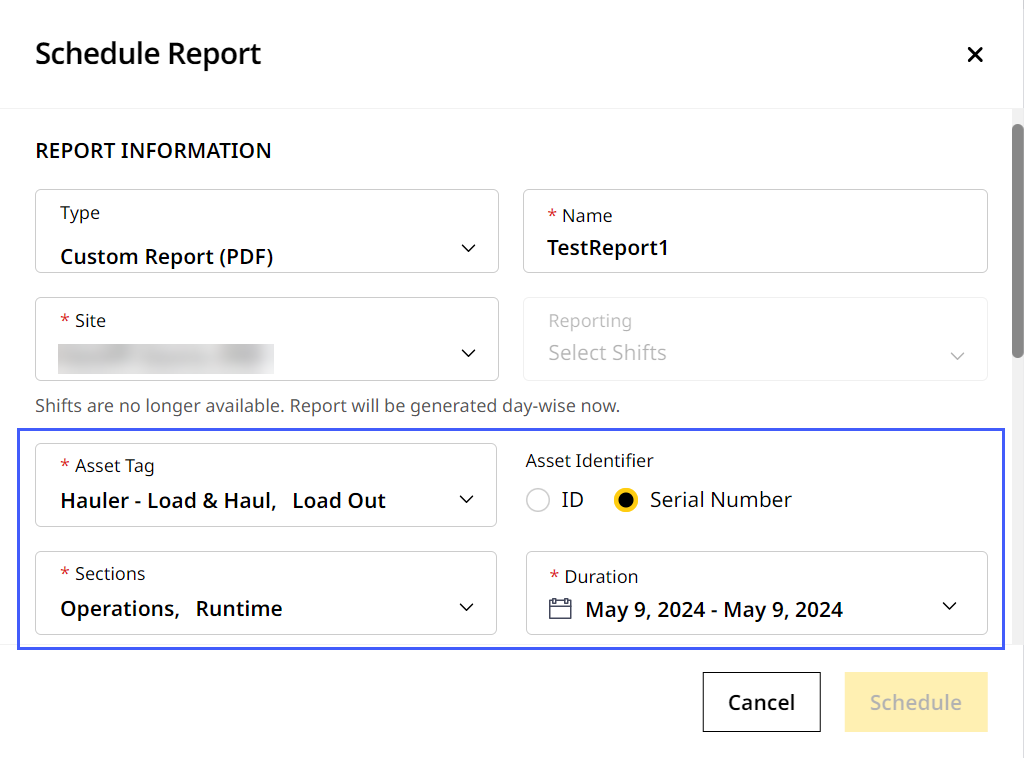
Daily: Select a site that records day-wise data.
-
Choose Asset Tag and Asset Identifier.
-
Under Sections, select Operations and Runtime.
-
Set Duration to a single day of choice.
-
-
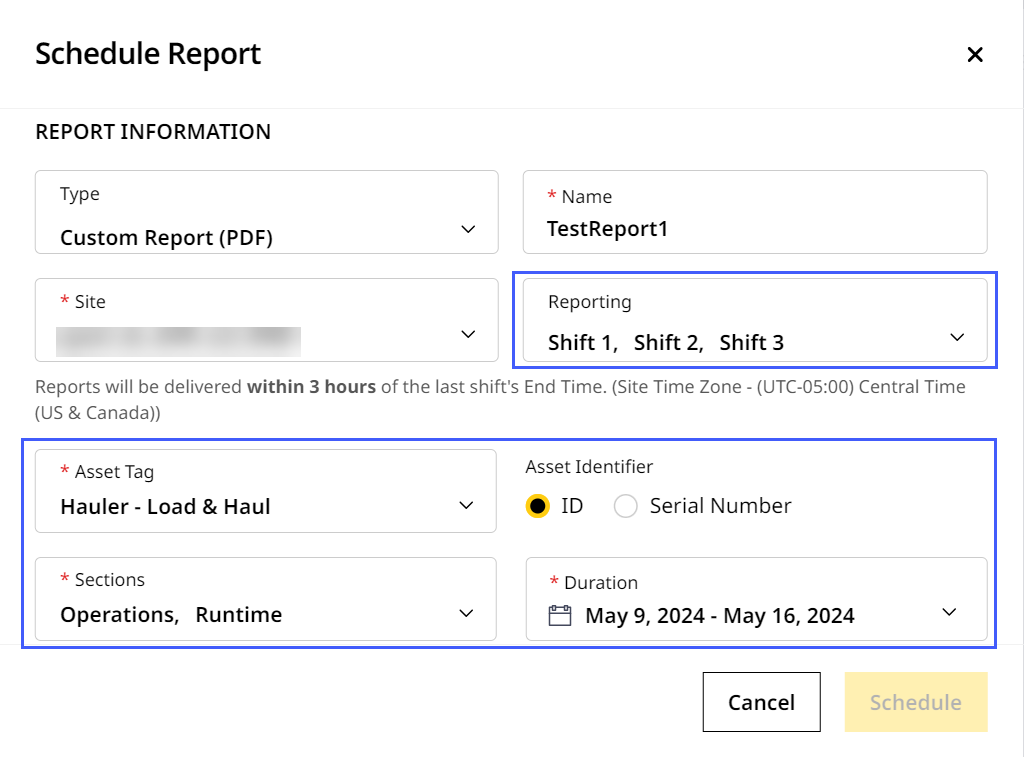
Shifts: Select a site that supports shifts. This enables Reporting drop down.
-
Under Shifts, select from Shift 1-3.
-
Choose Asset Tag and Asset Identifier.
-
Under Sections, select Operations and Runtime.
-
Set Duration as you wish.
-
-
-
Fill in the remaining details (units of measurement and email information). To know more, refer to Schedule Report.
-
Click Schedule.
You can now access a report with runtime data containing the following metrics (by asset type):
-
Shift-wise data
-
Day-wise data
-
Number of assets