Summary View Options on Fleet View
On Fleet View, data is displayed as charts. Based on date selection, either a single day or a date range, the X axis displays hours or days respectively. The data displayed differs based on the KPIs and asset tag selected. The KPI selection options for Fleet View include:
-
Load Count: Number of cycles moved by the assets.
-
Payload: Total weight of materials measured by the assets.
-
Segment: Working and idle hours of the assets.
-
Estimated Volume: Volume of material moved by the assets.
(Click on the KPI name to navigate to respective Fleet View sample.)
-
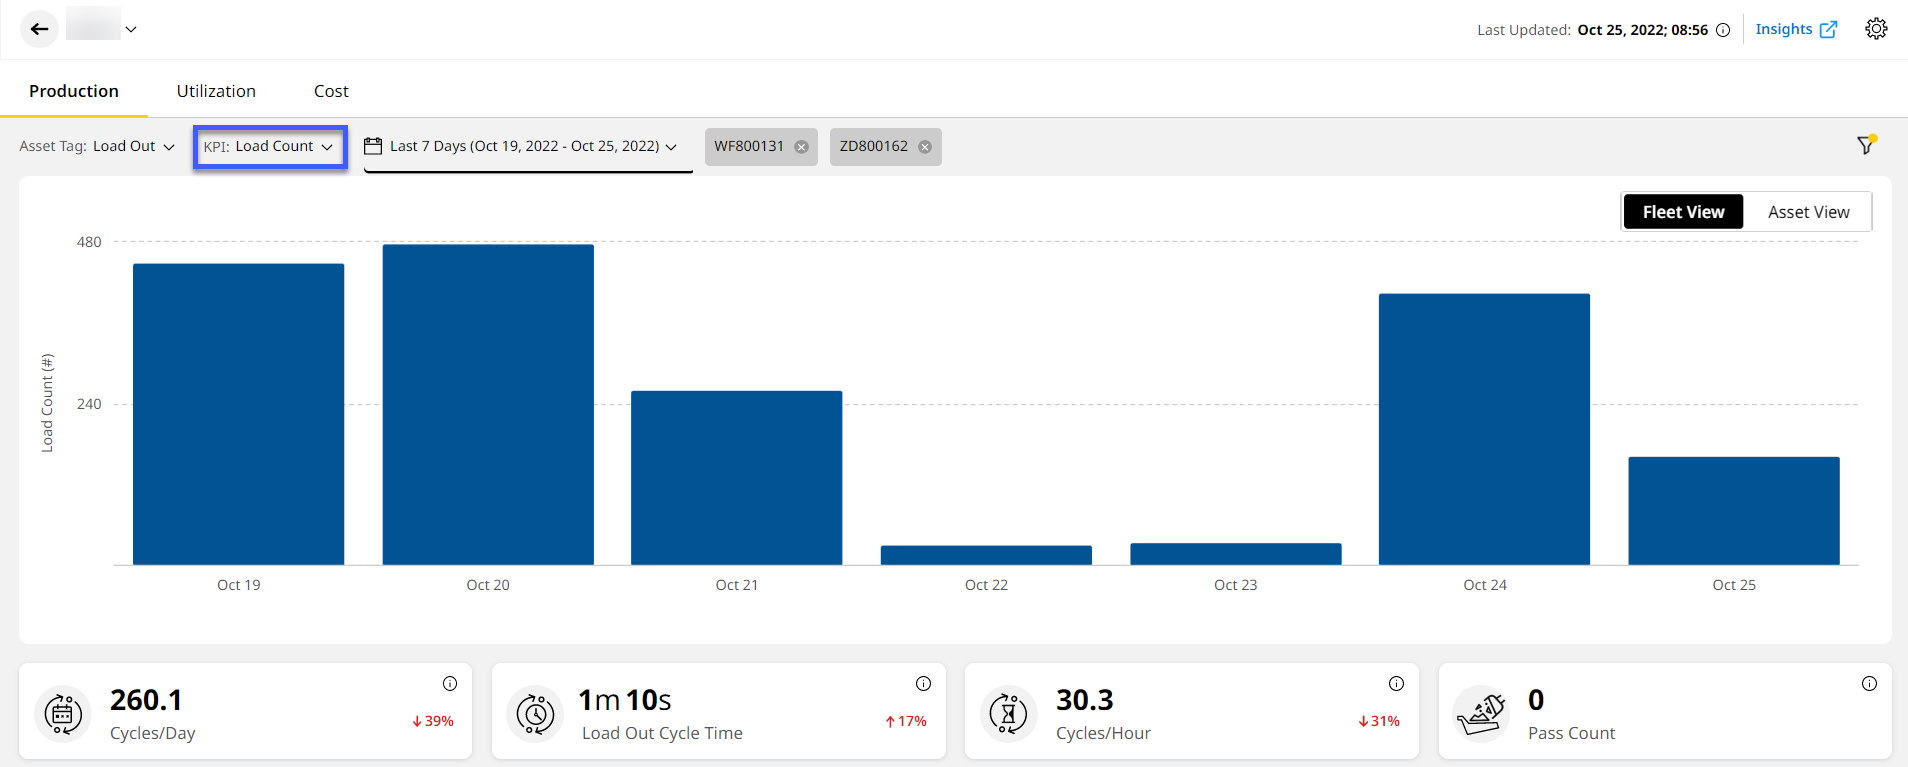
Load Count
On Fleet View, the Load Count chart displays on a daily or hourly basis based on the selection of date range and asset tag. Hover over a bar to view its Total Load Count and the asset’s Load Count for the selected date/time.
-
Payload
Displays the Payload data as a bar graph or histogram on a daily or hourly. Under View, you can select from the following options to display corresponding data:
-
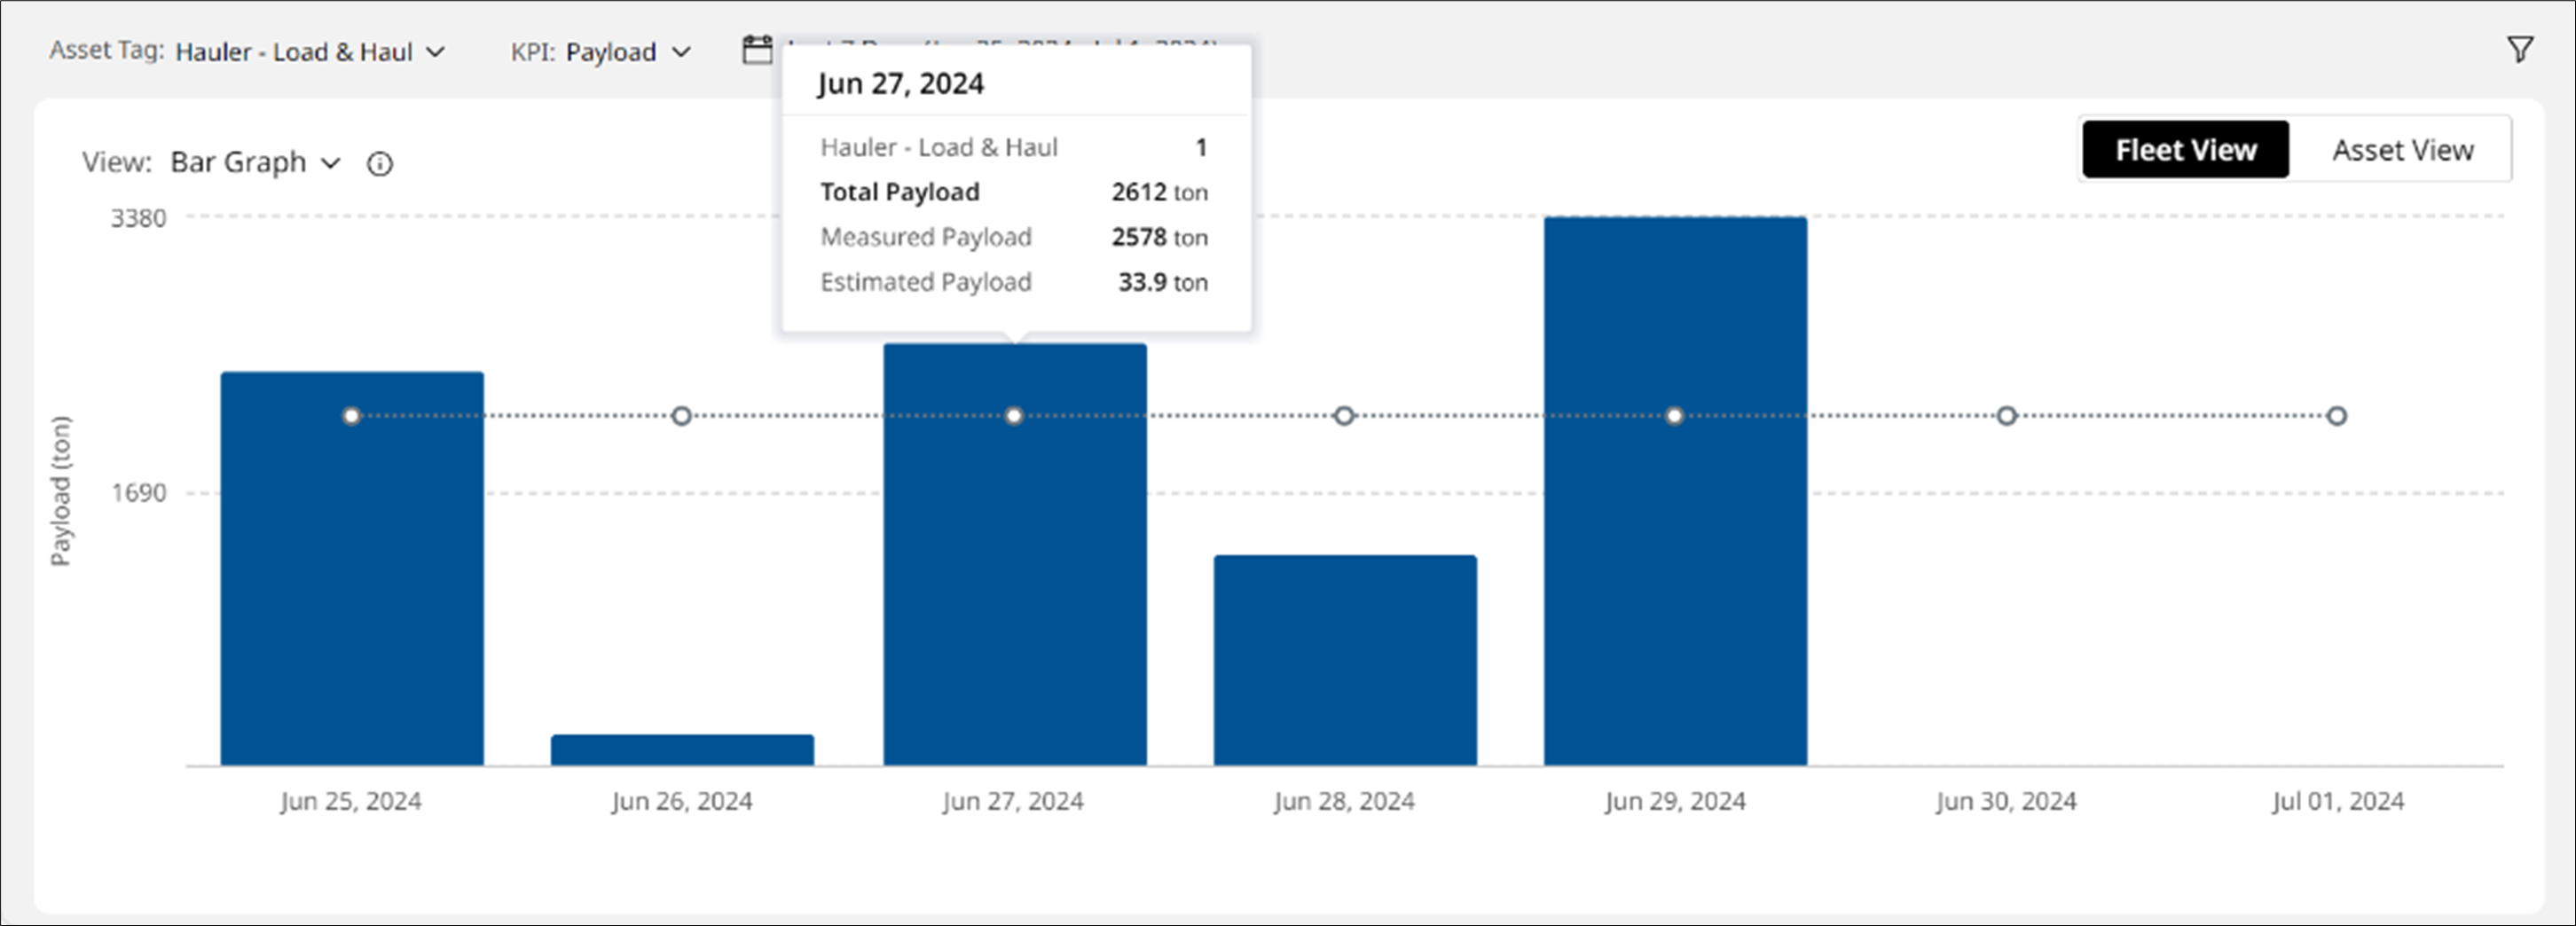
Bar Graph: View payload data for the selected asset tag and date range.
-
The X-axis displays Payload data, and the Y-axis displays the date/time.
-
Hover over a bar to view the Total Payload, Measured Payload, Target Payload and the asset’s Payload for the selected date/time.

-
-
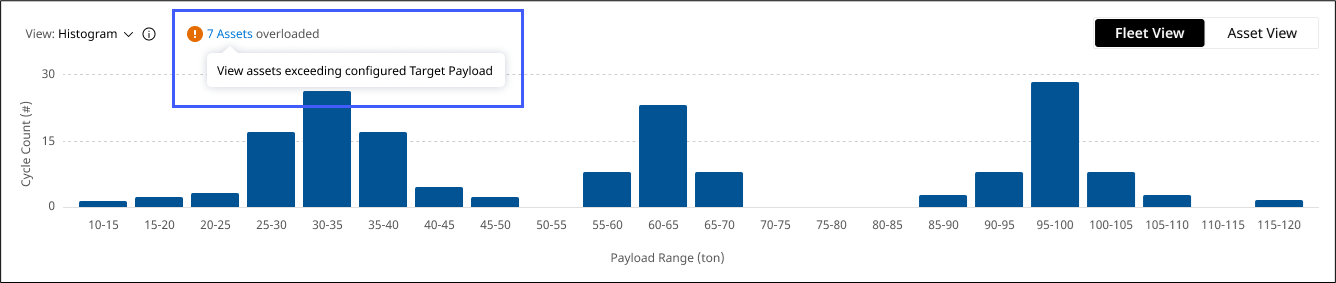
Histogram: View payload data for the site’s assets against their cycle count for selected asset tag and date range. This helps you determine if your assets are at overcapacity or undercapacity and assist in enhancing productivity.

• The histogram data displays only for assets subscribed to Performance with Advanced Productivity/PerformancePro. This subscription provides cycle count data.
• You can view histogram data only for Hauler – Load & Haul, Loader – Load & Haul, Load Out and Scraper asset tags.
• If there are any overloaded assets, their count will appear next to View. You can click on it to identify which assets exceed the specified limit.
View ImageView Image
-
The X-axis displays Payload Range data, and the Y-axis displays Cycle Count.
-
Hover over a bar to view the count of assets falling under the payload range. You can also view the cycle count for that range here.
-
If there are multiple payload ranges available, scroll to the left or right to view them all.
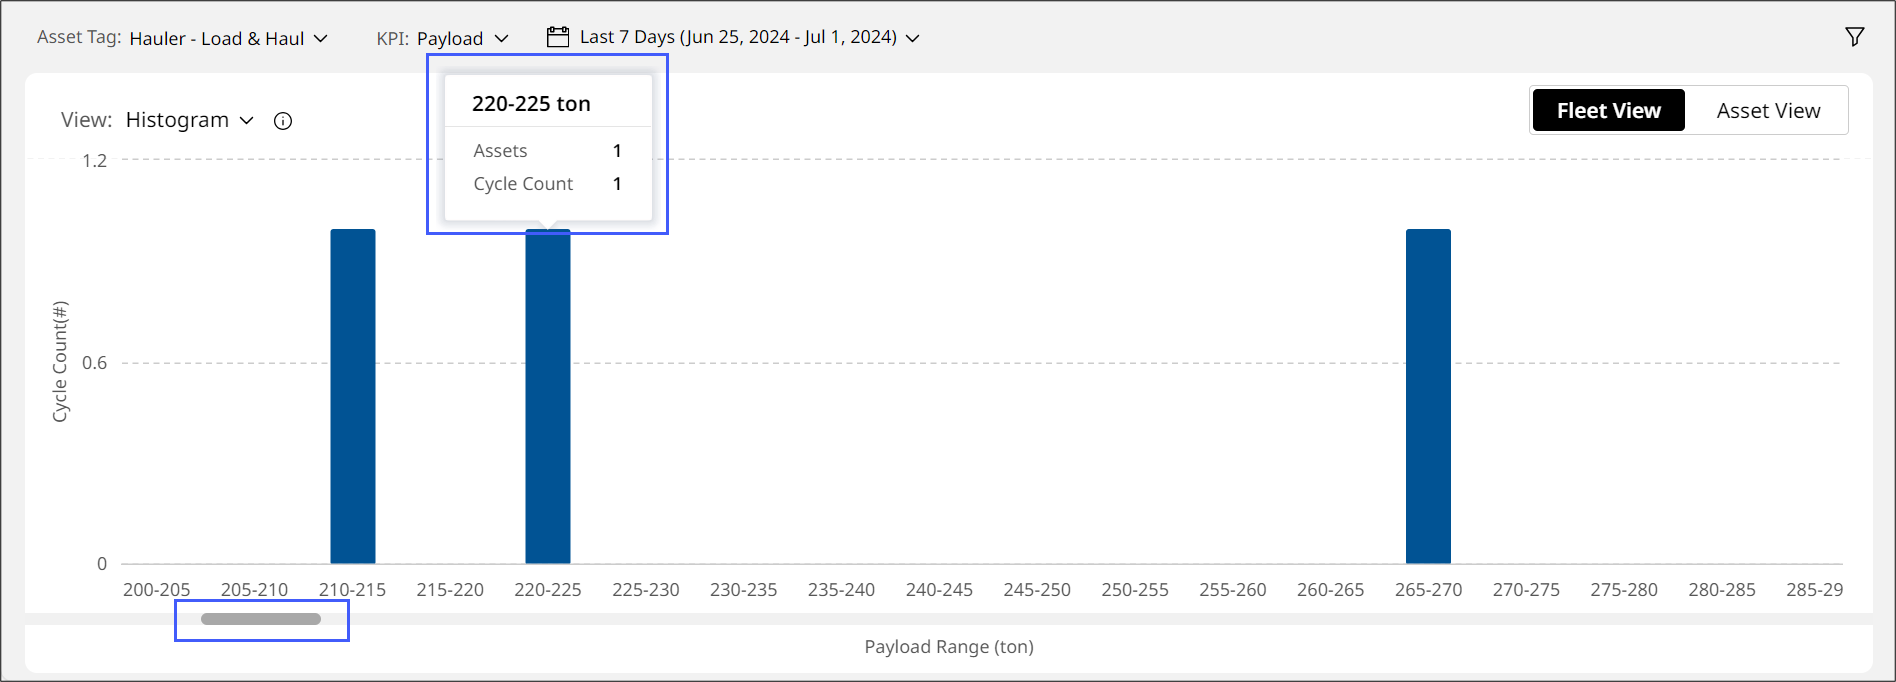
• The payload range will not always start from zero. It will display based on the first available value and end at the last available value.
• The range interval for each truck cycle will vary depending on the selected asset tag:
◦ For Hauler – Load & Haul and Scraper asset tags, it will display in truck payload intervals of five (for example: 05-10, 25-30, etc.).
View ImageView Image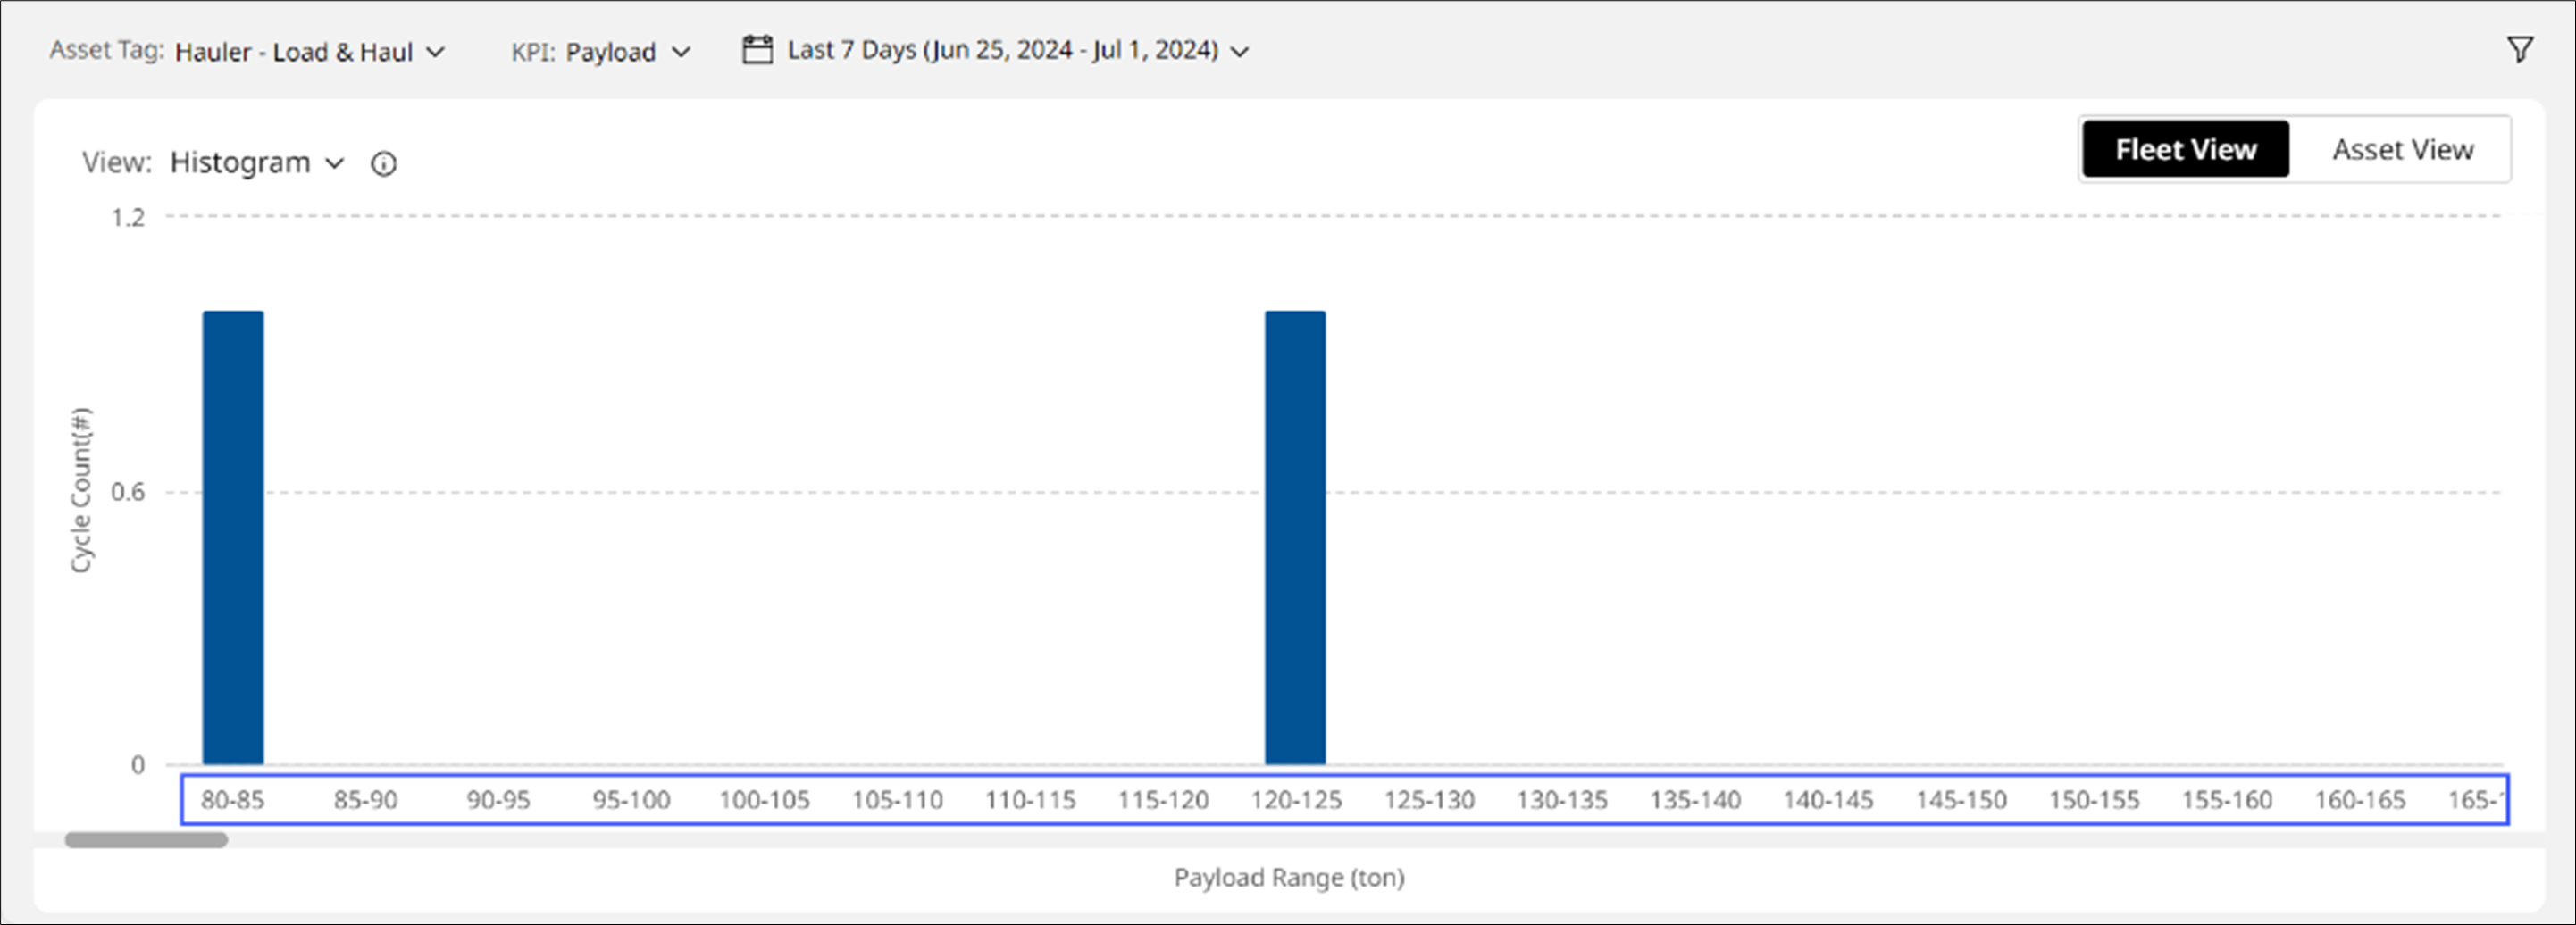
◦ For Loader – Load & Haul and Load Out asset tags, it will display in pass payload intervals of three (for example: 00-03, 30-33, etc.).
View ImageView Image
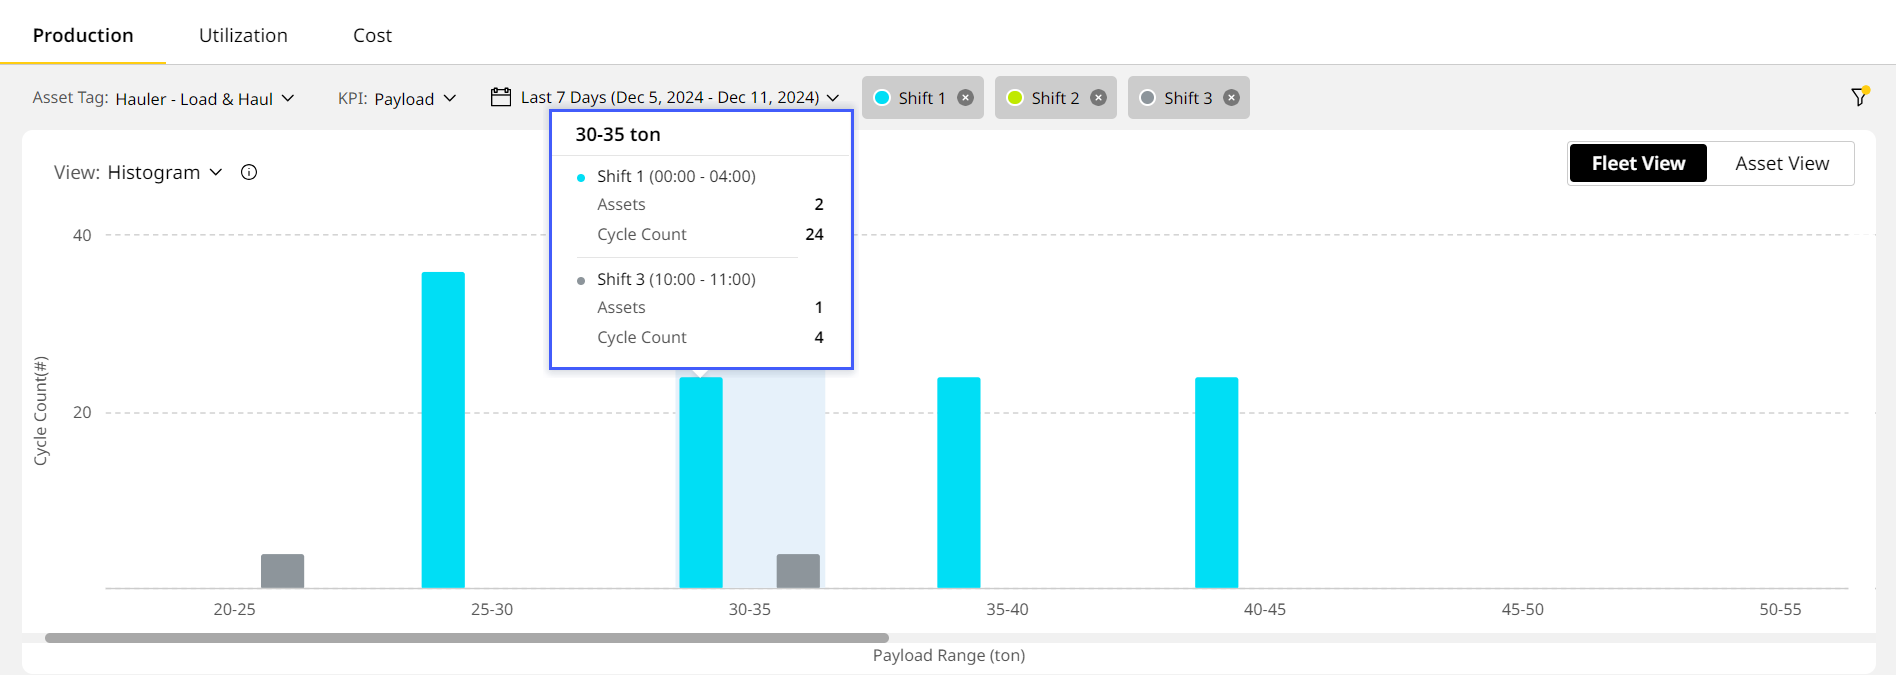
• You can Filter by assets and shifts to view corresponding data.
◦ Each shift will display as a distinct bar on the histogram. A translucent overlay behind the shifts represents the actual value for that payload range.
◦ Hover over any column to see the shift-wise asset and cycle count for each payload range.
View ImageView Image
-
-
-
Segment
Displays a donut chart of the overall Asset Cycle Time of the selected asset tag, with the legend given below. View Cycle Detail KPIs at the left of the donut chart as cards.
The production KPIs displayed here change based on the selected asset tag.
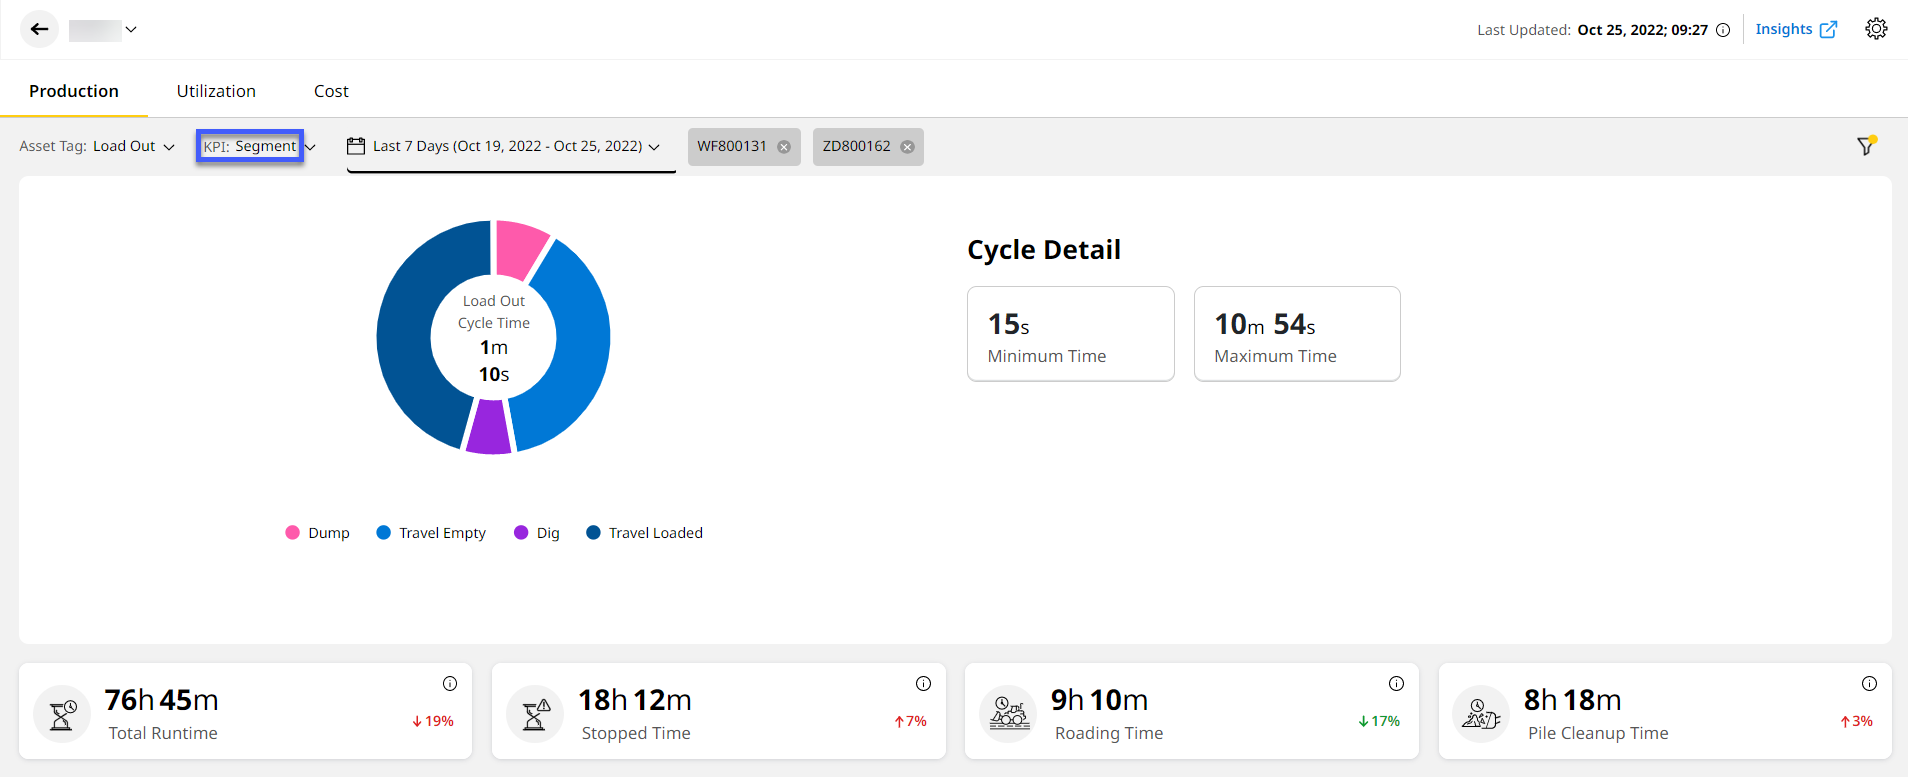
Click on a section of the donut chart to view its corresponding details on its left.
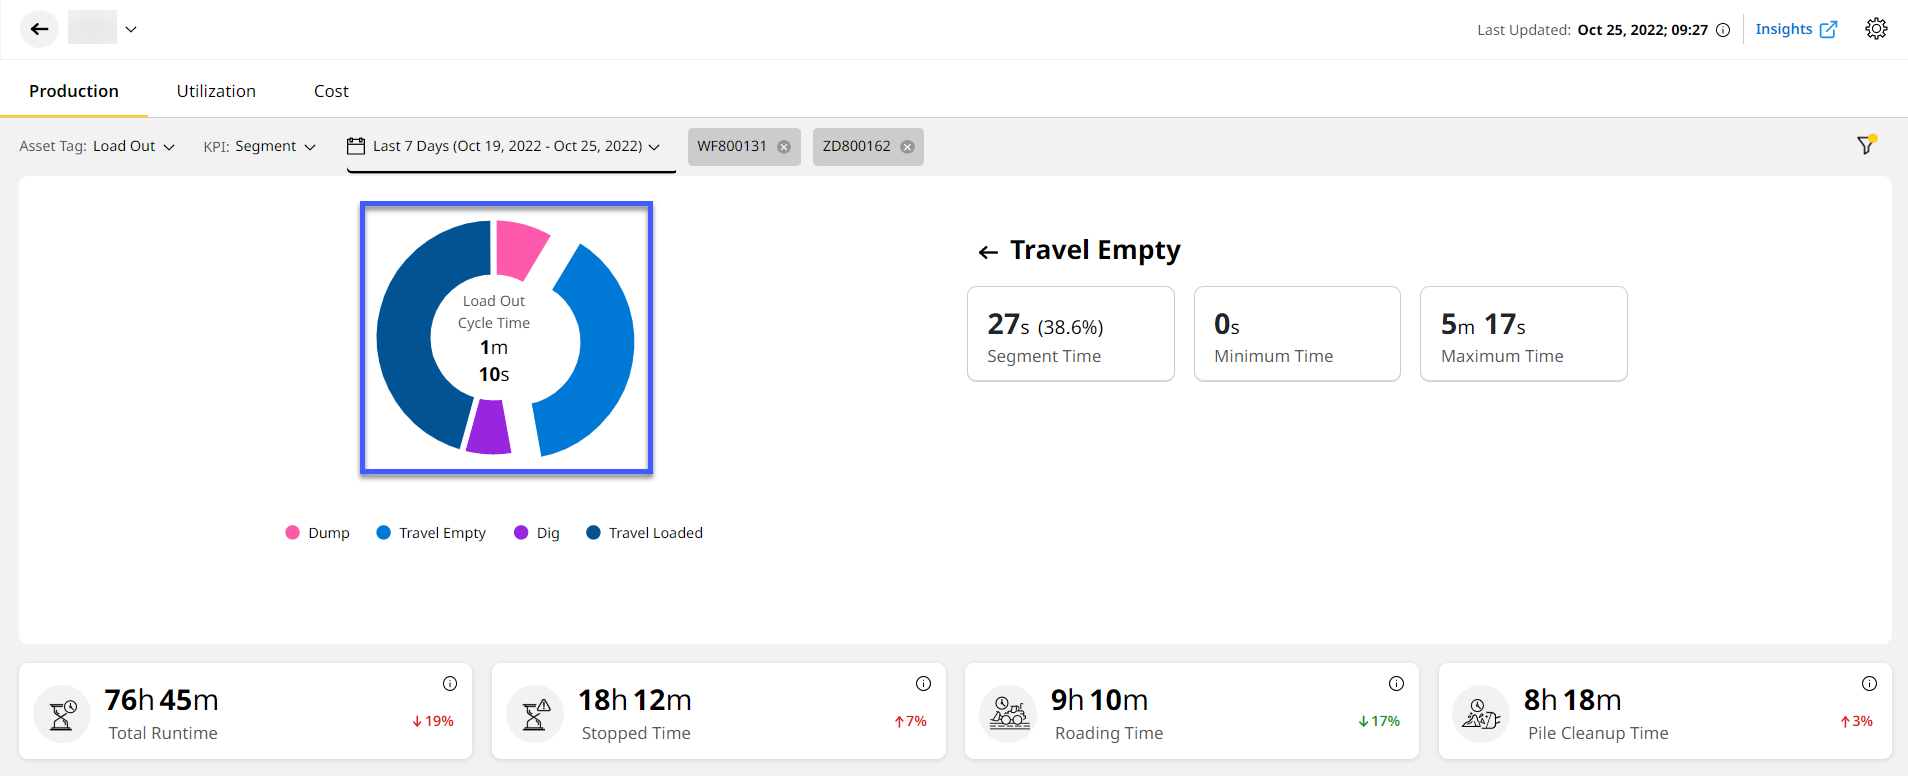
• The Loader – Load & Haul or Load Out asset’s supported segments are displayed in the segment donut charts.
• Assets that perform loading activities in a site are tagged as Loader - Load & Haul or Load Out. They can be:
° Wheel loaders, which have two segments:
• Travel Loaded
• Travel Empty
° Excavators, which have two additional segments:
• Swing Loaded
• Swing Empty
• Click on a segment of the donut chart to view corresponding KPIs in detail:
° Segment Time (percent of selected segment against total segment time)
• Minimum Time
• Maximum Time
View ImageView Image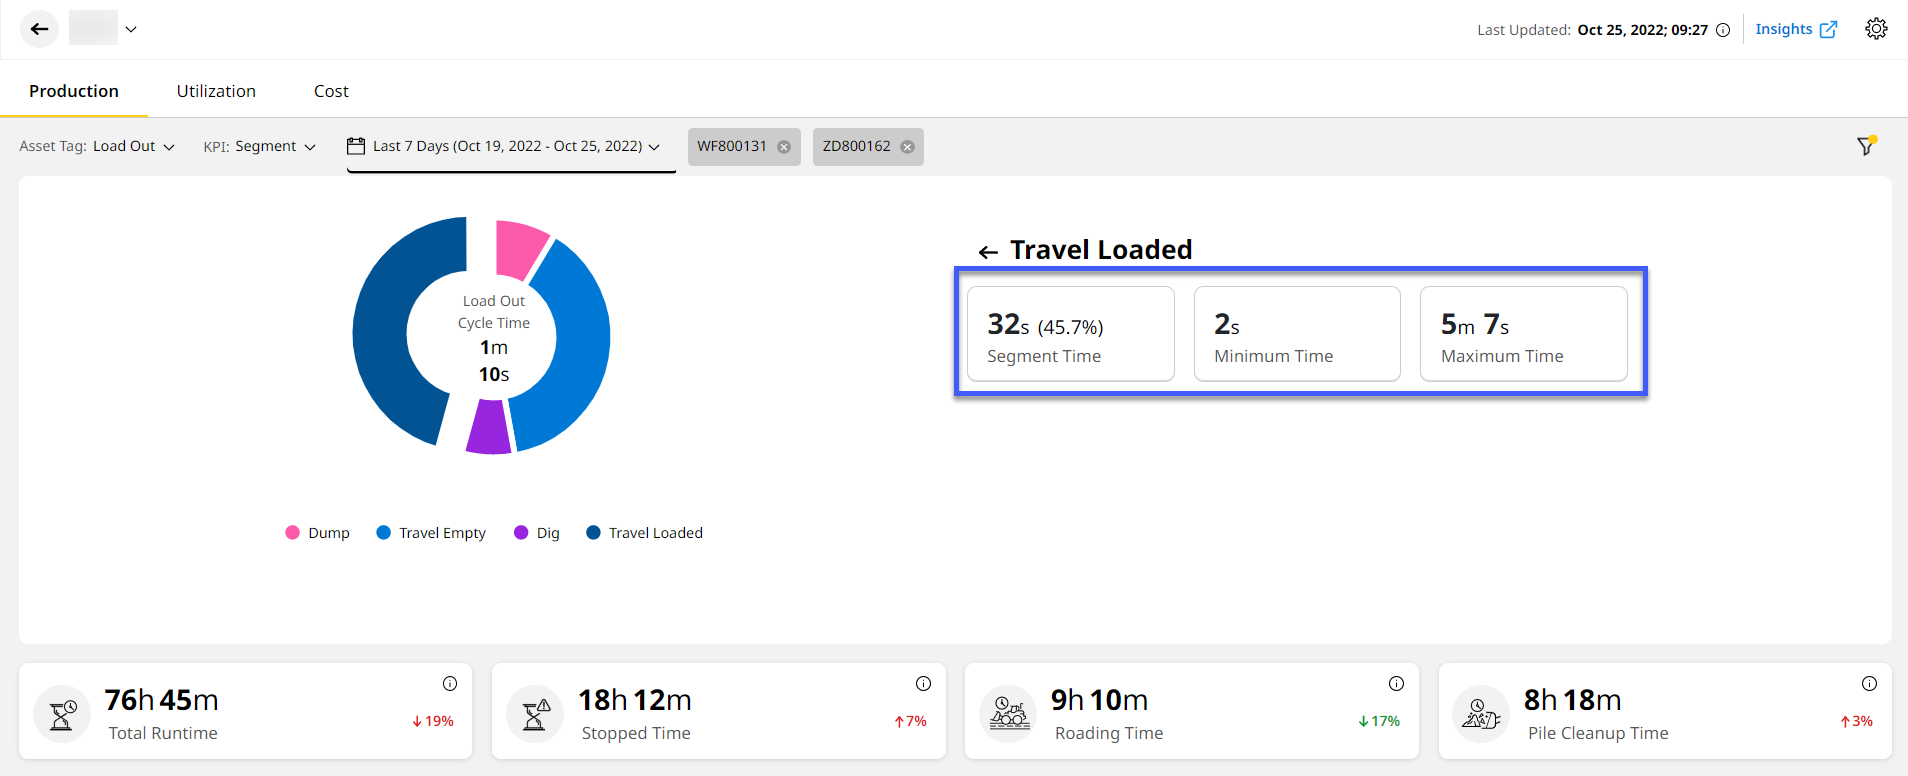
-
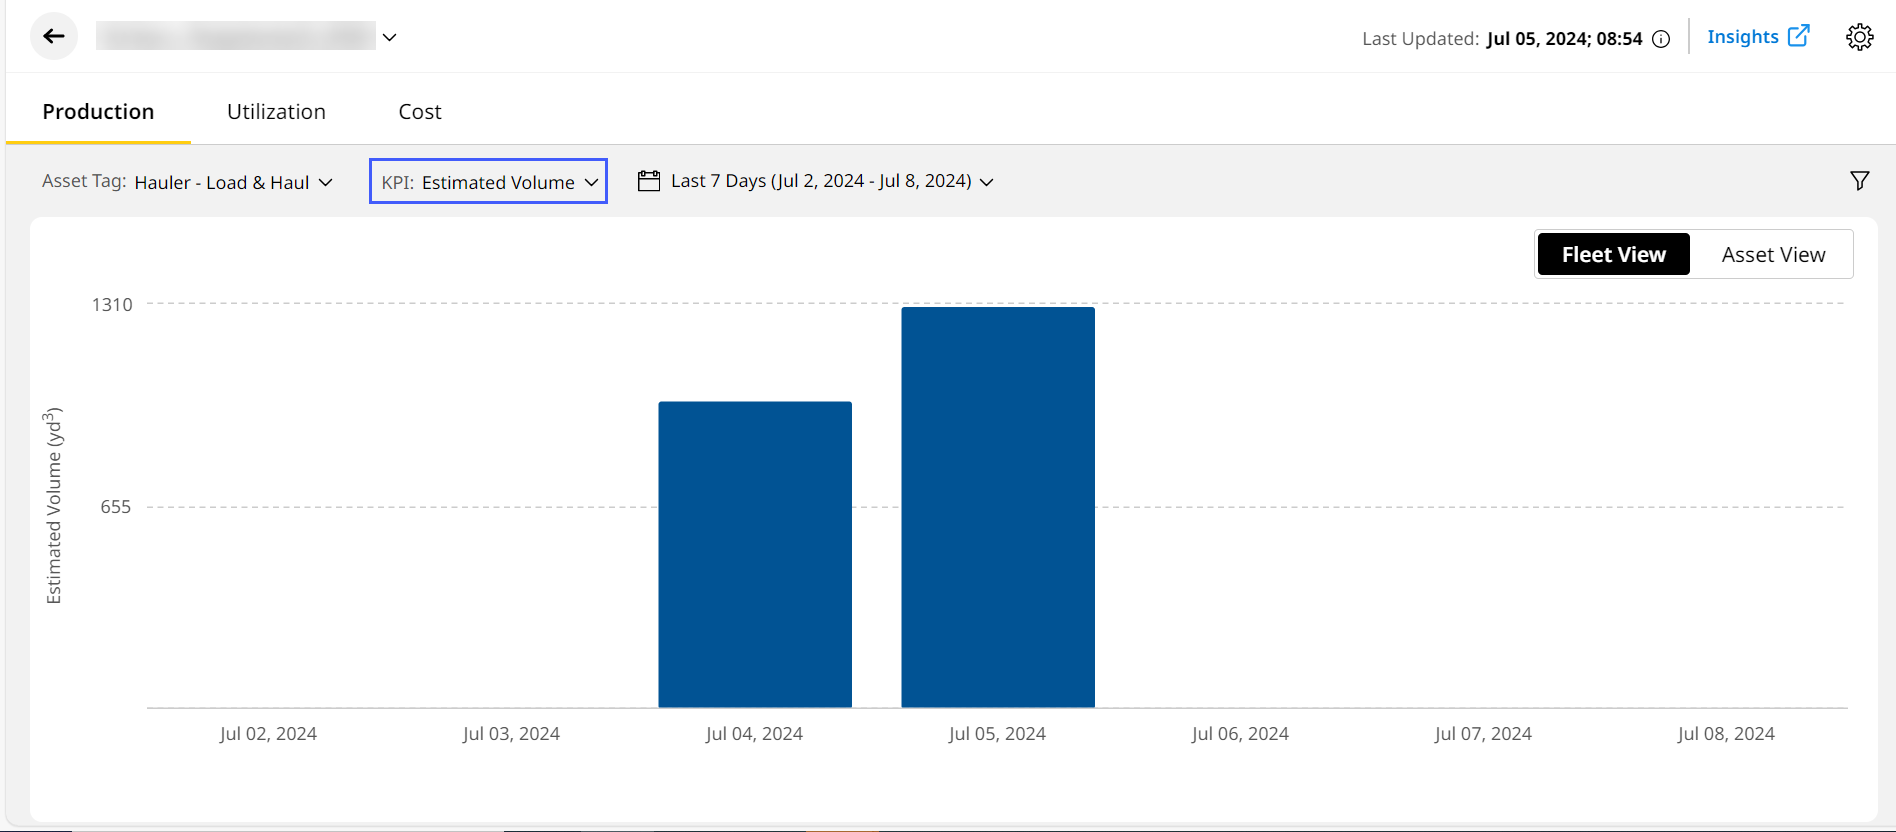
Estimated Volume
Displays the Estimated Volume metrics for selected assets and date range as a bar chart. Hover over a bar to view the Total Volume and that of the asset tag for that day/time.
If shifts are created and scheduled for a site, you can filter the data based on it by clicking filters
.