Production (Asset) Tab
With Production (Asset), find out about an asset’s overall operational performance.

To know more about the other tabs or the information above them, refer to Asset Details Dashboard.
-
KPI: Select from among the following production KPIs to view corresponding chart, KPI card and tabular data:
-
-
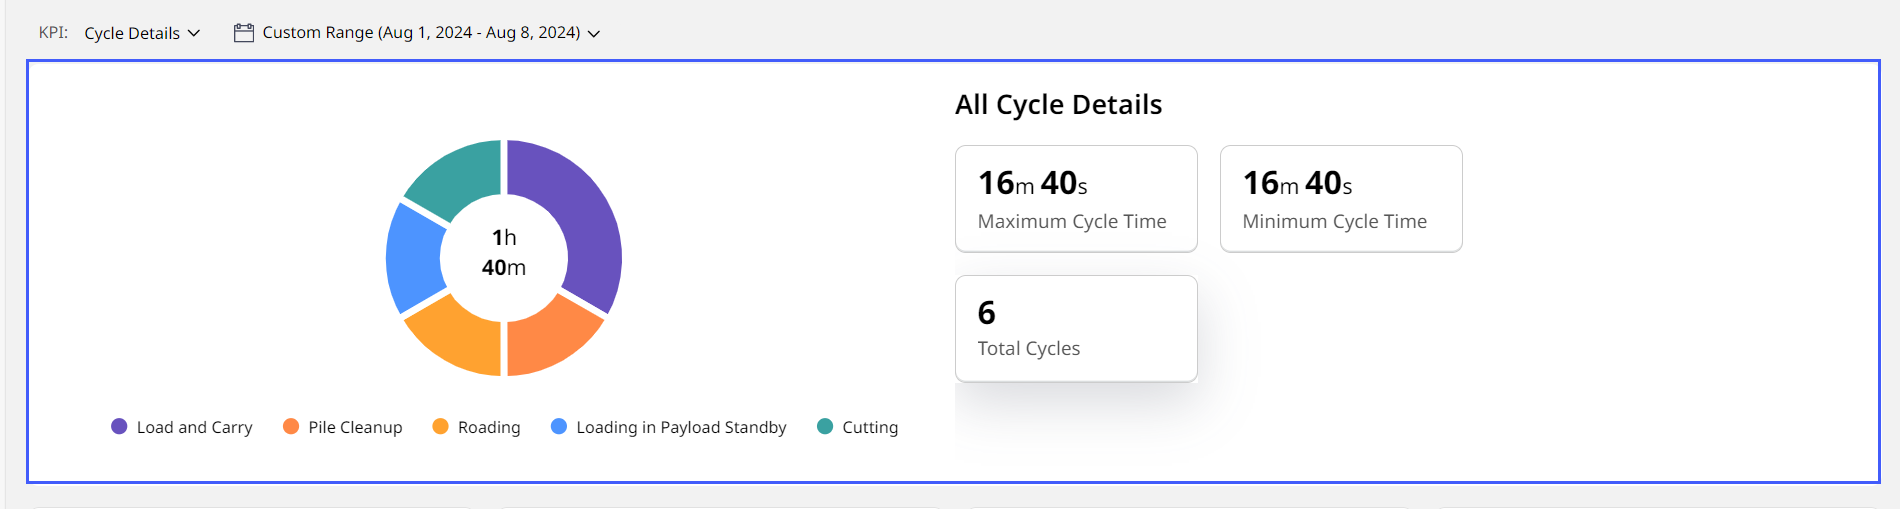
View a donut chart of the durations of different cycles the asset has performed for the given date range. This comes along with distinct colored slices and a legend to help you know which donut slice represents what.
-
View vital cycle duration and count details on the right in the form of handy cards.
-
-
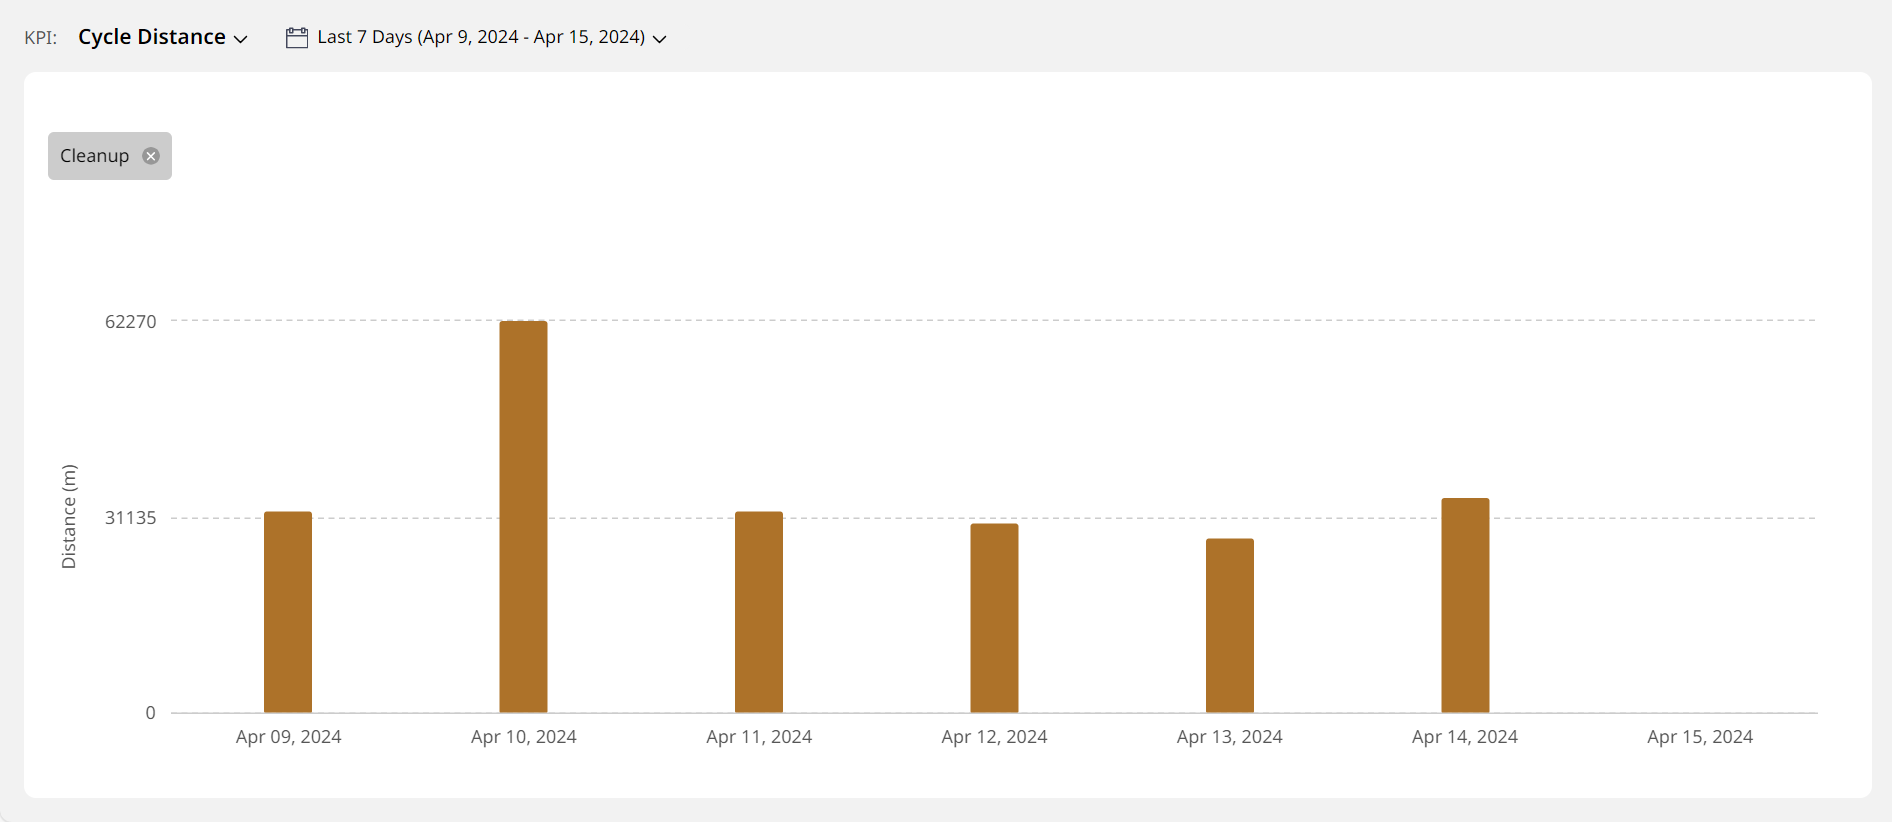
For Cycle Distance, Cycle Fuel and Cycle Time chart view, the following applies:
• All applicable segments display as a distinct-colored column.
View ImageView Image
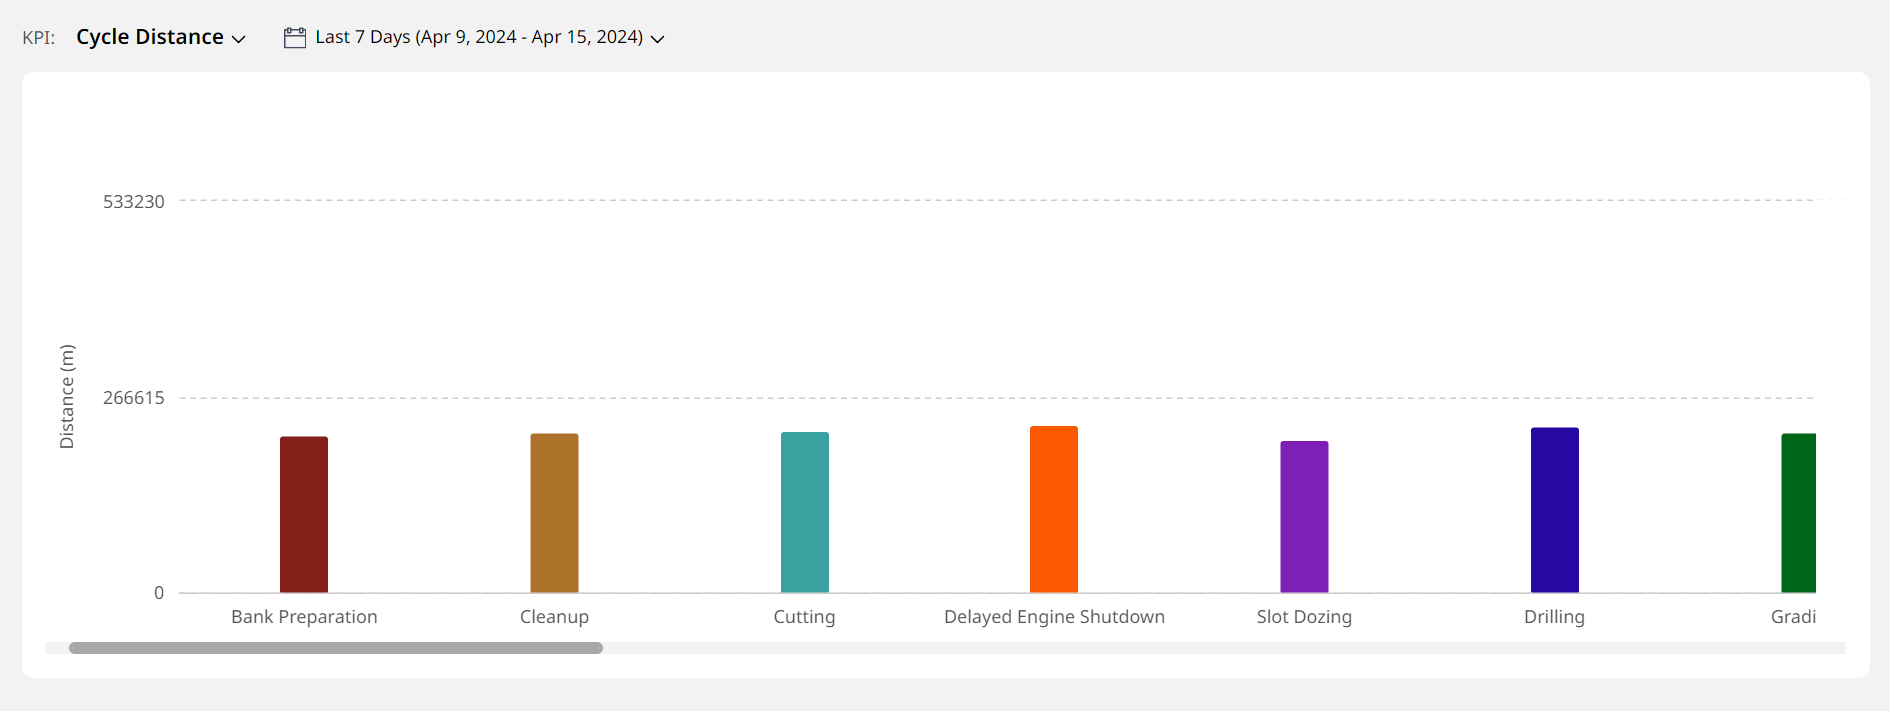
• Click on any segment column to see data for that based on the selected date range. Click close next to the segment's chip to go back to the main KPI chart view.
View ImageView Image
-
-
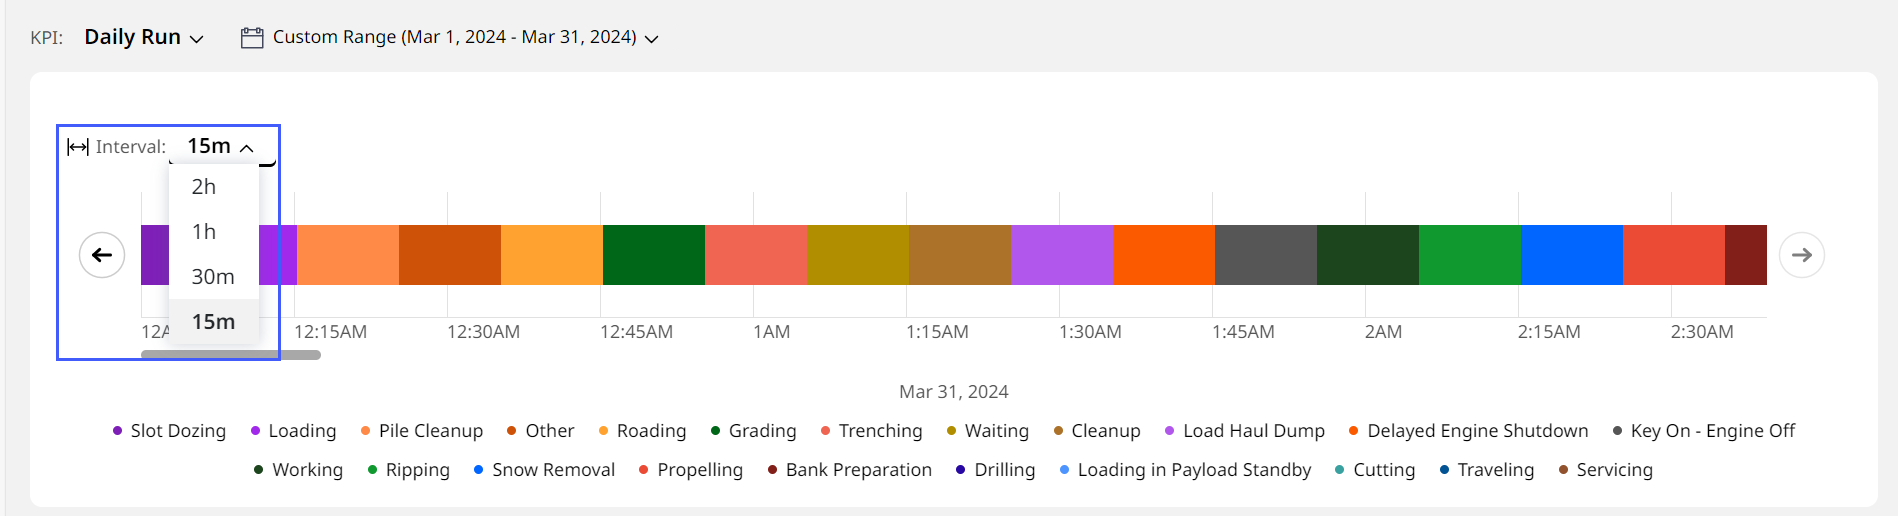
Interval: Use to change the scale of the graph to 15 minutes, 30 minutes, one hour, 1.5 hours and two hours.
-
-
-
For this KPI, toggle Chart/Matrix View
 to switch between Chart View (appears by default) and Matrix View.
 -
Matrix View visualizes data as a tabular matrix. You can set the rows and columns with list data. View payload data by material, truck, load site or custom list data. The matrix also displays Total Payload Count at the end.
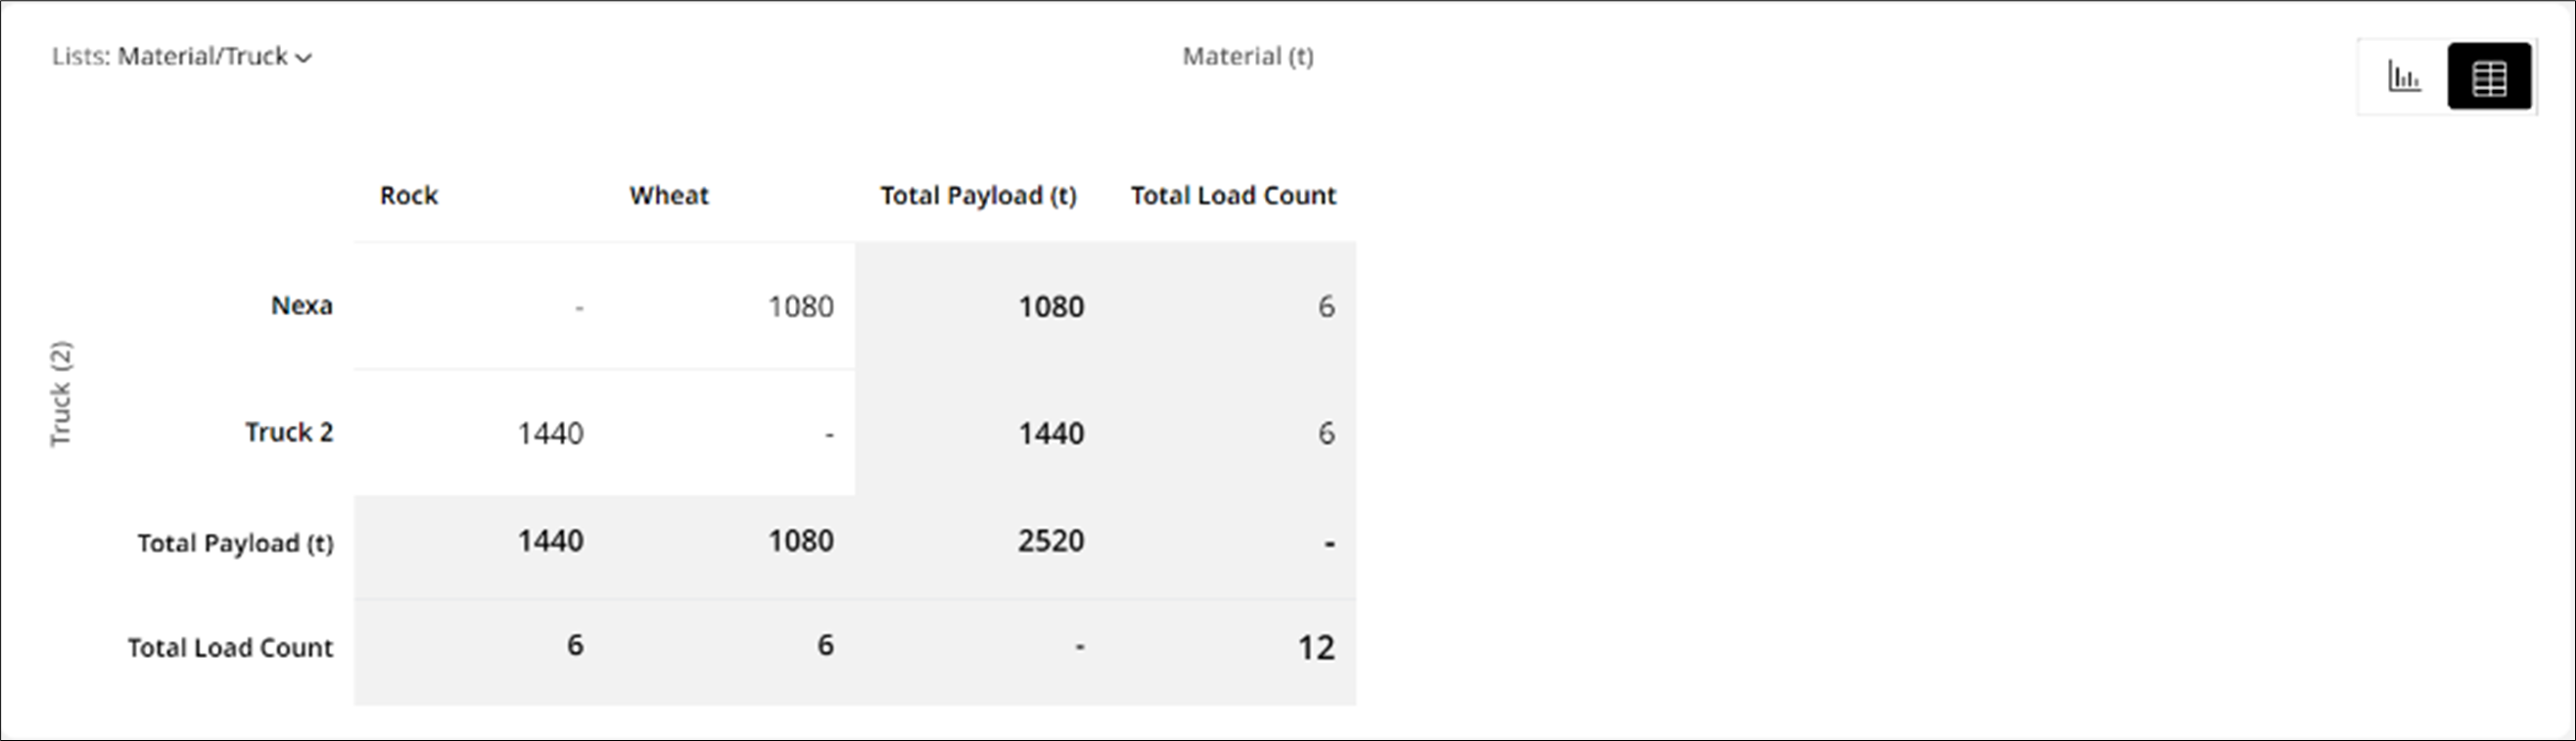
• If you select Trucks under either Columns or Rows, then Total Load Count values also display after Total Payload Count.
• The payload data displayed here will differ from Production (Site) payload data. This is because payload data on Production (Site) is based on cycles. -
Click Lists to modify the list parameter of the matrix:
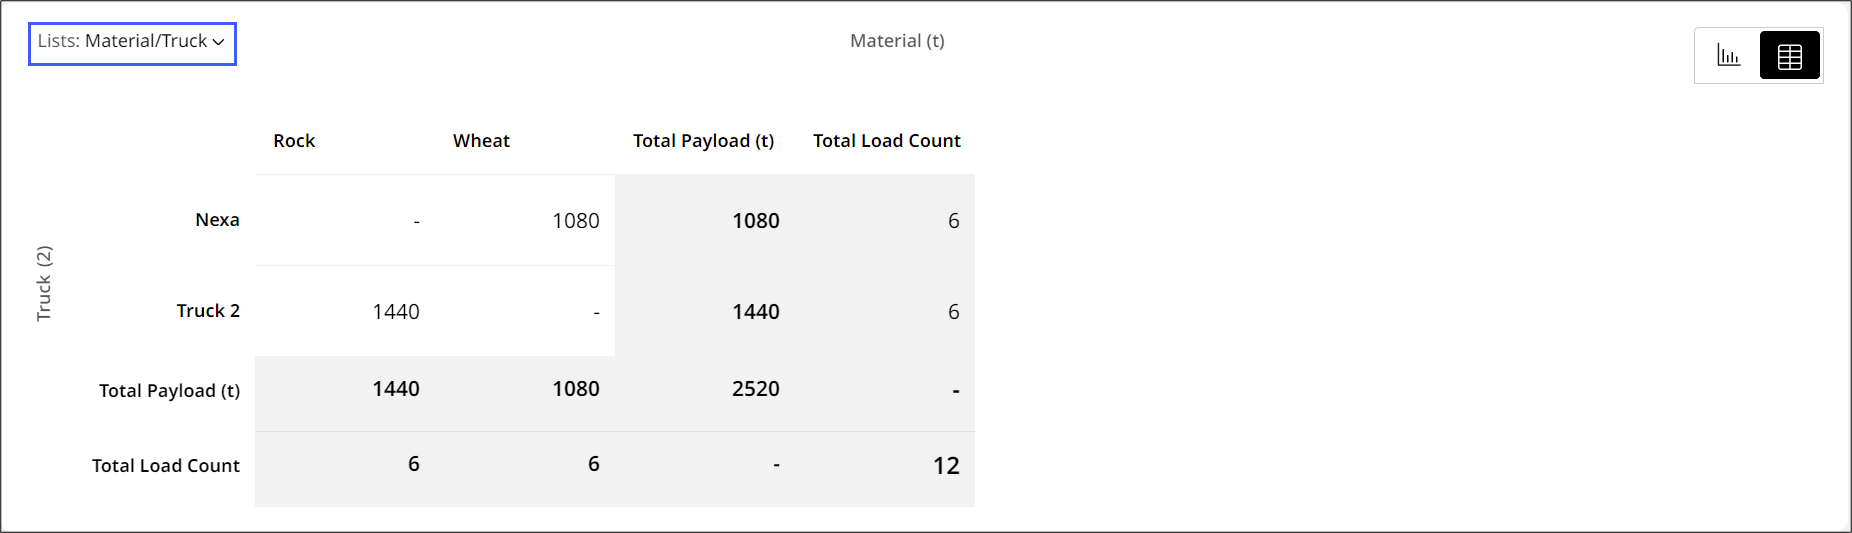
For this to display, lists need to be added onboard the asset and then configured on Lists > Material Information.-
Under Column drop down, choose an available list type. By default, this is Material.
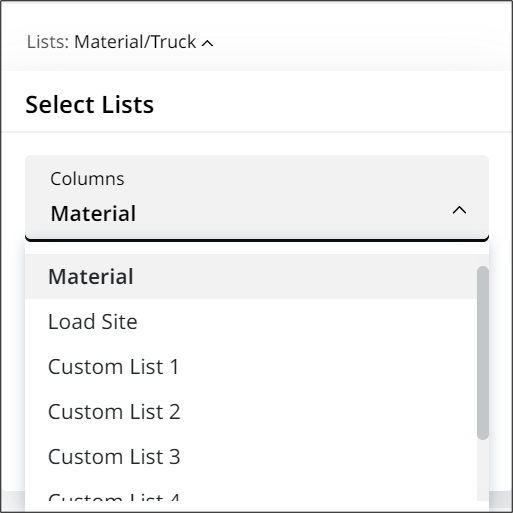
-
Under Row drop down, choose an available list type. By default, this is Truck.
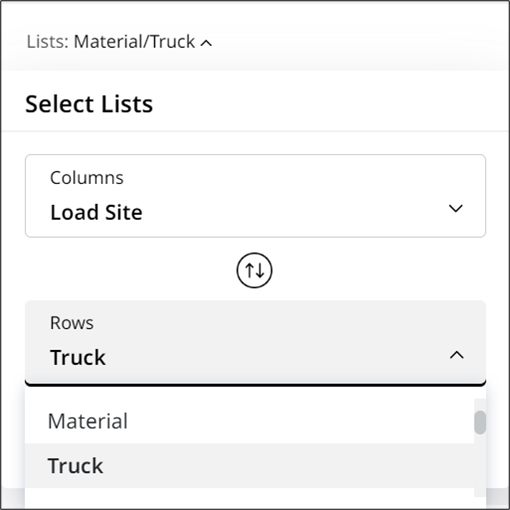

Use swap to quickly switch between current row and column selections.
 -
Click Apply to save your changes.
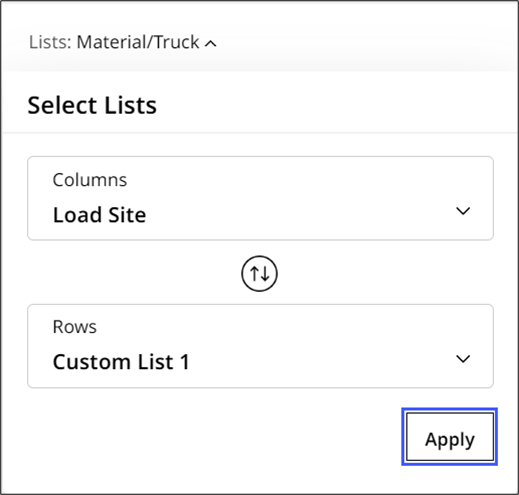
• If there is only one list type available, then that will appear under Column. Unknown will appear under Row.
• To find the list of supported asset types, refer to Custom List.
-
-
The following KPIs are exclusive to cold planers:
-
-
Both Cutting and Not Cutting values appear as distinct-colored columns. Hover over either value to know more.
-
-
Date Range: Choose the date range to view the KPI data for the following time periods:
-
Today
-
Yesterday
-
Last 7 days
-
Custom Range (up to 31 days)
-
-
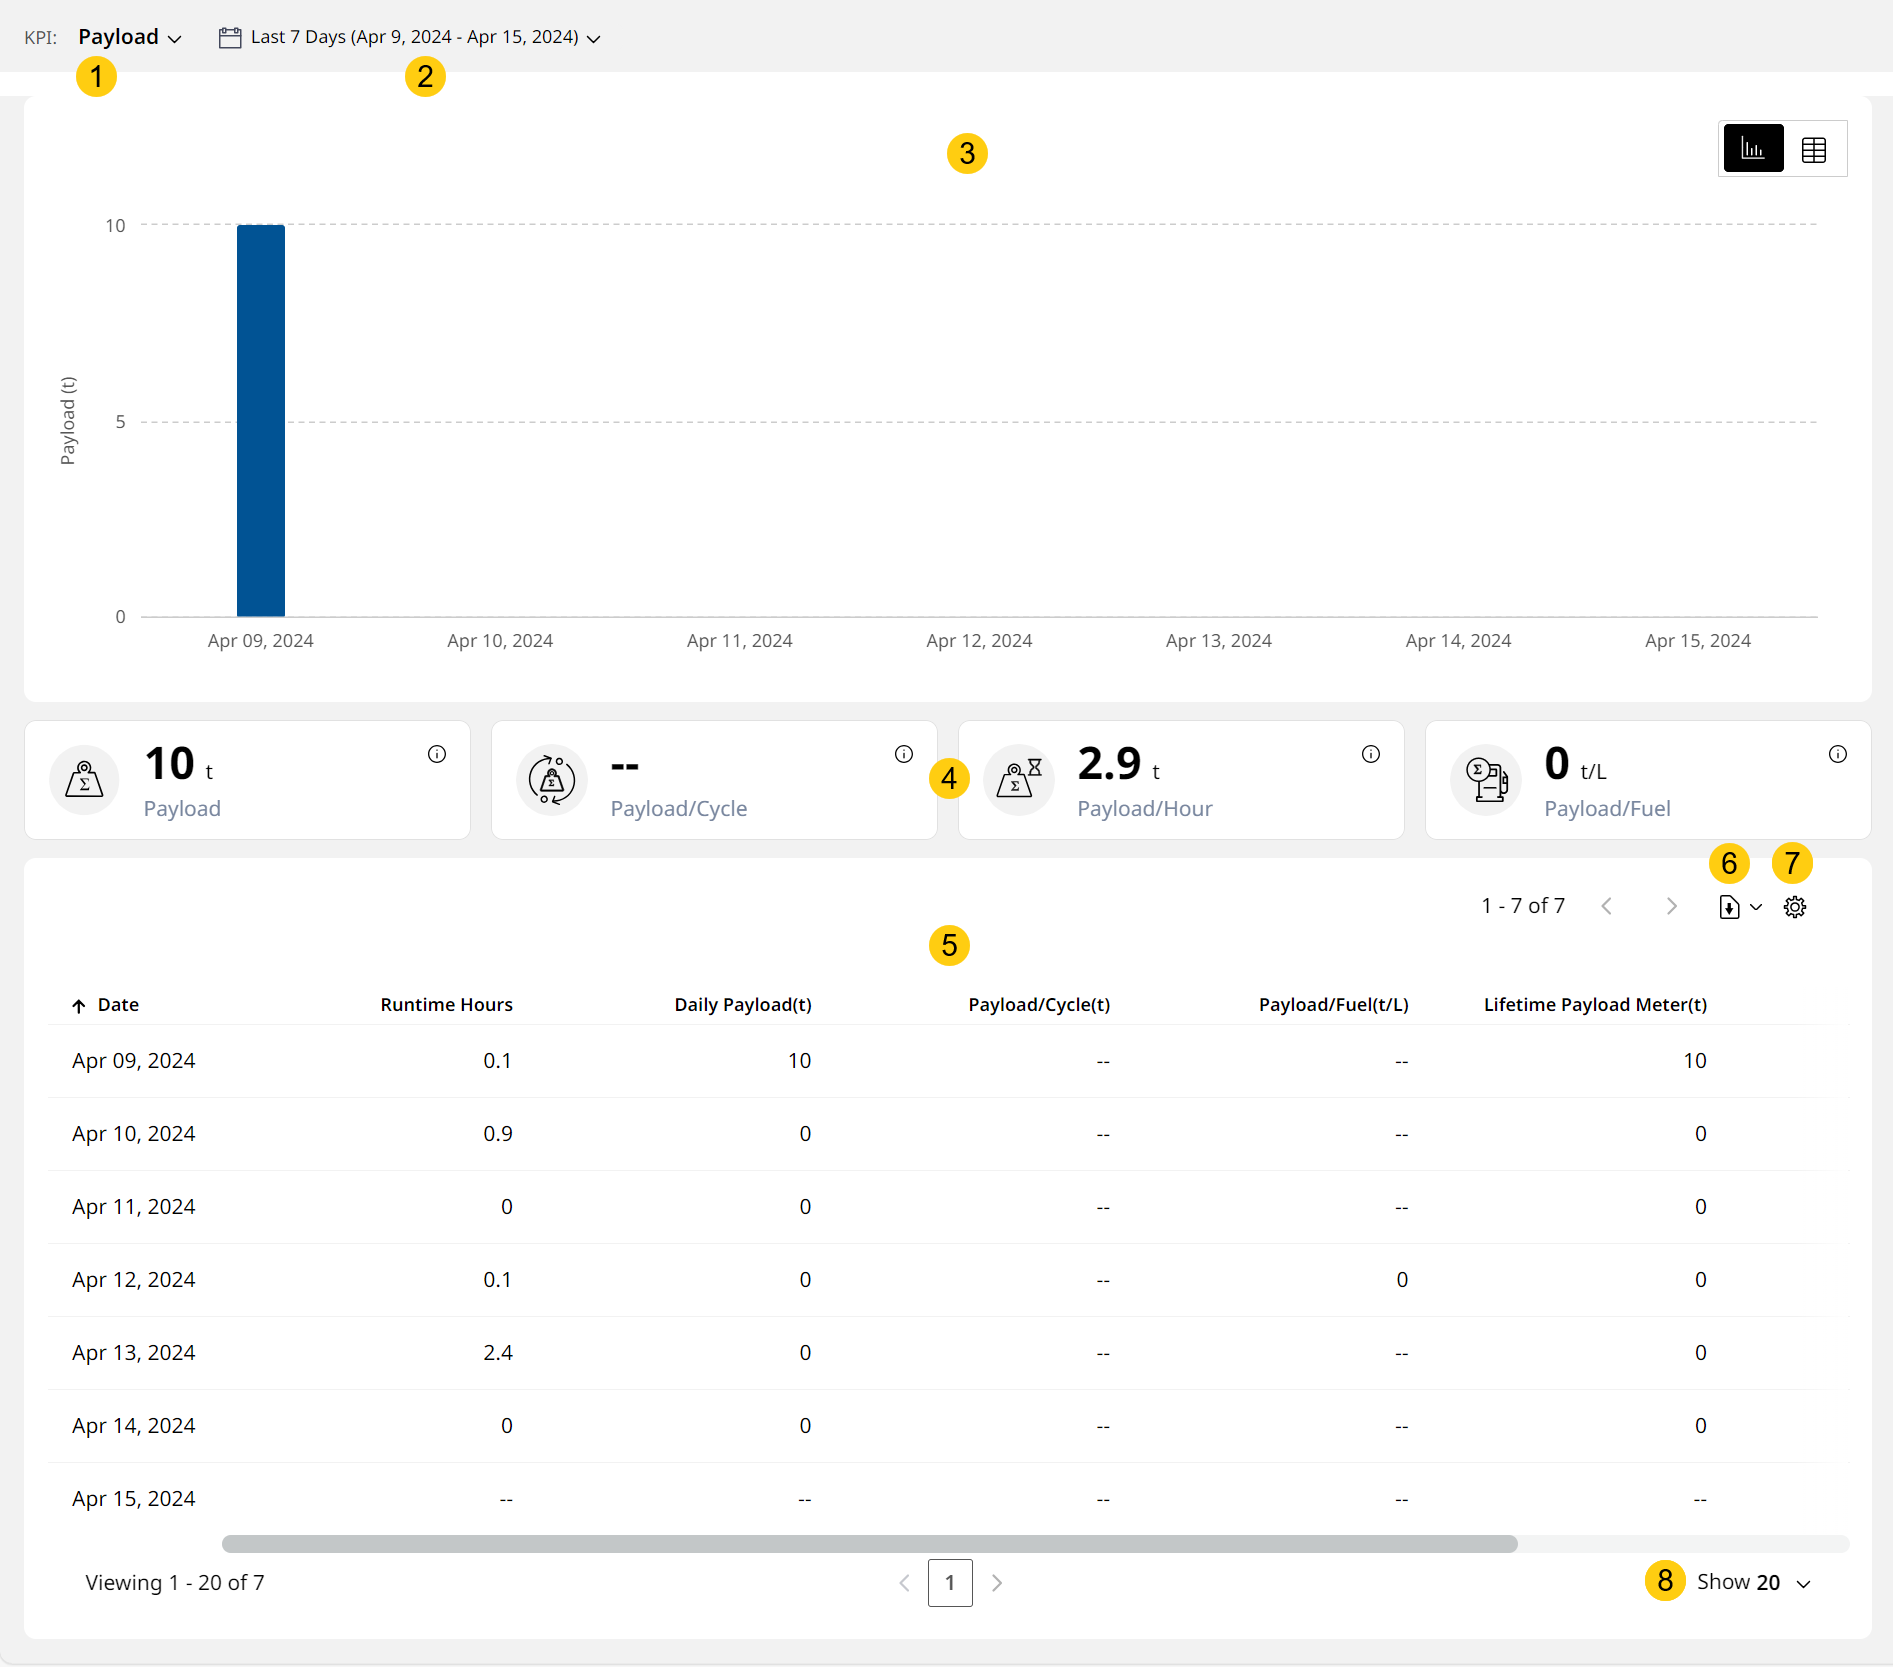
Chart View: Displays the data depending on KPI and date range selected in a visual format. This can be in the form of column graphs, pie charts (cycle details) or time blocks (daily run).
-
KPI Cards: Displays metrics related to the selected production KPI to track and analyze at a glance.
• For the following KPIs, the KPI card section isn’t present:
° Daily Run
° Cycle Distance
° Cycle Details
° Cutting & Not Cutting Time
° Cut Distance/Fuel
• Click info in a KPI card to view its definition. Click Learn More to visit the respective Help Center article providing more information on that KPI.
View ImageView Image
-
Table View: Lists down the day-wise data generated by the selected asset. Depending on the KPI and date range selected, it could be single or multiple days-worth of data and ordered differently.
Click the Date column to sort data in ascending (from earliest date) or descending (from latest date) order.
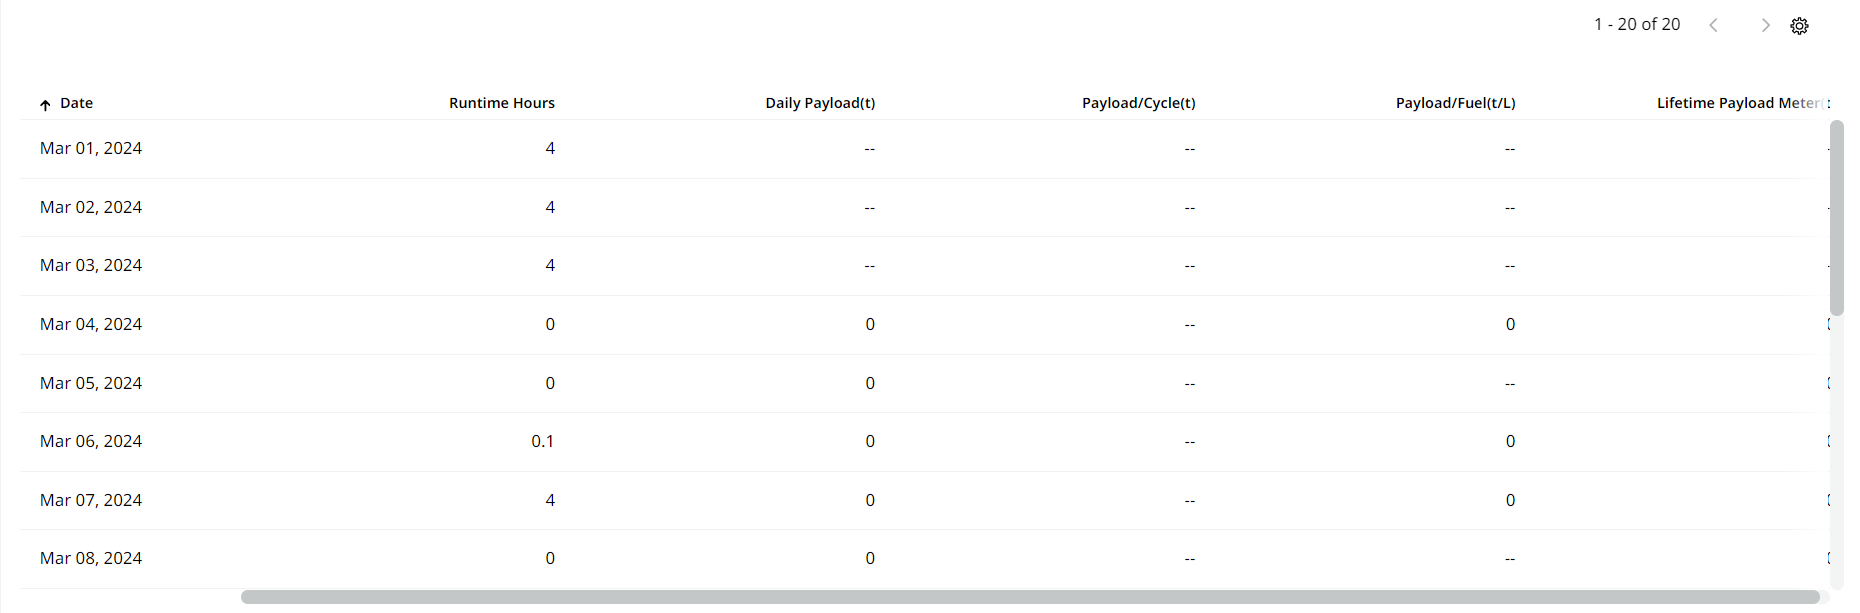
You may find the following two types of null values within a particular table view:
• "0": Indicates that no corresponding work was carried out for that particular metric (distance, hours, payload etc.).
• "--": Indicates that no value was recorded for that particular metric (distance, hours, payload etc.). -
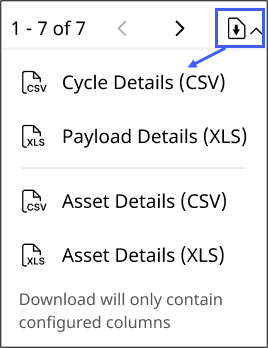
Download
 : Save the asset’s data as one of the following to further share and analyze offline:
• If you’re downloading 31-day-period data, it may take some time for the .csv/.xls files to generate. View the export percentage details to know how long it will take.
View ImageView Image
• Depending on the columns you configure, the same will reflect in the downloaded report.
• You can only download these reports for assets subscribed to Performance with Advanced Productivity/PerformancePro.-
Cycle Details (CSV): Obtain comprehensive application cycles -based data for the asset for 31 days. This covers metrics like cycle duration, dump distance, moved payload and more.
-
Payload Details (XLS): Obtain comprehensive payload-based data for the asset across 31 days. This covers metrics like payload sequence, load end time, load weight and more.
• Cycle Details (CSV) and Payload Details (XLS) reports are now available for 31 days.
• You can only schedule these two reports for assets capable of recording cycle and payload files. This requires a subscription of Base Plan as PerformancePro with Optional Plan as Advanced Productivity. -
Asset Details (CSV): Download the entire asset’s tabular view data for the selected KPI and date range as a .csv file.
-
Asset Details (XLS): Download the entire asset’s tabular view data for the selected KPI and date range as a .xls file.
• Depending on the columns you configure, the same will reflect in the downloaded report.
• You can only download these reports for Advanced Productivity-subscribed assets.
-
-
Configure Columns
 : Tick the columns you want displayed on Production (Asset) table. You can also rearrange the display order to make for easier viewing.
Depending on the number of columns added and where, navigate with the arrows available above the table view.

-
Show (rows): Choose between 20, 40, 60 and 80 table rows to be displayed at a glance.