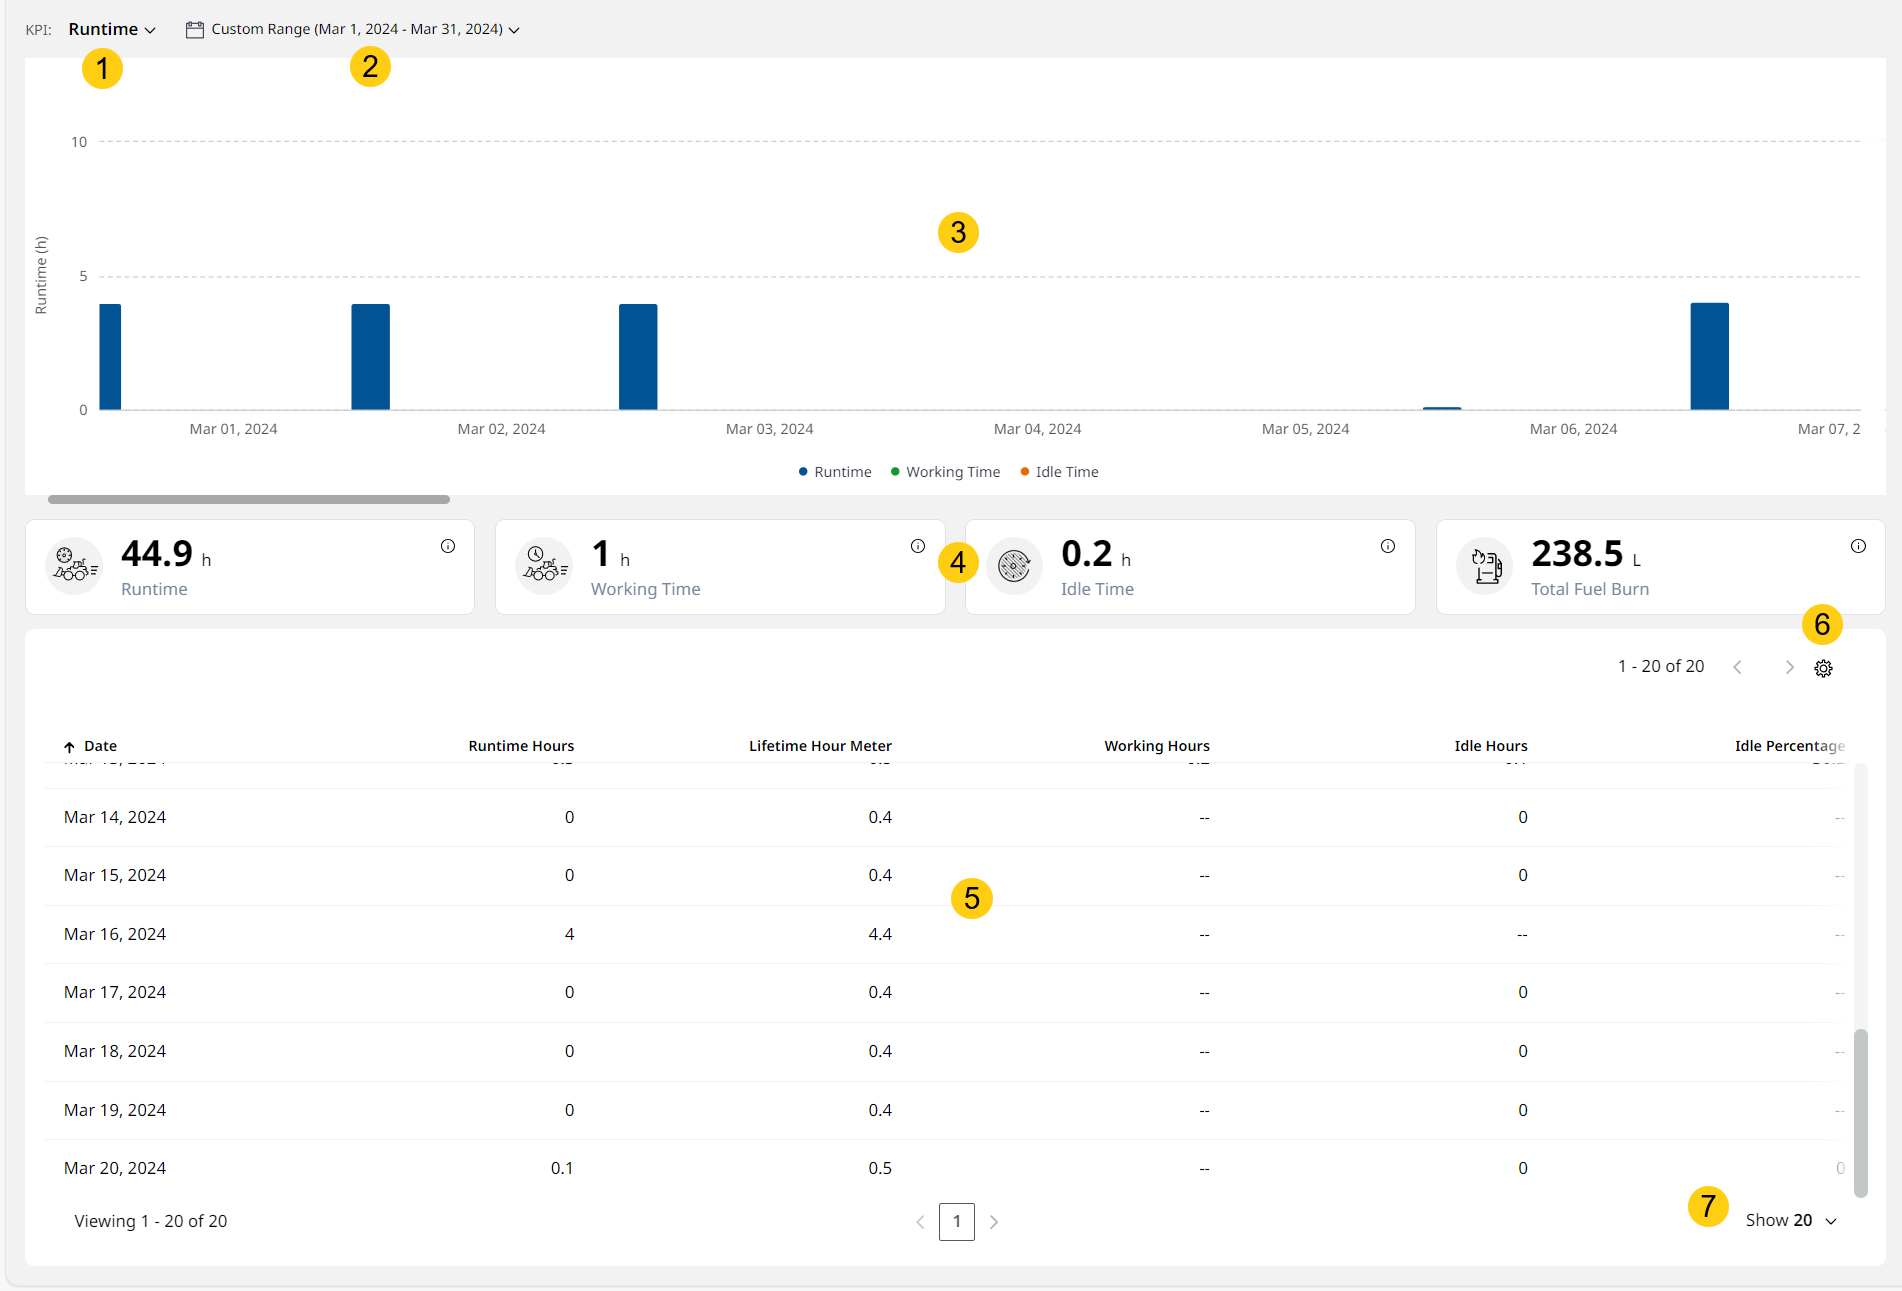
Utilization (Asset) Tab
With Utilization (Asset), find out about the asset’s overall runtime and fuel efficiency.

To know more about the other tabs or the information above them, refer to Asset Details Dashboard.
-
KPI: Select from among the following utilization KPIs to view corresponding chart, KPI card and tabular data:
-
Date Range: Choose the date range to view the KPI data for the following time periods:
-
Today
-
Yesterday
-
Last 7 days
-
Custom Range (up to 31 days)
-
-
Chart View: Displays the data, depending on KPI and date range selected, in a visual format.
-
KPI Cards: Displays metrics related to the selected utilization KPI to track and analyze at a glance.
Click info in a KPI card to view its definition. Click Learn More to visit the respective Help Center article providing more information on that KPI.
View ImageView Image -
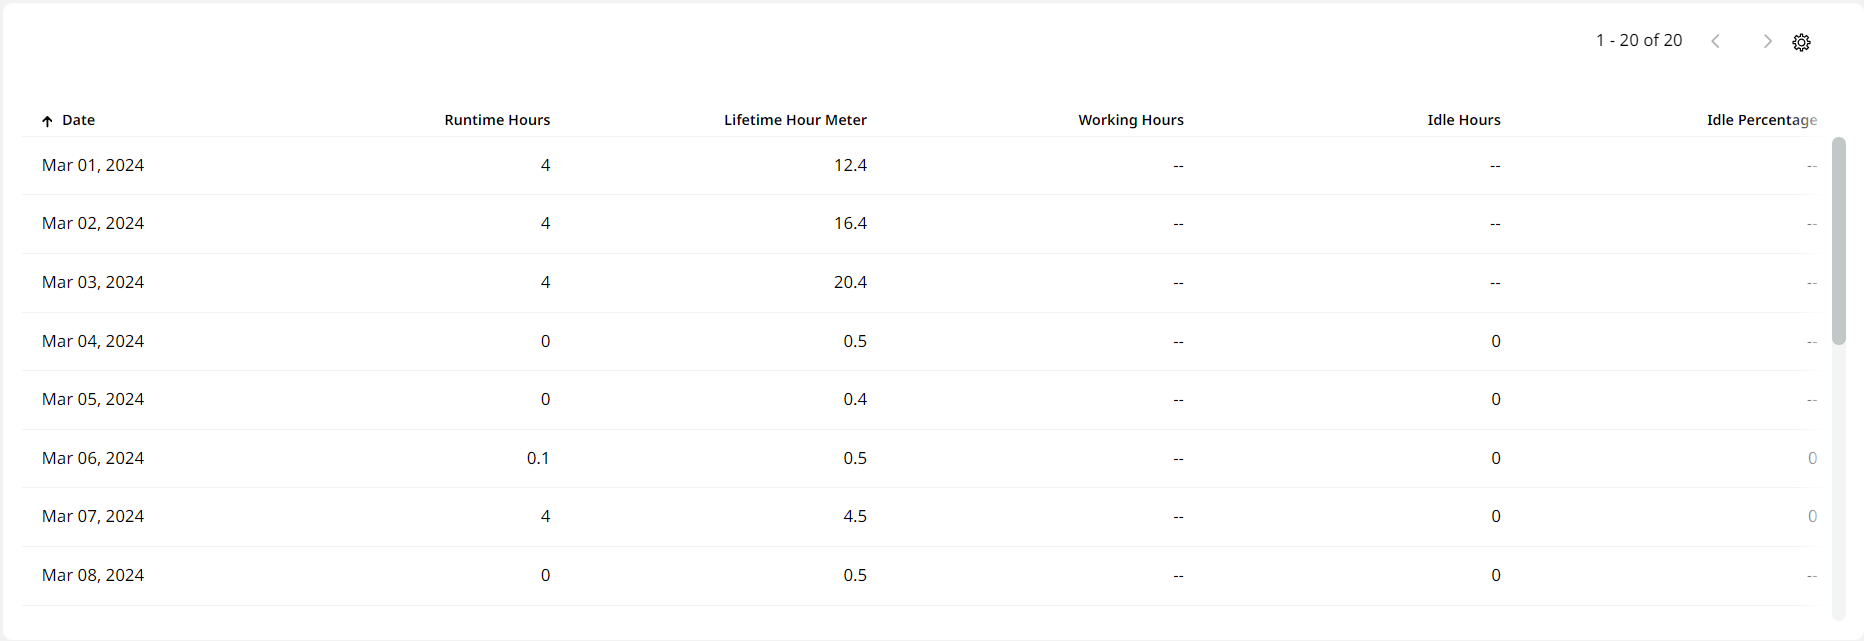
Table View: Lists down the day-wise data generated by the selected asset. Depending on the KPI and date range selected, it could be single or multiple days-worth of data and ordered differently.
Click the Date column to sort data in ascending (from earliest date) or descending (from latest date) order.

You may find the following two types of null values within a particular table view:
• "0": Indicates that no corresponding work was carried out for that particular metric (distance, hours, payload etc.).
• "--": Indicates that no value was recorded for that particular metric (distance, hours, payload etc.). -
Configure Columns
 : Tick the columns you want displayed on Utilization (Asset) table. You can also rearrange the display order to make for easier viewing.
Depending on the number of columns added and where, navigate with the arrows available above the table view.

-
Show (rows): Choose between 20, 40, 60 and 80 table rows to be displayed at a glance.

