Asset Details Dashboard
Click on an asset listed on Assets to view the dashboard with more detailed information.
Here, you can measure track production, utilization and other metrics across time in graphical and tabular form for the particular asset:
Measure if your asset is under- or over-performing and where improvements can be made to enhance your productivity or efficiency.
When you navigate here from Assets, you will land on Production (Asset) by default. From there, you can switch to other available tabs.
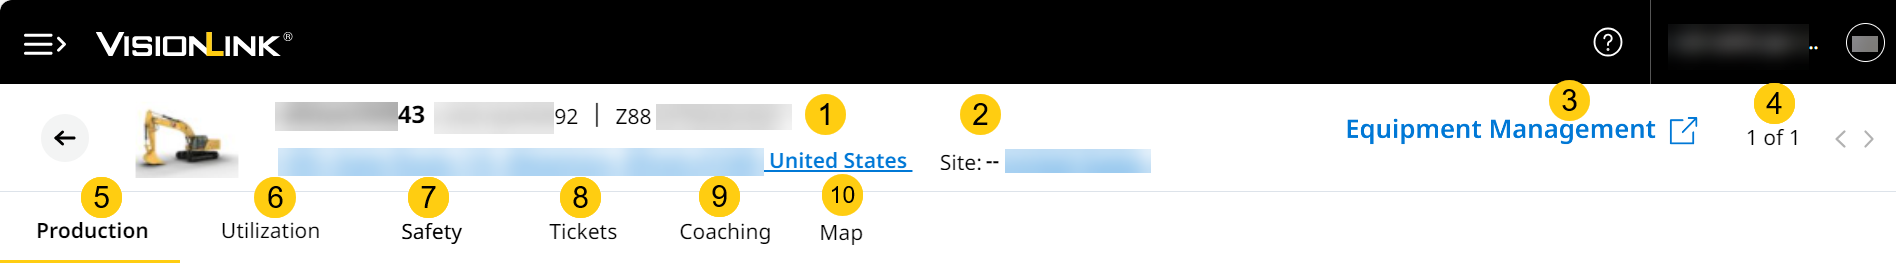
Some common elements across Asset Details Dashboard are the following:
-
Asset Profile: Includes asset icon, Asset ID, Asset Serial Number, Make/Model and the Asset Location.

• Some of your assets may be shared from/to assets. If so, respective indicators (Shared From or Shared To
  ) display next to the asset details.
• You can find the shared asset indicator in the following places:
◦ Asset Details Dashboard
◦ Lists
• Click the asset location link to view the current location of the asset on map view.
• Right-click anywhere on the map to view latitude and longitude details. Click copy next to it to copy the coordinates.
View ImageView Image
.png)
-
Site: Displays all sites where the asset is assigned. Click on a site name to navigate to its Site Summary.
-
Equipment Management: Access the corresponding asset’s equipment management details on asset health status, asset events' timeline, maintenance and service data among others on vl.cat.com
 .
.
In Demo Mode, the link will remain visible but will be disabled. Clicking it won’t redirect to the respective asset’s equipment management details page. -
Asset Navigation: Shows the position of the selected asset in the asset list. Click here to navigate to the previous or next asset in the list easily.
-
Production: Reports the productivity data of the asset.
-
Utilization: Tracks the distance traveled, runtime and fuel burn of the asset.
-
Safety: Tracks asset's compliance with safety regulations.
-
Tickets: View tickets generated by an asset and share that via email.
-
Coaching: Measure the operator’s tip generation for efficiency, asset health, or hazardous operations.
-
Map: Visualize data for the asset via map view.
To learn more about each tab and further features, click on their respective links above.