Map (Asset) Tab
Visualize the following based on the selected date range in map view:
Navigate to Assets > Asset Details > select Map to access this view.

To know more about the other Asset Details Dashboard tabs or the information above them, refer to Asset Details Dashboard.

Right-click anywhere on the map to view latitude and longitude details. Click copy ![]() next to it to copy the coordinates.
next to it to copy the coordinates.
View ImageView Image
.png)
-
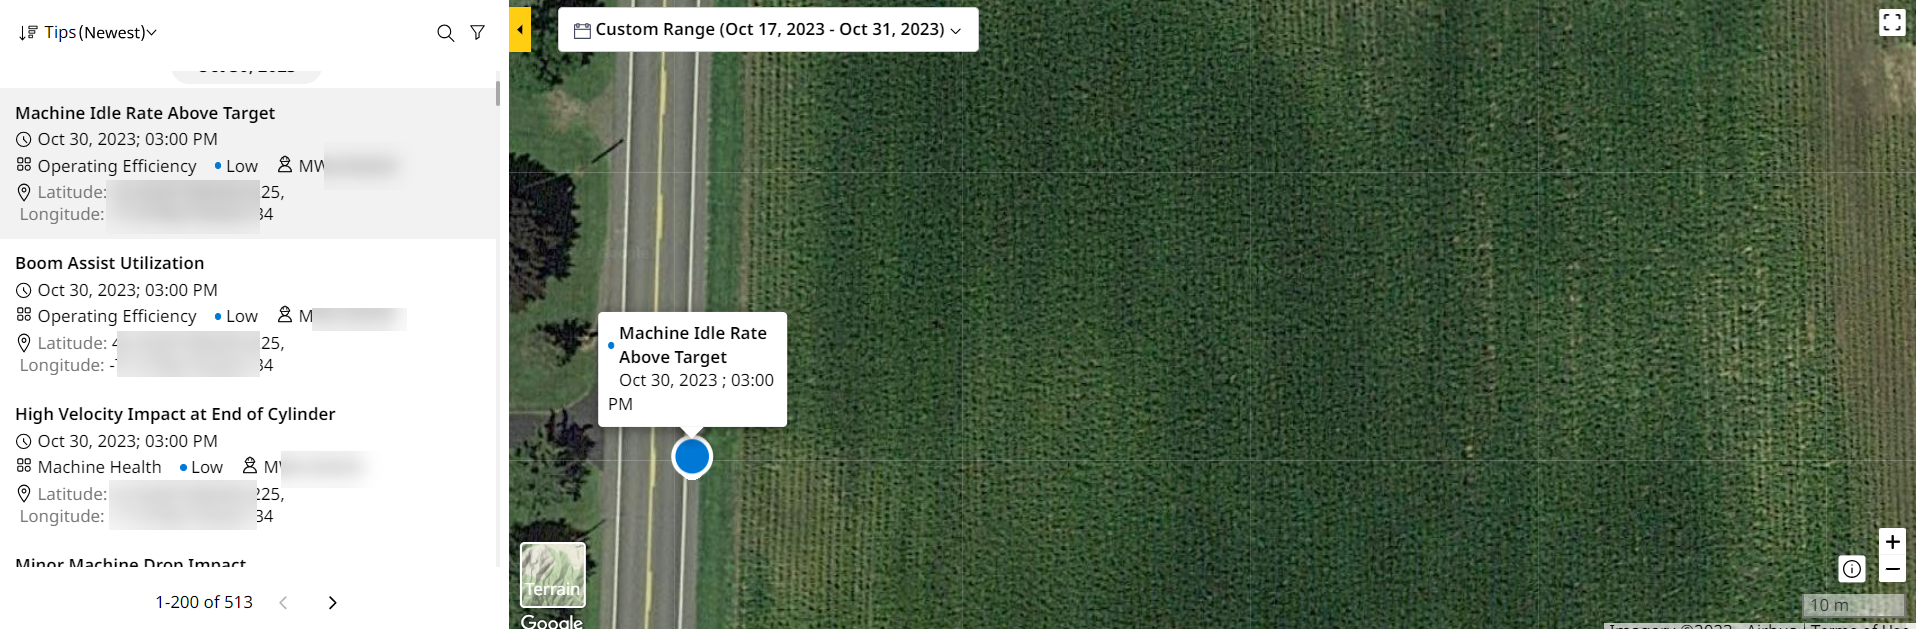
Date Range Selector: Allows selection of Today, Yesterday, Last 7 Days or a Custom Range.
-
Sort by: Narrow down the information you want to see by the following parameters:
-
Newest: Sorts data from the most recent time to the earliest.
-
Oldest: Sorts data from the earliest time to the most recent.
-
A to Z: Sorts data in ascending alphabetical order.
-
Z to A: Sorts data in descending alphabetical order.
This is only available when selecting Cycles. -
-
Search: Find tips by tip name. Enter a minimum of three characters to auto-populate search results.
This is only available when selecting Coaching. -
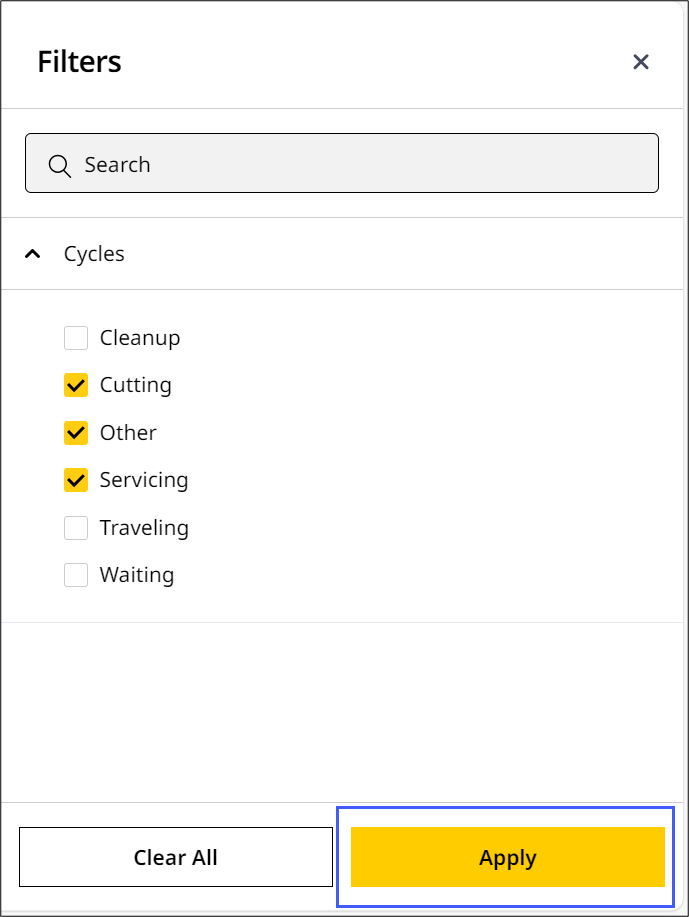
Filters
 : Streamline available data to focus only on what matters to you. With filters, you can do the following:
-
Search for or select the corresponding drop down to view the required filters.
-
Check the interested filters and click Apply.
-
The filters display as chips. The filtered information displays in the slider pane and on the map.
-
Click close
 to remove the filter chip(s).

-
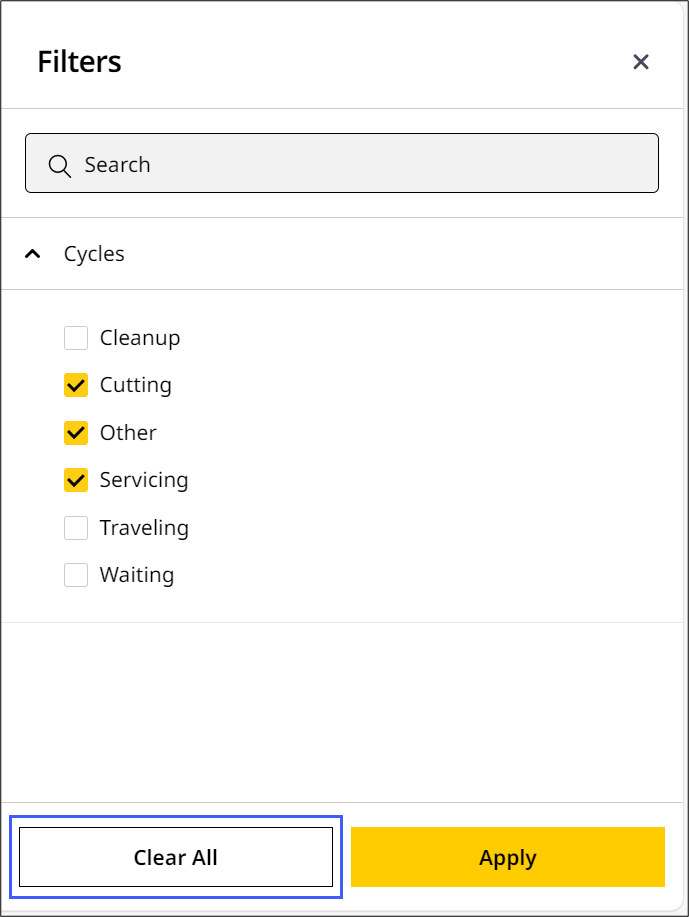
Alternatively, return to Filters and select Clear All to remove all checked filters.
For Cycles, you can apply only a maximum of 10 filters at one time.
-
-
Slider Pane
 : The slider pane will display the following tabs:
 -
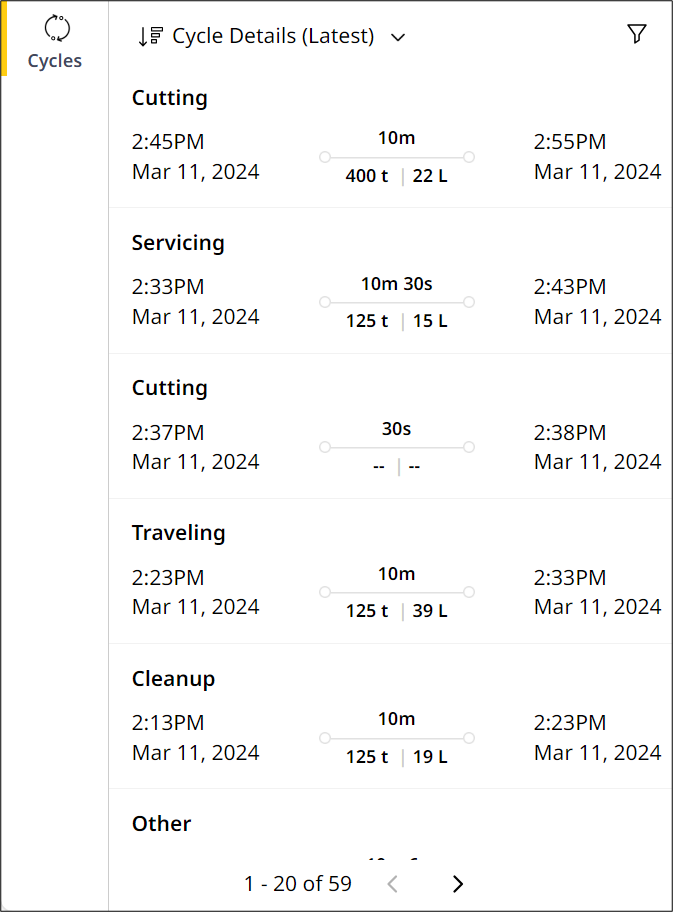
Cycles
 : View all cycle details for your asset during the selected date range.
• Cycles is available only for the following asset types, subscribed to Advanced Productivity:
° Articulated trucks
° Cold planers
° Motor graders
° Off-highway trucks
° Track excavators
° Wheel loaders
° Scrapers
• For a single day selection, toggle Plot all cycles on to view all segments of a cycle on map. This is available only for the following product families:
° Cold planers
° Motor graders
° Pavers
View ImageView Image
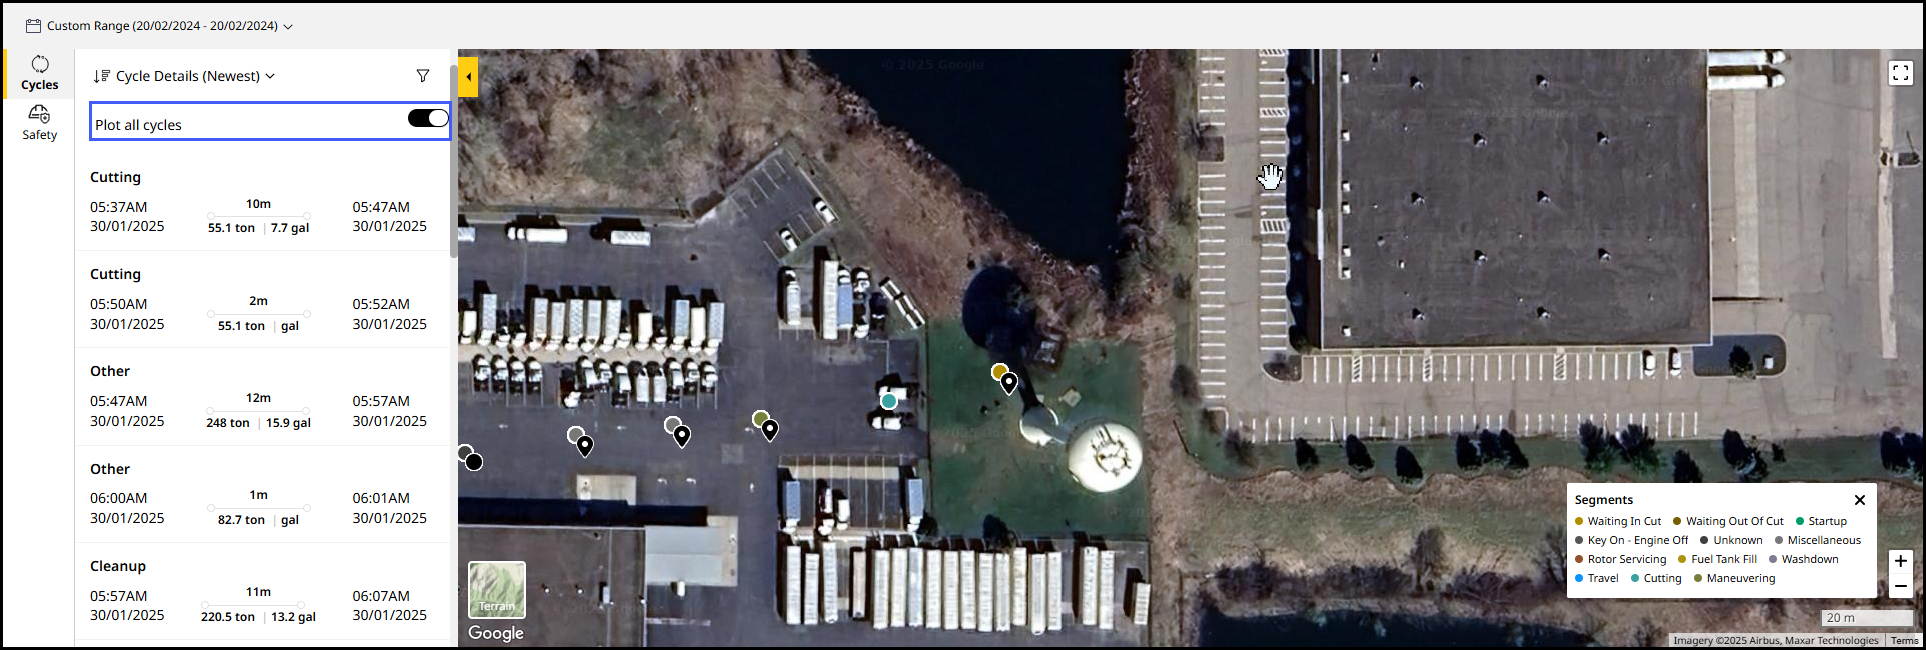
Map (Asset) data displays in two forms:
-
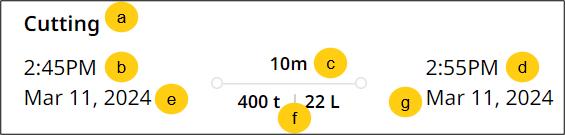
As a list, detailing each cycle with the following details:
-
Cycle name
-
Cycle start time
-
Cycle duration
-
Cycle end time
-
Cycle start date
-
Quantum of work performed (weight, density, etc.) based on your set Preferences.
-
Cycle end date
-
-
As asset icons and colored dots on a map. You can find the following details:
-
Click the asset icon to view its Last Reported date and time.
-
Click start location to view cycle start time and the starting latitude and longitude.
-
Click start location
 to view cycle start date and time. It also displays the starting latitude and longitude.
 -
Click end location
 to view cycle end date and time. It also displays the ending latitude and longitude.
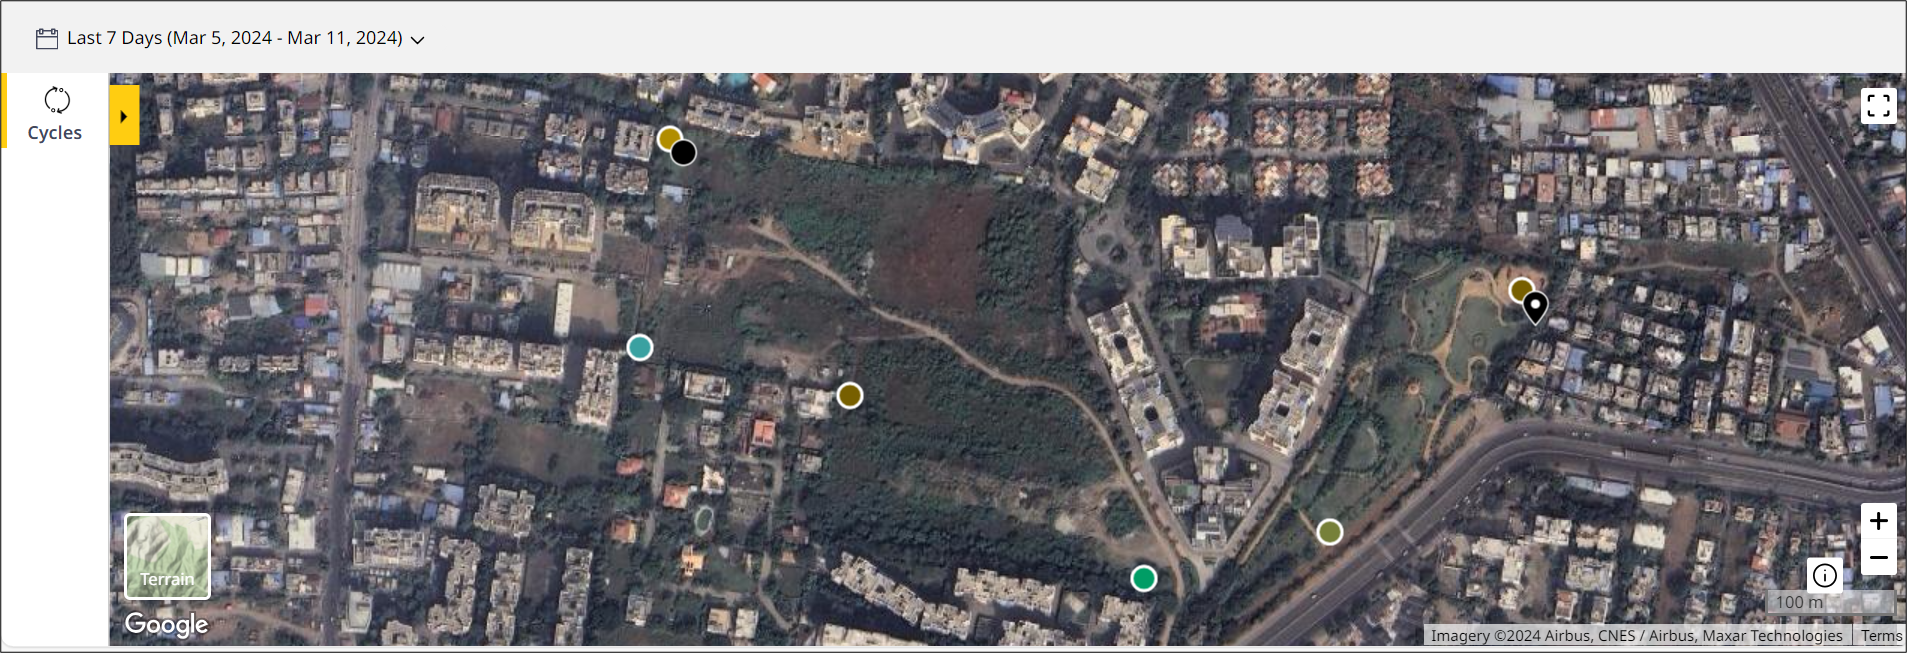
If the start and end location of the cycle are within 50m or less, only end location displays on the map. Click to view both start and end location details. -
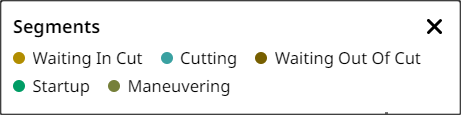
View different segment types indicated by different colored dots. Click information
 on the bottom right. This displays the Segments legend listing the segments (the following image is a legend for cold planers):
Quickly navigate to Production (Site) when viewing cycle details by clicking the back button .
.
-
-
-
Coaching
 : View all coaching tips received by your asset's operators for the selected date range.
Map (Asset) data displays in two forms:
-
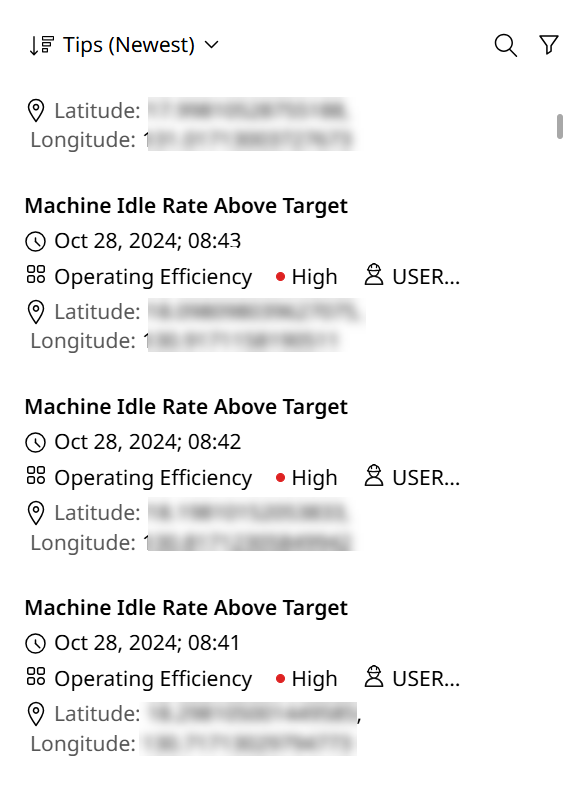
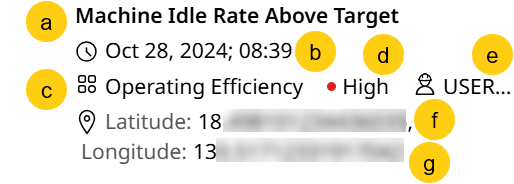
As a list, detailing each cycle with the following details:
-
Tip name
-
Date and time when tip appeared on asset display as per set Preferences
-
Tip category
-
Tip severity
-
Operator logged in who received the tip on the asset display
-
Latitude coordinates where tip appeared on asset display
-
Longitude coordinates where tip appeared on asset display
-
-
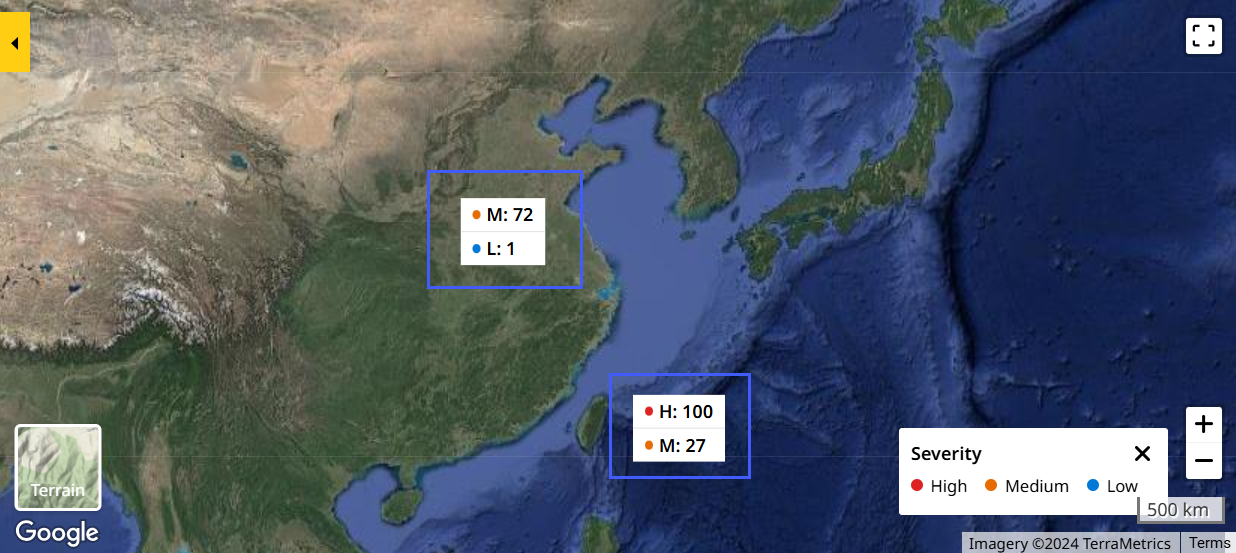
As colored dots (or collection of dots) on a map. You can find the following details:
-
Each dot represents a spot where a tip event occurred.
-
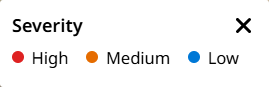
The color represents the severity of tip (from Low to High). The Severity legend below provides a handy guide to distinguish what each color represents.
-
When zooming out or if multiple tips occurred close to each other, view tips combined into one hotspot. Select each to zoom in further detail. They'll be denoted as H (for High), M (for Medium) or L (for Low) with the respective counts for each shown as well.
Quickly navigate to Production (Site) when viewing coaching details by clicking the back button .
-
-
-
Safety
 : View all safety events triggered by the asset for the selected date range across two tabs: Seat Belt and Detect.
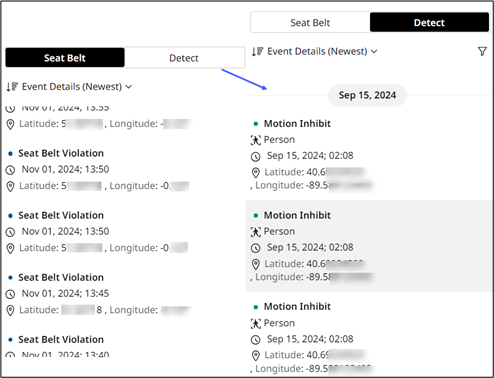
Map (Asset) data displays in two forms:-
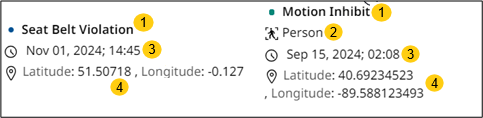
As a list, detailing each cycle with the following details:
-
Event name
-
Detect action type (only applicable when selecting Detect)
-
Date and time when the event occurred as per set Preferences.
-
Latitude and longitude coordinates where event occurred.
-
-
As colored dots (or collection of dots) on a map. You can find the following details:
-
Each dot represents a spot where a safety event occurred.
-
For Seat Belt and Detect, the colors for each event are demarcated by the legend below. Click info
to display this.
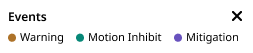
-
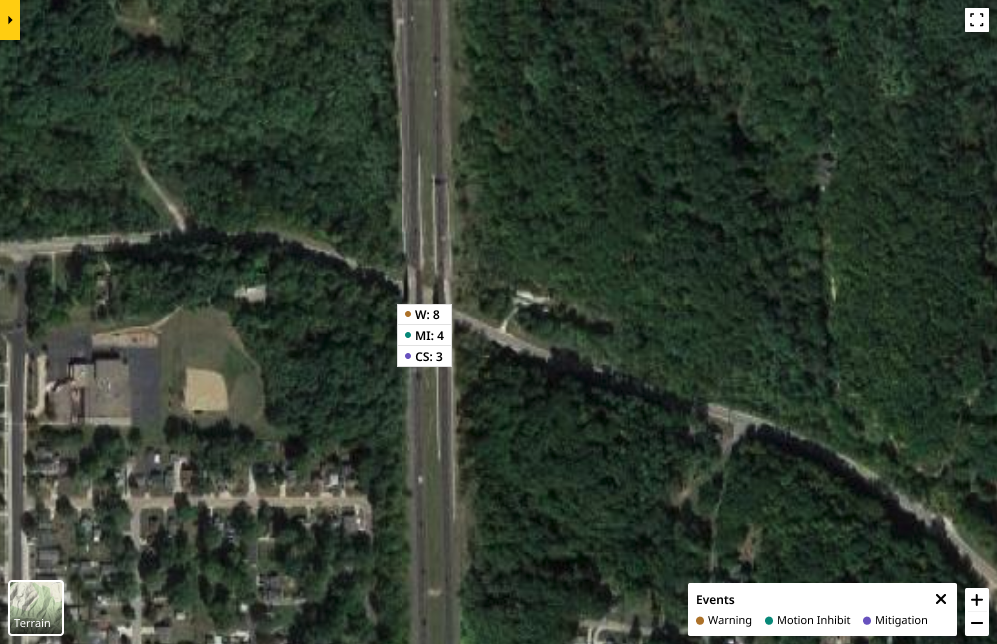
For Detect, when zooming out or if multiple detect action events occurred close to each other, view them combined into one hotspot. Select each to zoom in further detail. They'll be denoted as W (for Warning), MI (for Motion Inhibit) or M (for Mitigation) with the respective counts for each shown as well.
Quickly navigate to Safety (Site) when viewing safety details by clicking the back button .
-
-
-
Satellite/Terrain View: Displays the map in
 or
or  form to view corresponding details and infer as per your requirements.
 -
Full Screen
 : Click to display the map in full screen for a more comprehensive view.
 -
Zoom In
 /Zoom Out
  : Select to zoom further into or out of the map.
-