Safety (Asset) Tab
With Safety (Asset), find out about how your asset is performing on vital safety metrics.

• This is only available to assets with a Performance or PerformancePro subscription.
• Not all assets report seat belt or detections. If you want to determine your assets’ capability, please Contact Support for help.

To learn more about the other tabs or the information above them, refer to Asset Details Dashboard.
-
KPI: Select from among the following safety KPIs to view corresponding chart, KPI card and tabular data:
-
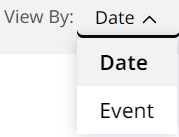
View By: Select from the following to determine how the chart and table view below will display and prioritize data:
This option is only available if you set KPI to Detect.-
Date: Categorized by date and time the detect action event occurred.
-
For a single day, i.e., Today, Yesterday or a single Custom Range date, this summarizes data on an hourly basis.
-
For date ranges of more than a single day (Last 7 Days or Custom Range), this summarizes data on a daily basis.
-
-
Event: Categorized by the detect action event type.
-
-
Date Range: Choose the date range to view the KPI data for the following time periods:
-
Today
-
Yesterday
-
Last 7 Days
-
Custom Range (Up To 31 Days Maximum)
-
-
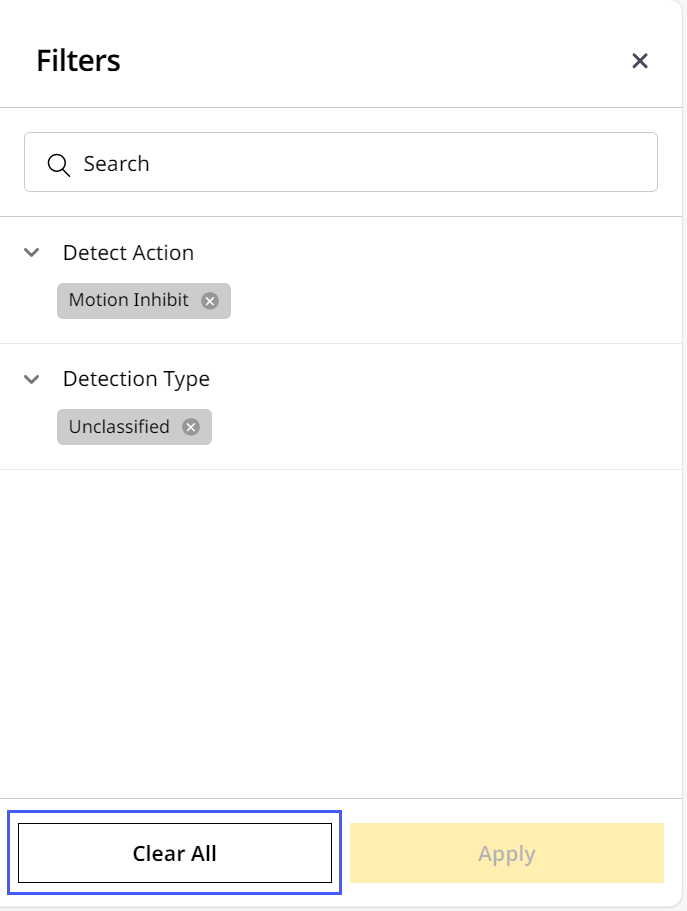
Filters
 : Prioritize the data you want to see by filtering it out. These filters will apply to the downloaded report as well. Narrow down the displayed safety event by the following categories:
-
Detect Action
-
Detect Type
This option is only available if you set KPI to Detect.Click Filters
to do the following:-
Search for or select the corresponding drop down to view the required filters.
-
Check the interested filters and click Apply.
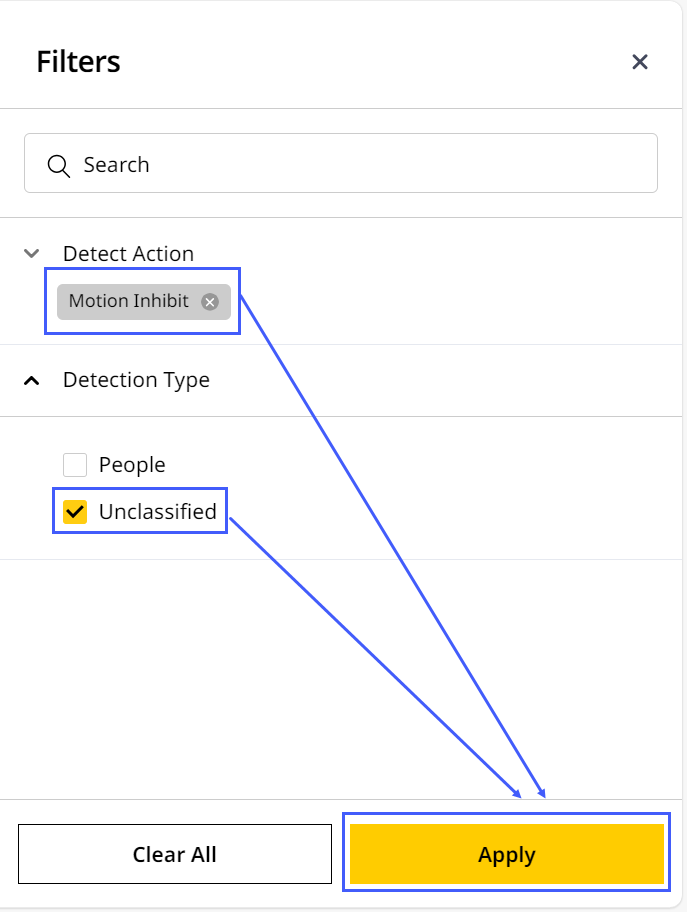
-
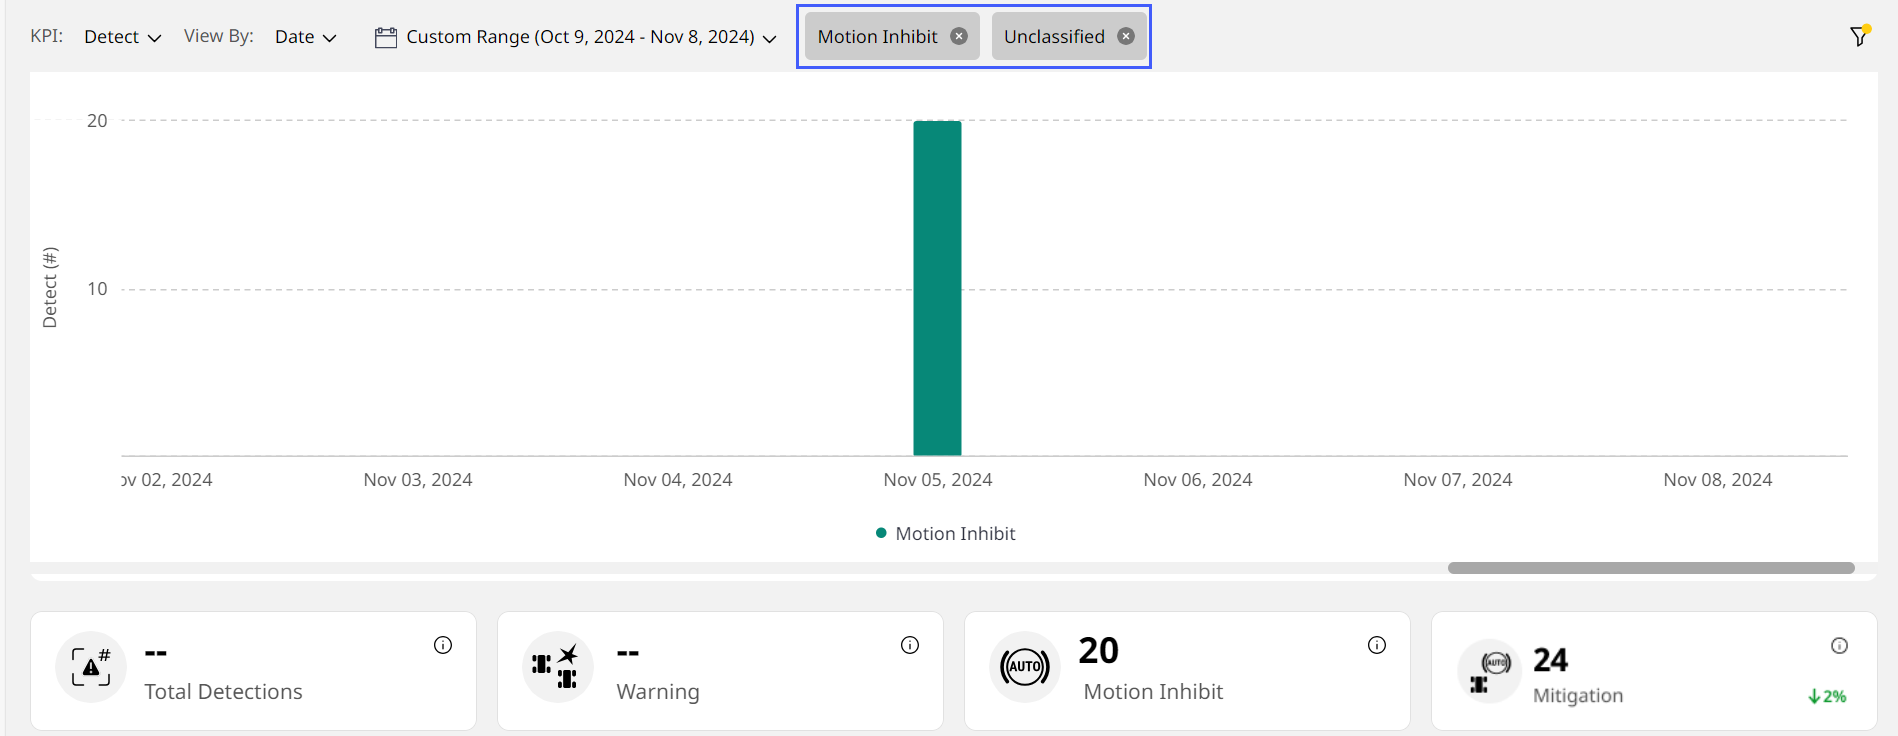
The filters display as chips next to the date range.
-
Click close
 to remove the filter chip(s).
-
Alternatively, return to Filters and click close there or select Clear All to remove all checked filters.
-
-
Chart View: Displays the data depending on KPI and date range selected in a visual format. This is in the form of column graphs.
• When selecting KPI as Detect, the graph columns will be multi-colored. View the legend or x-axis labels below to know what each detection event type the column color represents.
• Hover over any column to view its metrics at a glance.
View ImageView Image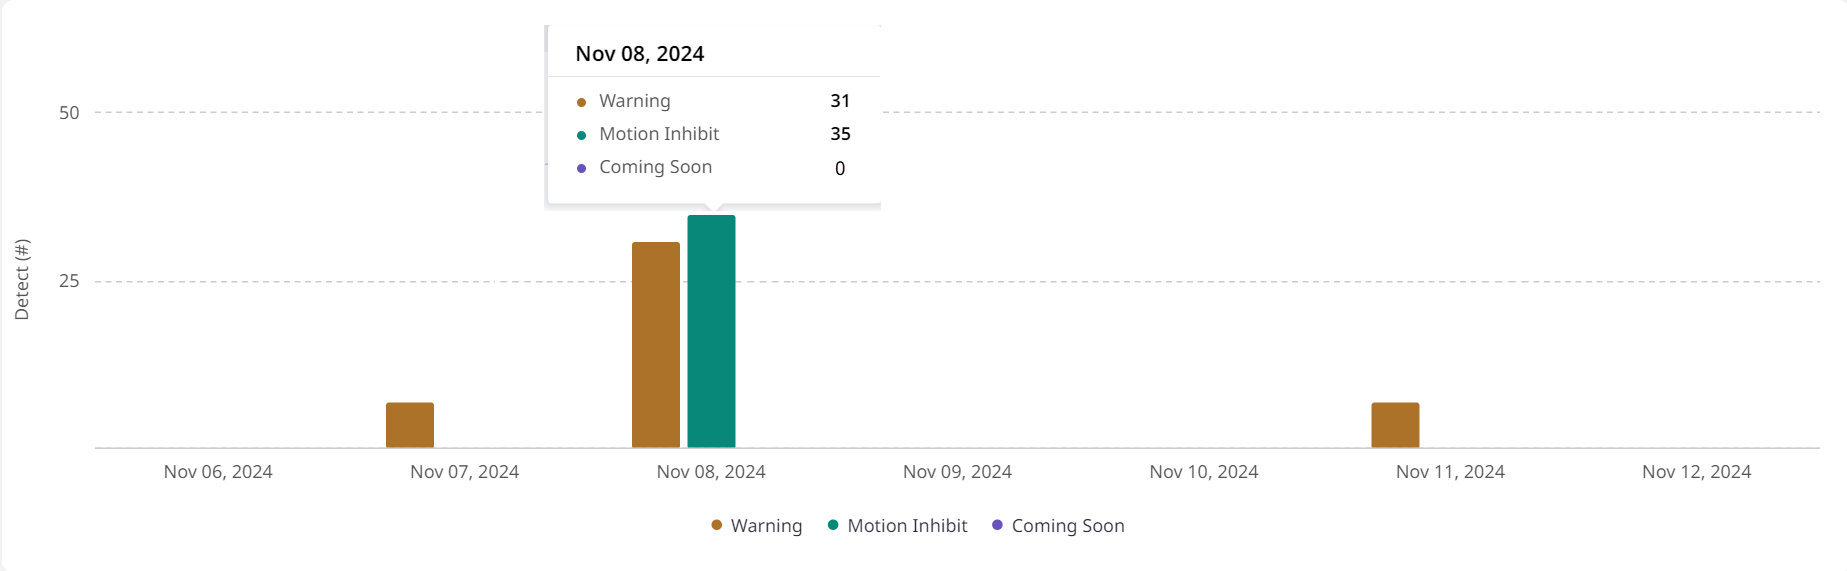
-
KPI Cards: Displays metrics related to the selected safety KPI to track and analyze at a glance.
Click info in a KPI card to view its definition. Click Learn More to visit the respective Help Center article providing more information on that KPI.
View ImageView Image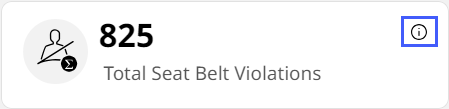
-
Table View: Lists down the day-wise data generated by the selected asset. Depending on the KPI, View By option and date range selected, it could be single or multiple days or events-worth of data housed under drop-down lists. Click expand
 to view each one.
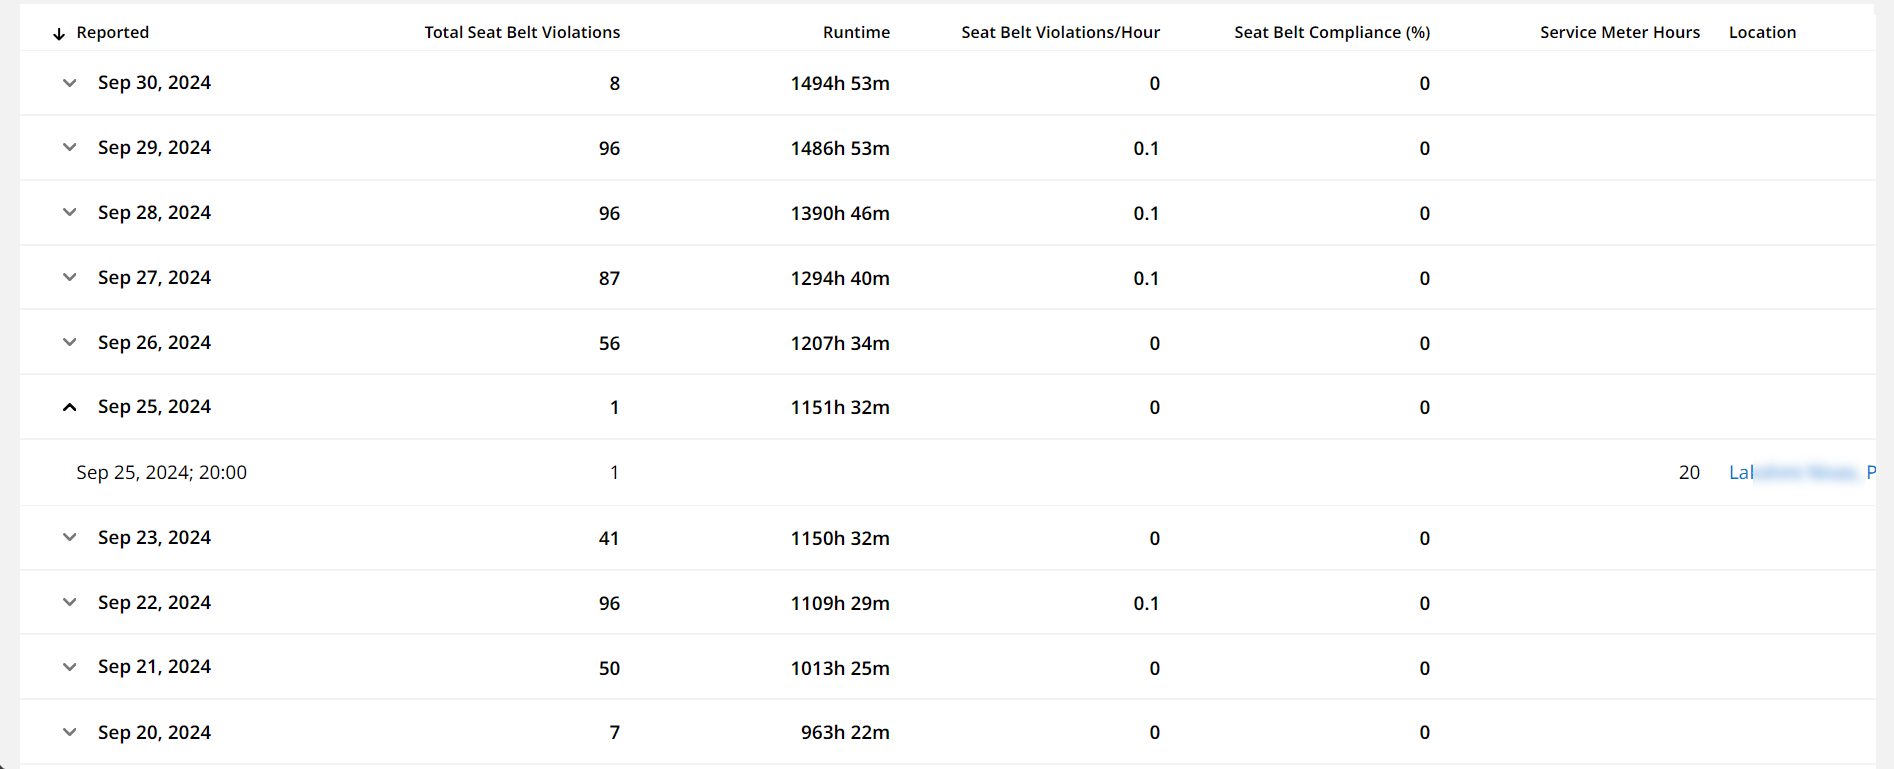

After expanding the drop down, you can find the Location details for each safety event. Click to display the event location on the map. To access all safety events for the asset on a map-wise basis, navigate to Map (Asset).
View ImageView Image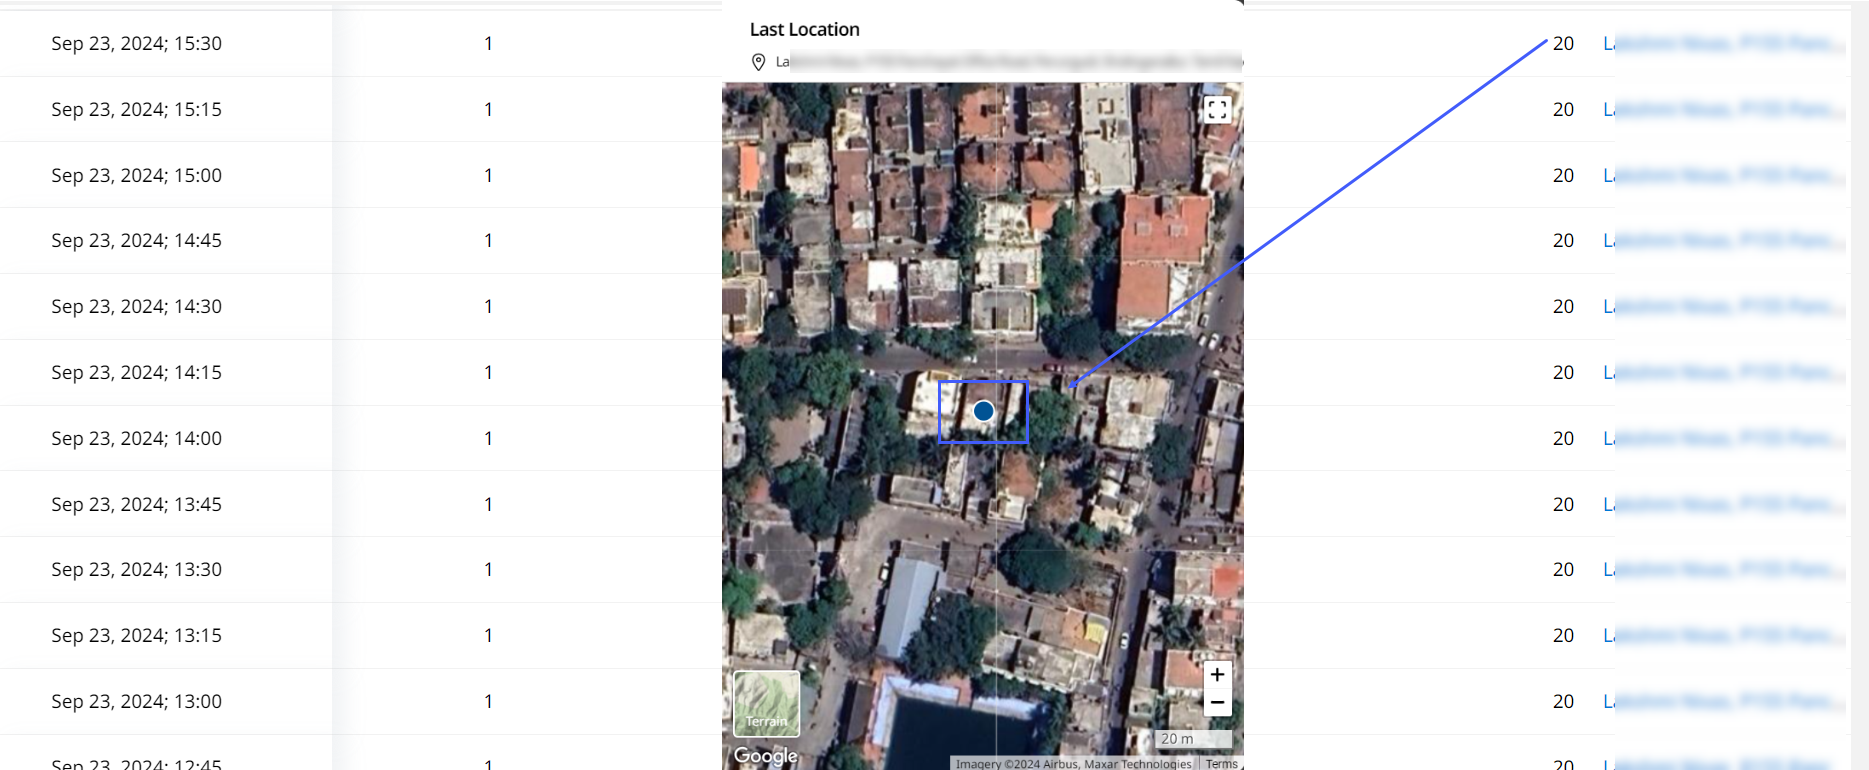
-
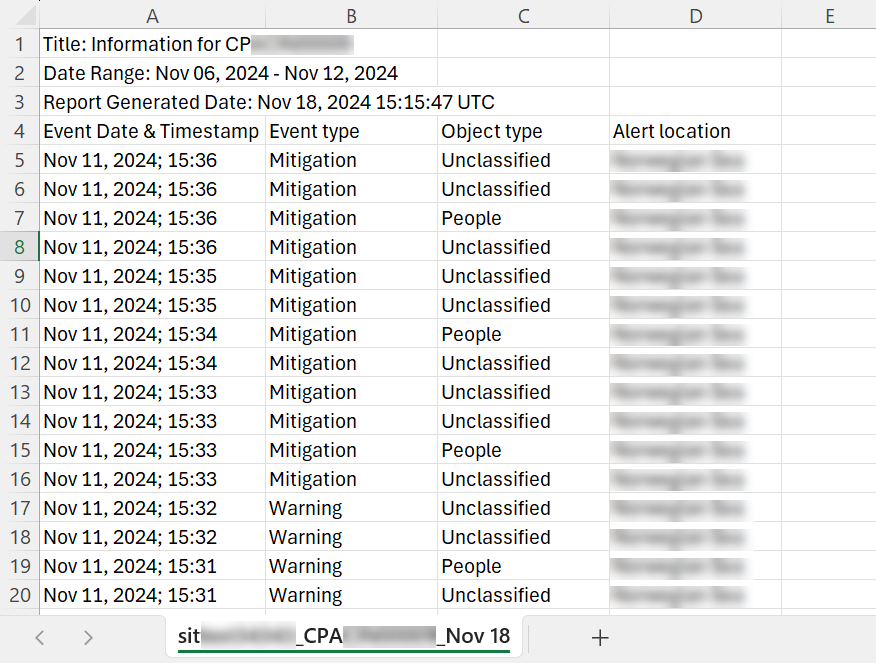
Download
 : Save the asset’s safety data to further share and analyze offline. The downloaded .csv file will be based on selected KPI, View By option, date range and configured columns. Here is a sample file:
-
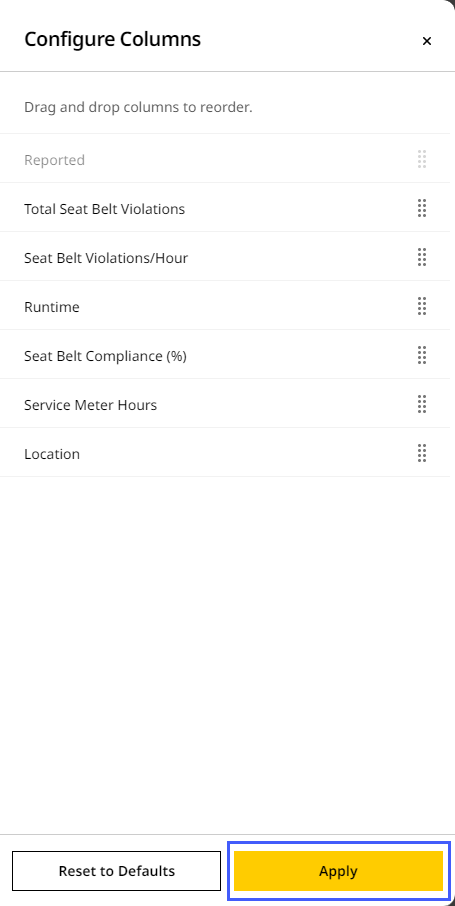
Configure Columns
 : Tick the columns you want displayed in Safety (Asset) table view.
Depending on the KPI and View By option selected, the columns available to configure will change.You can also click and drag rearrange
 next to a column to modify the display order for easier viewing. Click Apply to save the changes.