Coaching (Asset) Tab
Operator coaching tips are created onboard the asset to improve operator's knowledge. Navigate to Assets > Asset Details Dashboard to view these tips offboard the asset.
This helps you understand how your assets are used by the operators and analyze the following:
-
Tip rate, total tip count and operating hours.
-
Data sorted by date or tip name.
-
Severity and category details of the tips.
-
Location, date and time of where the tips occurred.

• To know more about the other Asset Details Dashboard tabs or the information above them, refer to Asset Details Dashboard.
• View operator coaching tips generated on assets belonging to the following product families:
◦ Next-generation hydraulic excavators
-
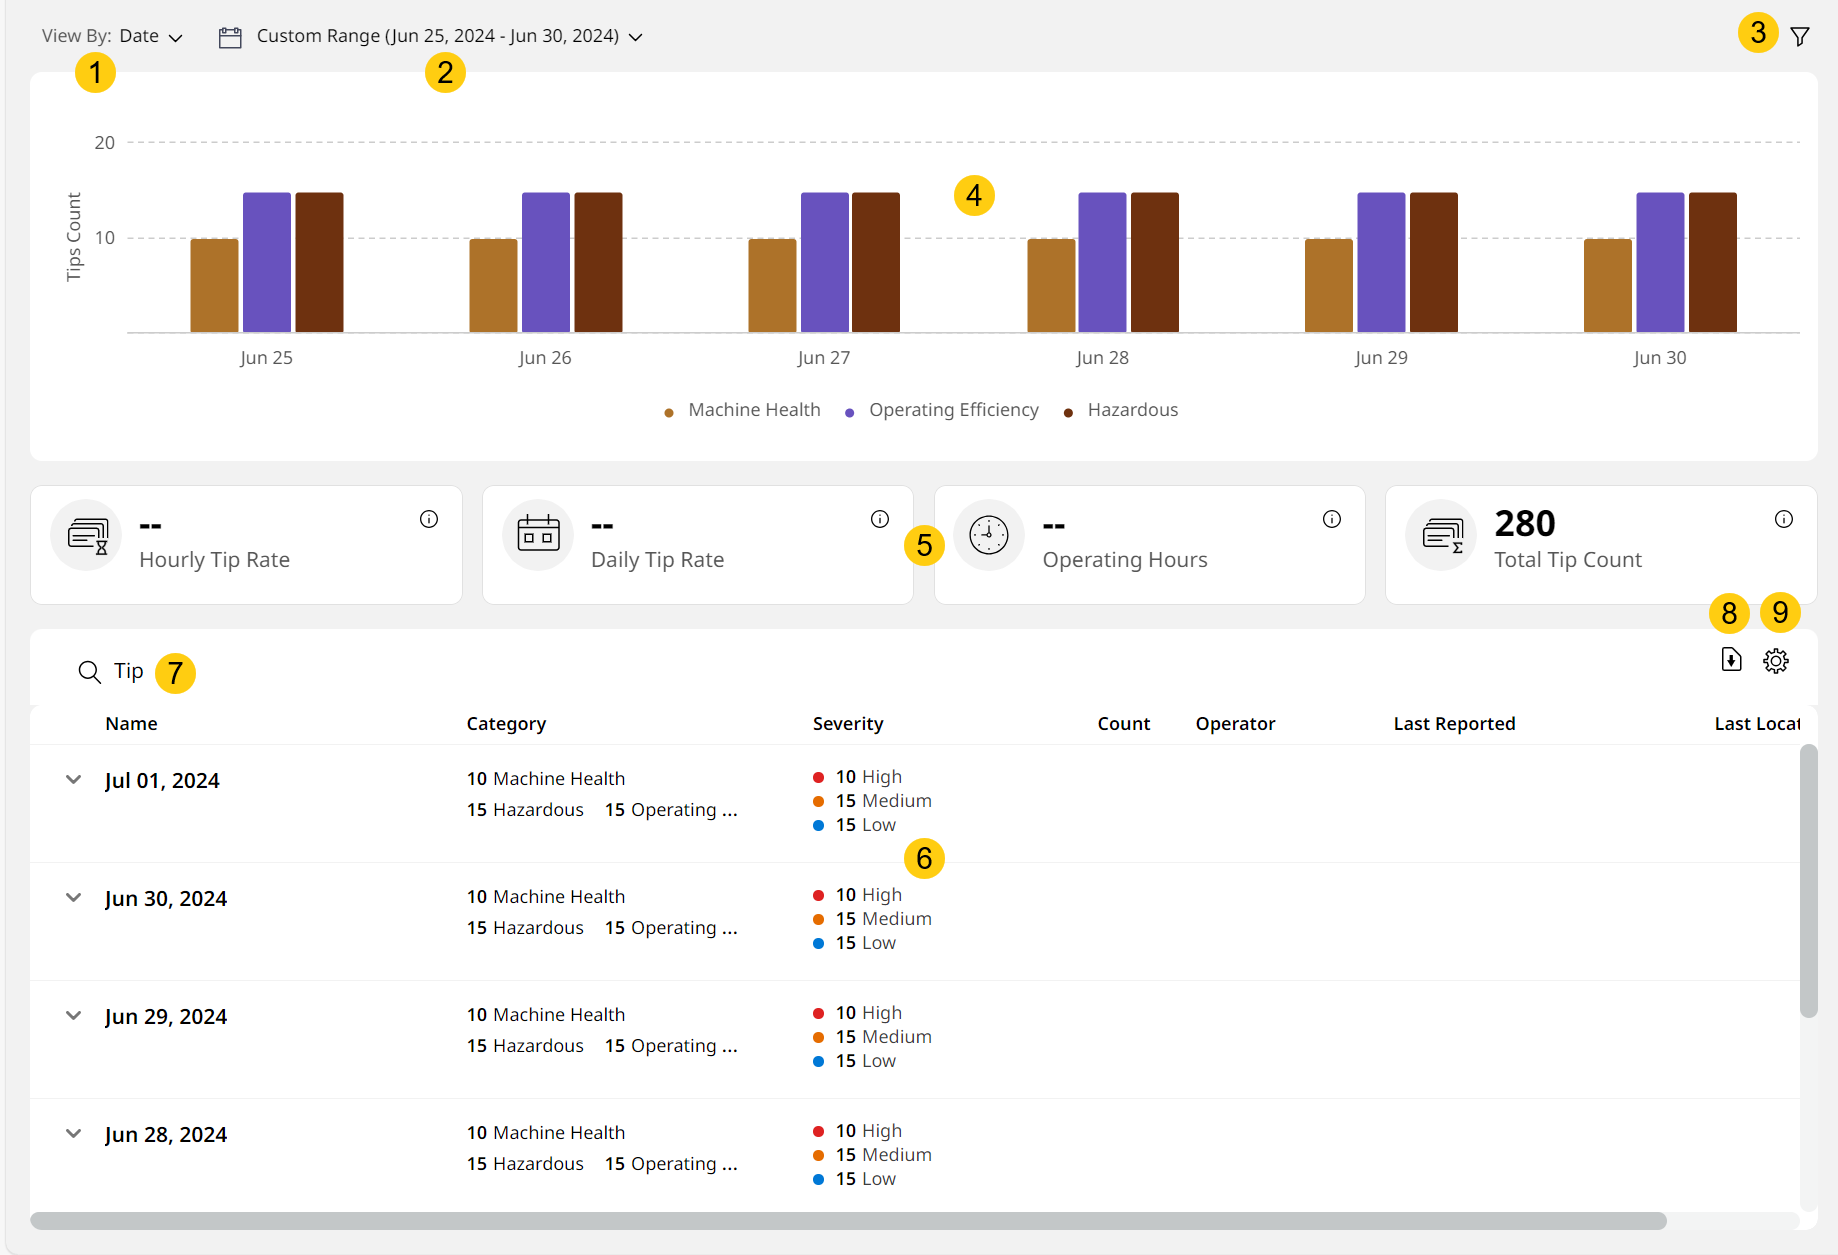
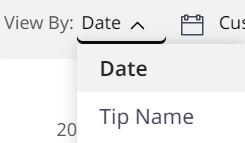
View By: Select from the following to determine how the chart and table view below will display and prioritize data:
-
Date: Categorized by date and time that tips occurred.
-
For a single day, i.e., Today, Yesterday or a single Custom Date, this summarizes data on an hourly basis.
-
For date ranges of more than a single day, this summarizes data on a daily basis.
-
-
Tip Name: Categorized by the exact tip that the operator encountered.
-
-
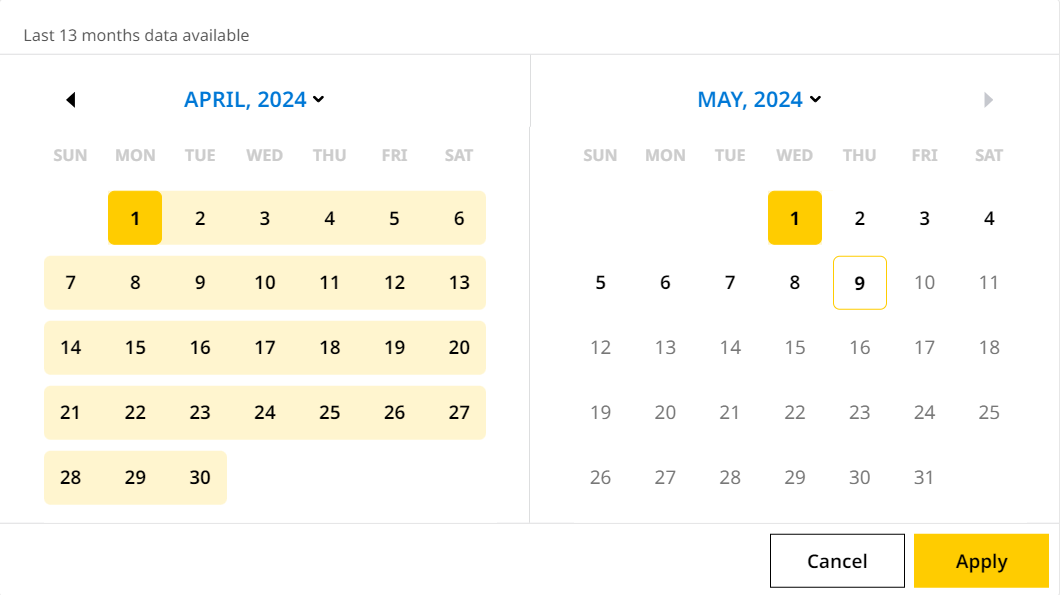
Date Range: View KPI data for the following time periods (across a range of 13 months):
-
Today
-
Yesterday
-
Last 7 days
-
Custom Range (up to 31 days)
-
-
Filters
 : Narrow the displayed data by the following criteria (varies according to what tips the operators have received on the site):
Click Filters
to do the following:-
Tip Name
-
Category
-
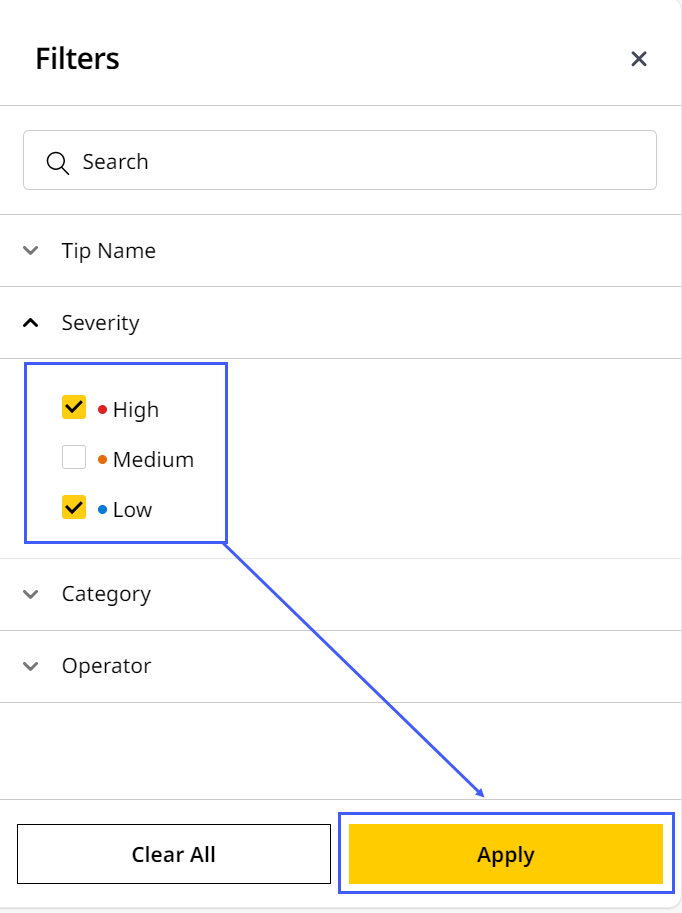
Severity
-
Search for or select the corresponding drop down to view the required filters.
-
Check the interested filters and click Apply.
-
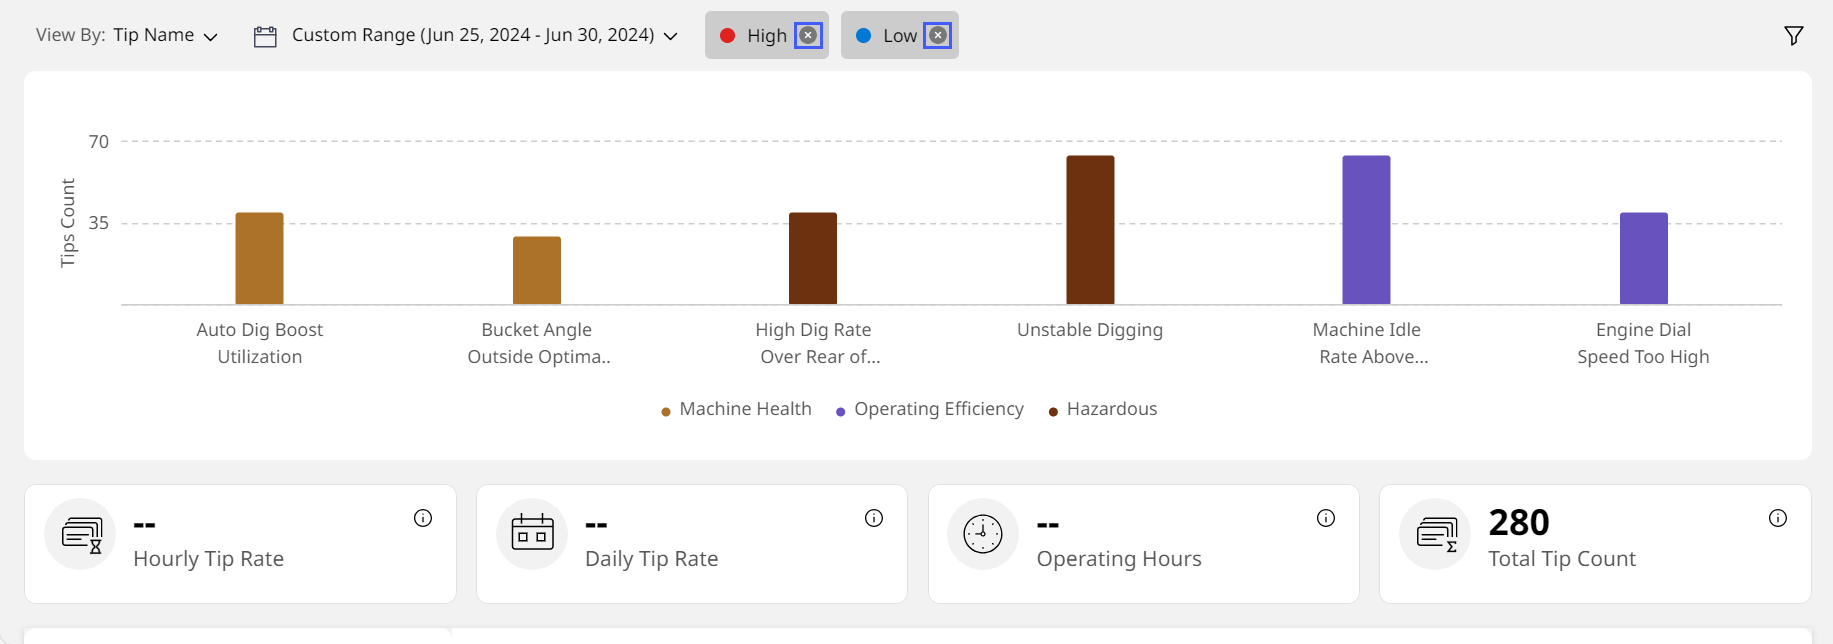
The filters display as chips next to the date range.
-
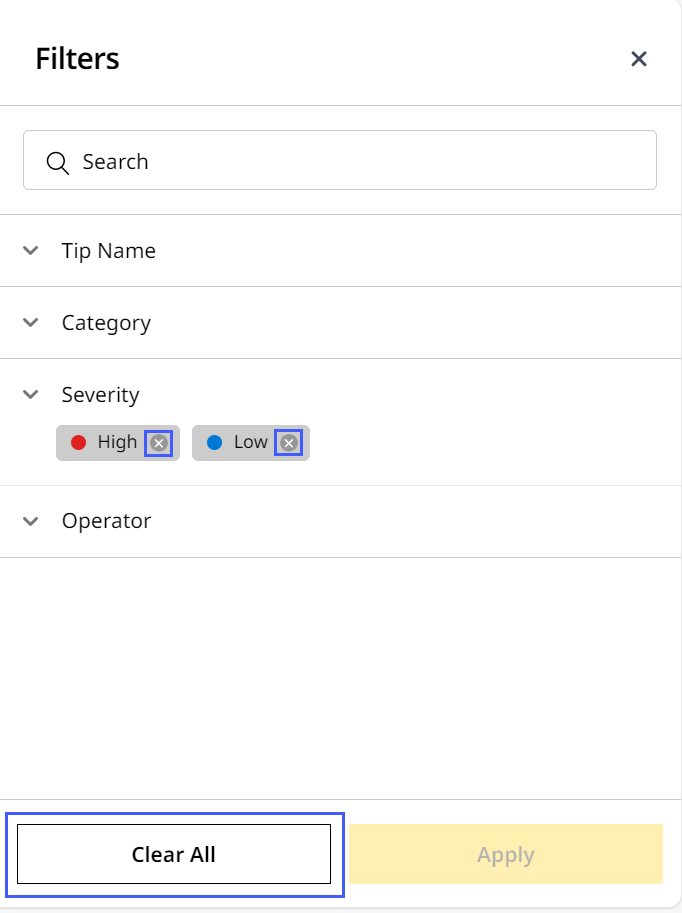
Click close
 to remove the filter chip(s).
-
Alternatively, return to Filters and click close
there or select Clear All to remove all checked filters.
-
-
Chart View: View and measure tip data as column charts based on View By option set above and date range selected. Hover over a column to know more.
-
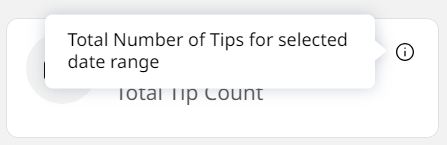
KPI Cards: Track and analyze tip-related KPIs at a glance.
• Click info in a KPI card to view its definition.
View ImageView Image
• Depending on the View By option selected, the displayed KPI cards will change. Refer to Coaching (Asset) KPIs to know more. -
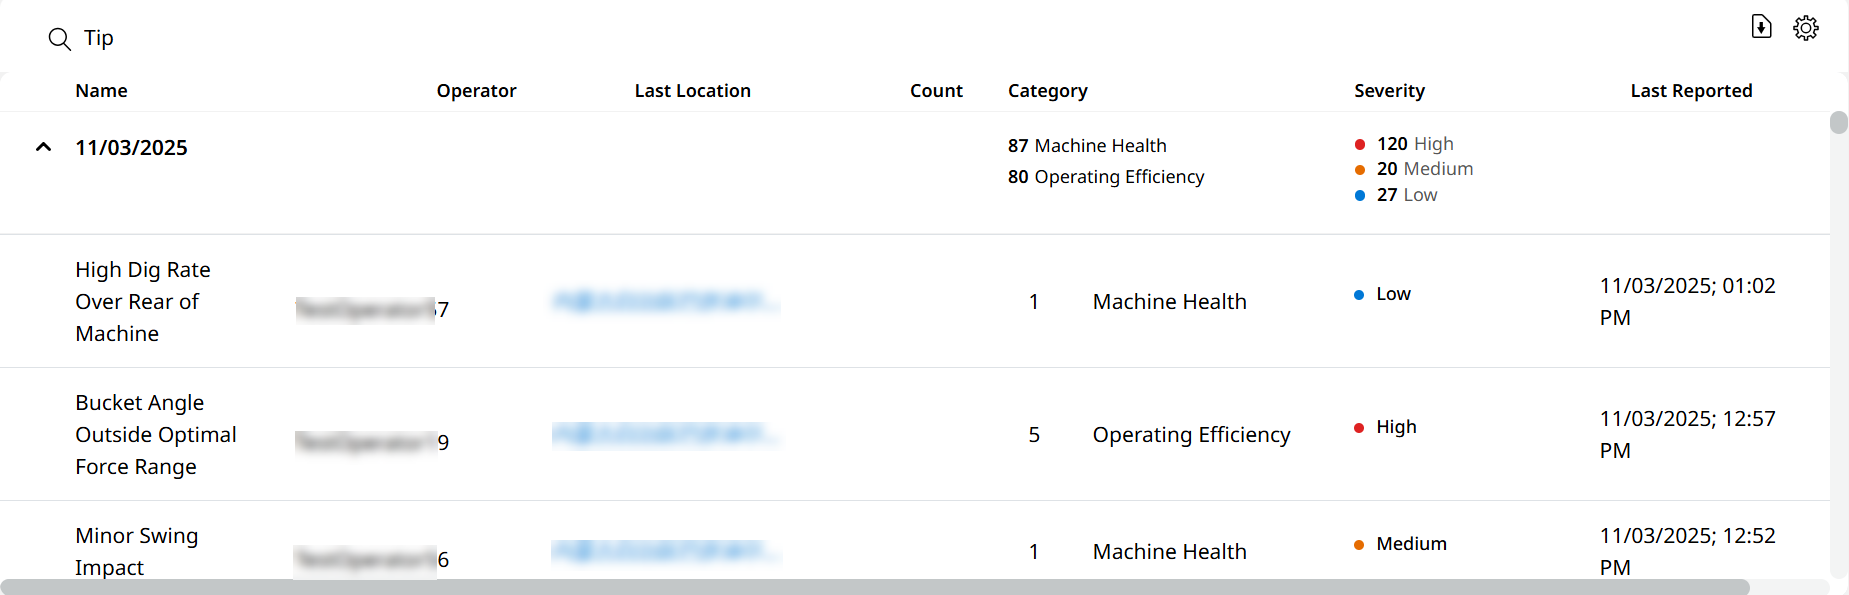
Table View: View tip data in tabular form for more in-depth analysis. This will be categorized into drop downs based on the View By option selected above.
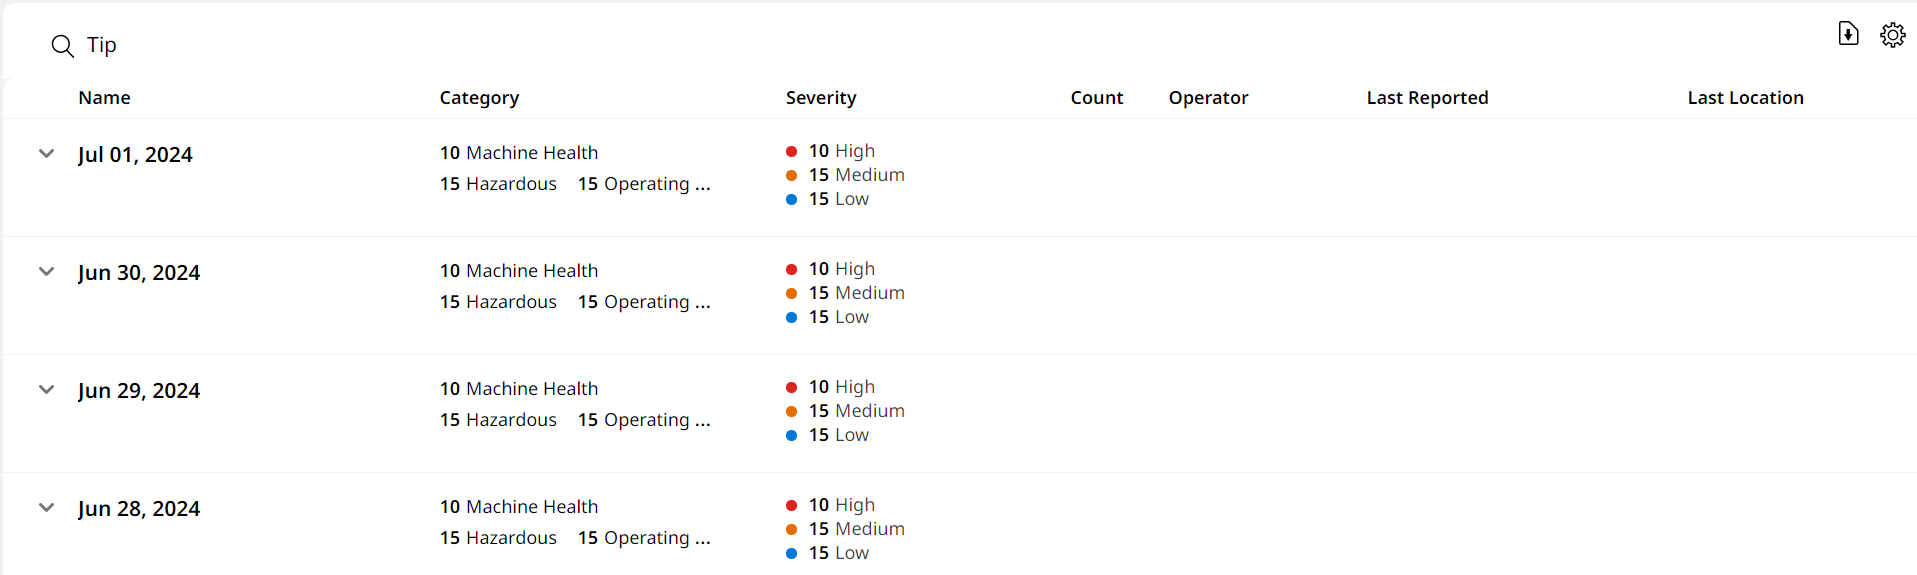
You can search for tips, download the data as a report, configure columns and more.
View and analyze the following columns on Coaching table view:
Column Name
KPI Card
Tip Name
Name of the tip created onboard the asset and displayed to the operator.
Category
The following categories that all tips fall under:
-
Operating Efficiency: Category associated with performance improvement opportunities. This type of tip could be improvement to production, decreased fuel burn and improved operator techniques.
-
Machine Health: Category associated to the health of an asset. This type of tip could be considered machine abuse and lead to the early failure of components or unscheduled downtime.
-
Hazardous: Category associated to asset, site or operator hazardous conditions. This type of tip could be unsafe or improper operating practices which could lead to hazardous conditions for an individual, asset, or site.
Also provides a count for each category based on selected View option and date range.
Severity
Severity levels displayed to help you prioritize corrective actions:
-
High (red)
-
Medium (orange)
-
Low (blue)
Also provides a count of the severity tips based on selected View By option and date range.
Count
Number of times the particular tip appeared during the selected date range.
Last Reported
Date and time when details of the displayed tip was shared to VisionLink Productivity.
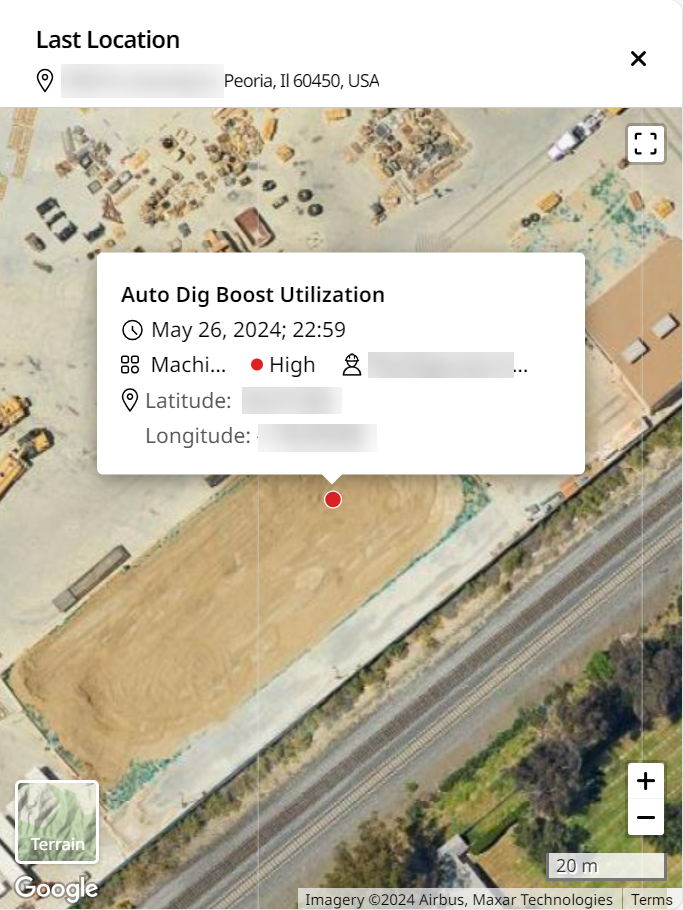
Last Location
Provides a map-based visualization where the tip incident occurred along with its details.
-
-
Search: Find tips using their name. Enter a minimum of three characters to auto-populate search results.
-
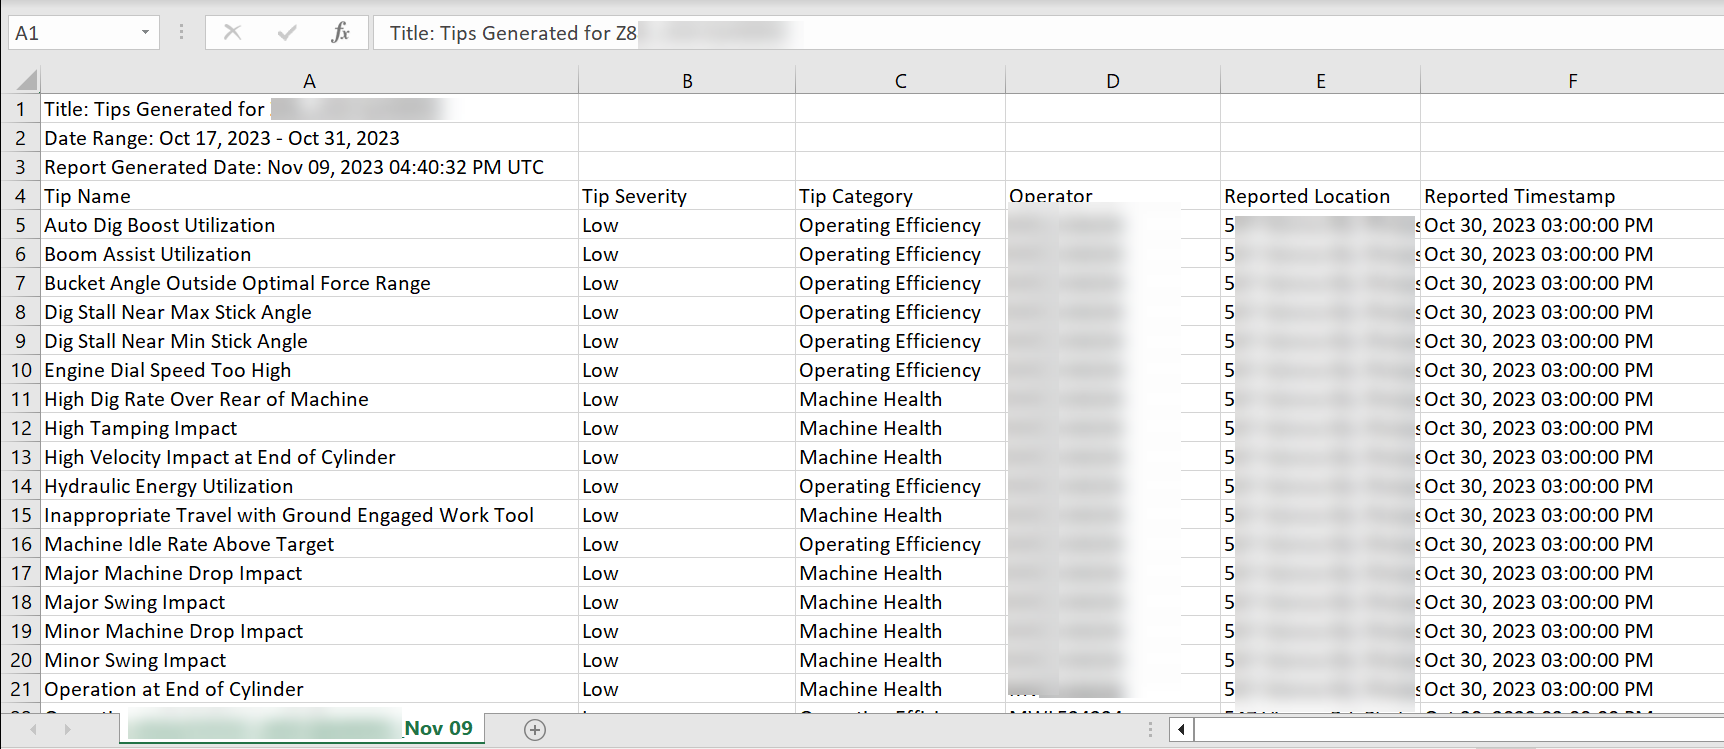
Download
 : Save the following tips data of the asset as a .csv file based on selected date range and configured columns:
Here is a sample report:
-
Tip name
-
Tip severity
-
Tip category
-
Reported location
-
Reported timestamp
-
-
Configure Columns
 : Click and drag rearrange
  next to a column title to modify the order it displays in, as per your preference. Select Apply to preserve changes or Reset to Defaults to go back to the earlier setting.
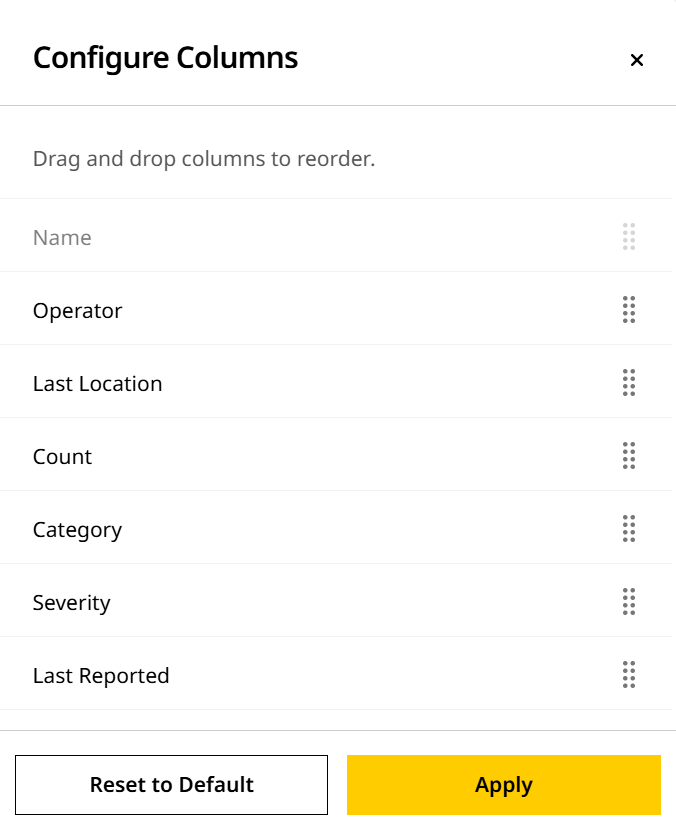
• Configure columns for each View By type to view the desired order of data.
• Downloaded reports retain the default column order and not the modified one.