- + jobsite
- acceptable use policy
- account
- add user
- android
- answer
- april 2020
- archive
- asset tags
- assets
- assign schedule
- august 2020
- august 2021
- august 2022
- Average
- body up switch
- browser
- carbon footprint
- card error
- change KPI
- chrome
- CO2 emitted
- cookie
- copy site
- copyright
- cost kpi
- cost setup
- cost tab
- create
- currency
- custom list
- cut/fill
- dashboard
- december 2019
- december 2020
- december 2021
- delete site
- delete user
- digital offering
- dollar
- edit site
- edit targets
- edit user
- euro
- exemption
- FAQ
- favorite
- february 2020
- fill/dump
- filter
- firefox
- fleet
- frequently asked questions
- geofence
- getting started
- grid
- guide
- help
- ID
- insights reports
- introduction
- ios
- january 2020
- january 2021
- january 2022
- july 2020
- june 2022
- KPI
- KPI hierarchy
- landing page
- legal
- list
- list summary views
- load site
- login
- logout
- machine
- map tab
- march 2021
- march 2022
- material
- material list
- may 2020
- may 2021
- may 2022
- measurement
- more option
- november 2021
- october 2020
- october 2021
- october 2022
- overview
- playback view
- policy
- preferences
- primary KPI
- production tab
- productivity
- productivity insights
- question
- remove site
- renminbi
- report management
- report type
- restore site
- review
- safari
- schedule
- select assets
- september 2020
- set name and location
- shift
- shift comparison report
- step 1
- step 2
- step 3
- step 4
- step 5
- stockpile
- summary tab
- support
- telematics
- total cost
- user
- visionlink
- walkthrough
- zones
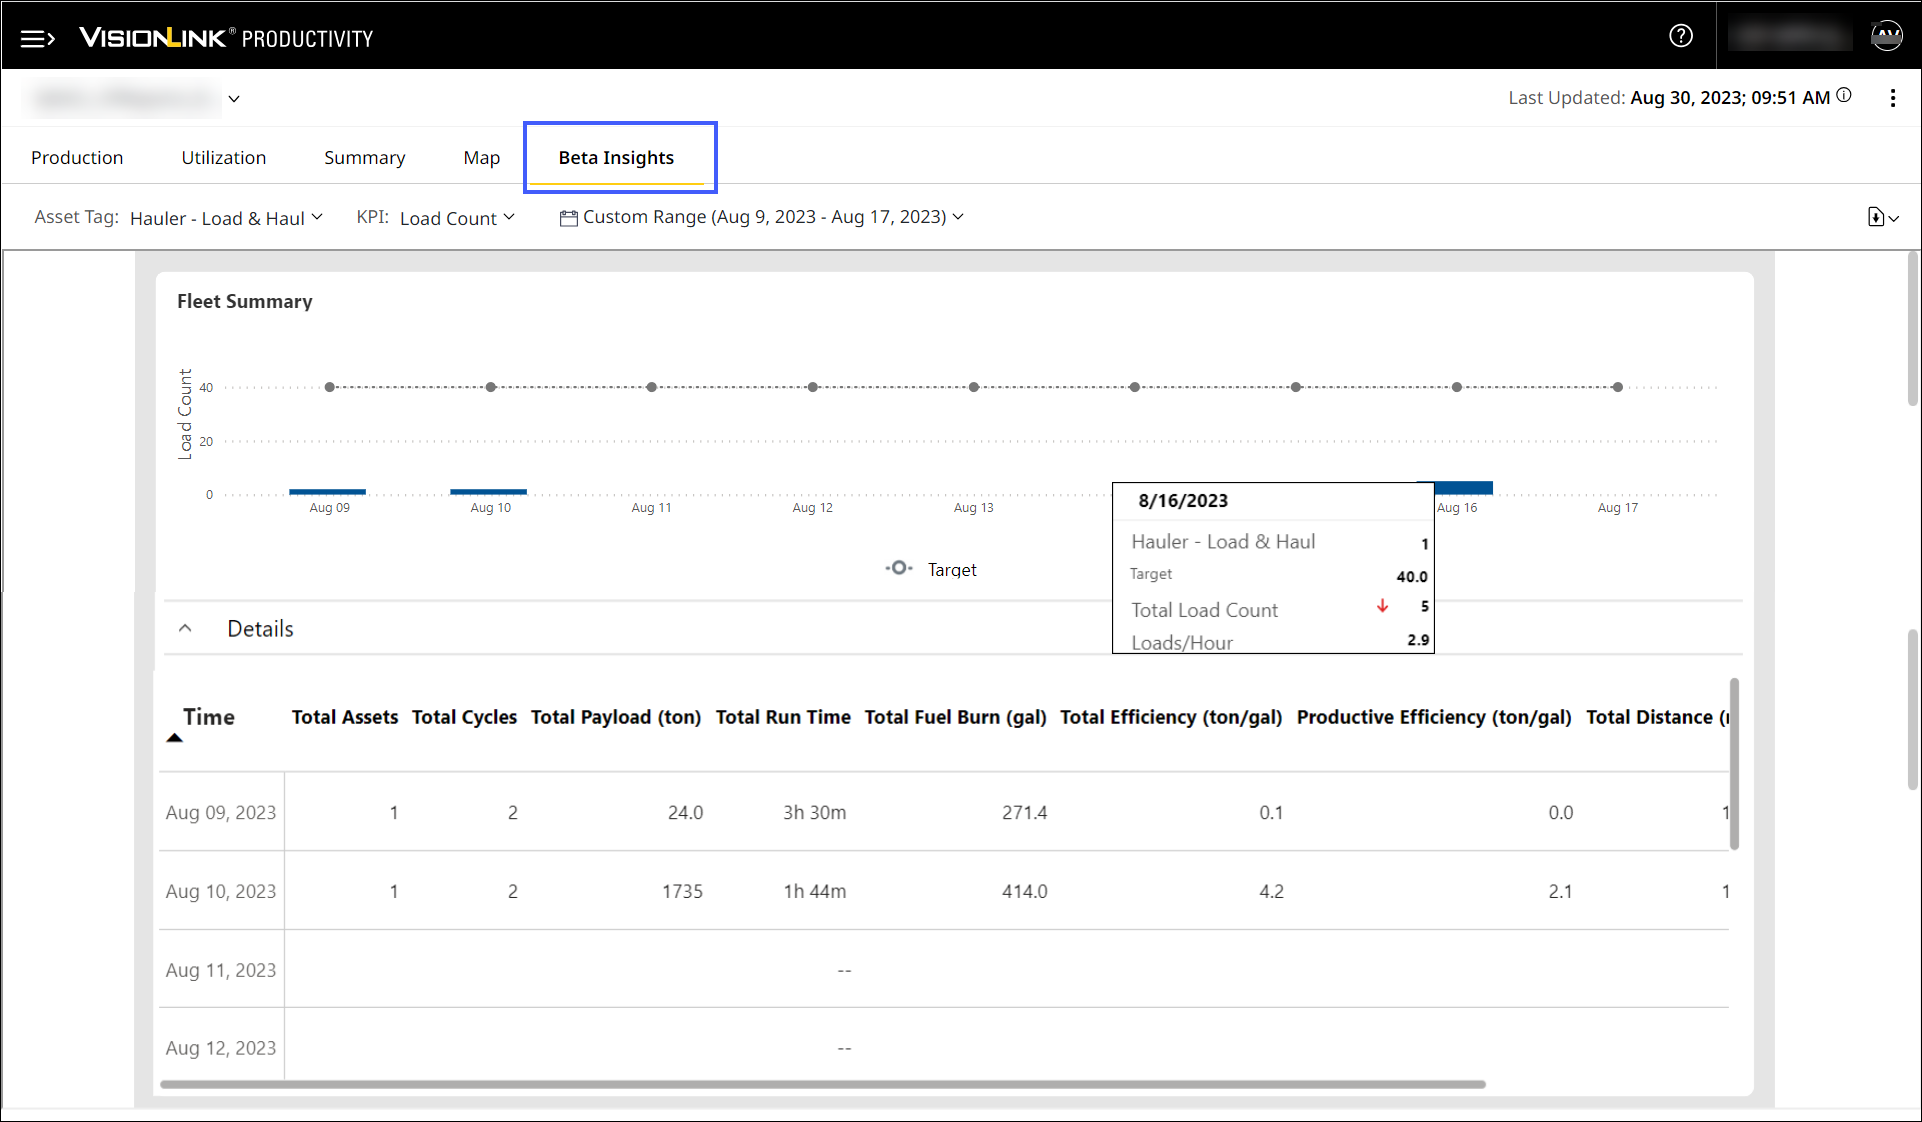
Beta Insights (Insights) Tab
With Beta Insights, view production data as Fleet Summary and Asset Summary charts.
This tab allows you to visualize and measure asset-wise and site-wise performance summaries. Quickly figure out if operations are according to plan or not.
Only the most vital details, presented in both chart and tabular form. Track them by asset tab, KPIs, or date range.
-
Fleet Summary: Displays production data as graphs based on the selected asset tag and Date Range.
-
You can change KPIs displayed using the Load Count, Payload and Volume options provided in the KPI drop down.
-
The x-axis shows the target date, based on selected date range and y-axis shows the asset tag.

The x-axis shows the time in hours only when you select for a single day.
-
-
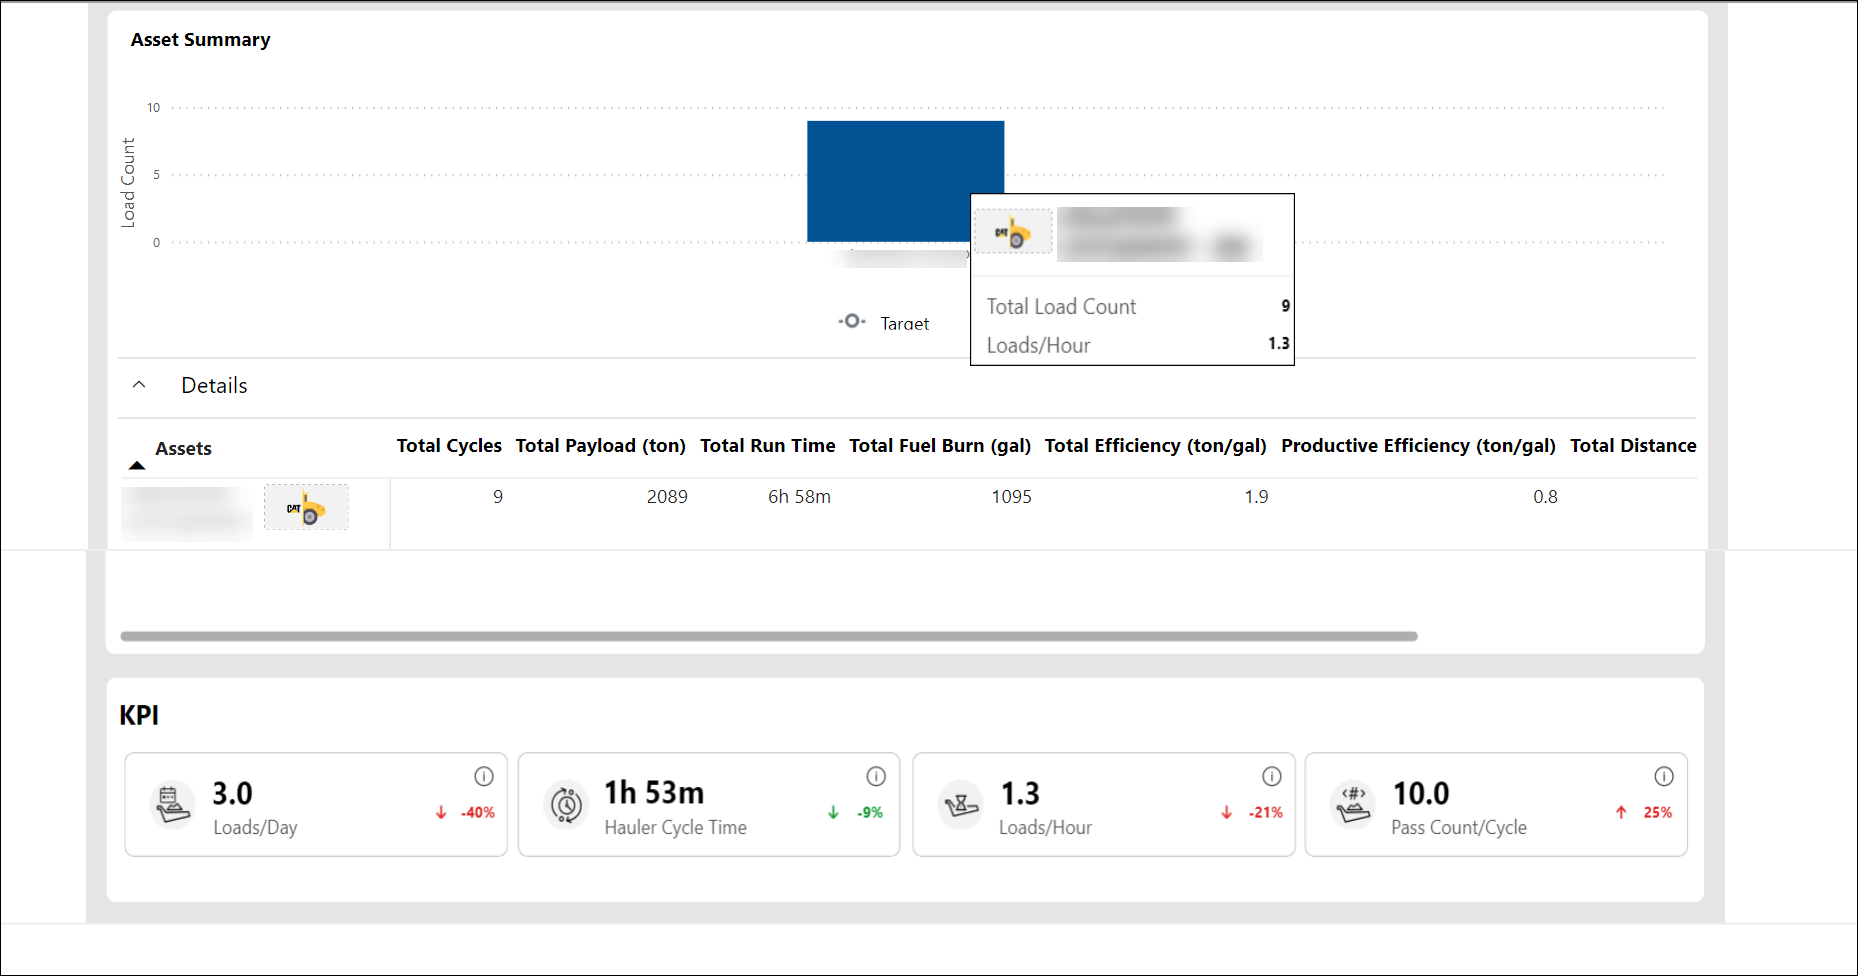
Asset Summary: Displays asset-wise production data as graphs based on the selected asset tag or date range.
-
You can change KPIs displayed using the Load Count, Payload and Volume options provided in the KPI drop down.
Volume is available only for Hauler ‒ Load & Haul and Scraper asset tags. -
The x-axis displays individual assets in order of asset serial number. The y-axis displays your selected KPI value.
-
-
Details: Provides a tabular representation of the following vital Fleet Summary and Asset Summary metrics:
-
Time
-
Total Assets
-
Total Cycles
-
Total Payload
-
Total Run Time
-
Total Fuel Burn
-
Total Efficiency
-
Productive Efficiency
-
Total Distance
-
Estimated Payload
-
-
KPI Cards: Display KPI values based on the selected asset tag and KPI type below the Asset Summary chart.
-
KPI Name: Serves to identify a KPI and its meaning.
-
KPI Value: Displays numerical values calculated based on selected asset tag and date range.
-
KPI Icon: Provides a visual representation of the KPI.
-
%+/%-: Shows either of the following:
-
Percentage increase
 (positive) or
  (negative) in comparison to the previous period.
 -
Percentage decrease
 (positive) or
  (negative) in comparison to the previous period.
-
-
Info
 : Provides information on calculation methodology and a link to know more, if required.
Utilization KPIs display if production KPI data is not available for that site.The following KPIs are available for each asset tag:
Asset Tag KPI
KPI Card Hauler –Load & Haul Load Count Loads/Day Hauler Cycle Time Loads/Hour Pass Count/Cycle Payload Hourly Production Hauler Cycle Time Payload/Cycle Total Payload Volume
Hourly Production Hauler Cycle Time Volume/Day Total Volume Loader – Load & Haul Load Count Loads/Day Hauler Load Time Loads/Hour Loader Cycle Time Payload Hourly Production Loader Cycle Time Payload/Cycle Total Payload Load Out Load Count Cycles/Load Load Out Cycle Time Cycles/Hour Pass Count Payload Hourly Production Load Out Cycle Time Payload/Cycle Total Payload Scraper Load Count Loads/Day Scraper Cycle Time Loads/Hour Scraper Load Time Payload Hourly Production Scraper Cycle Time Payload/Cycle Total Payload Volume Hourly Production Scraper Cycle Time Volume/Day Total Volume -
-
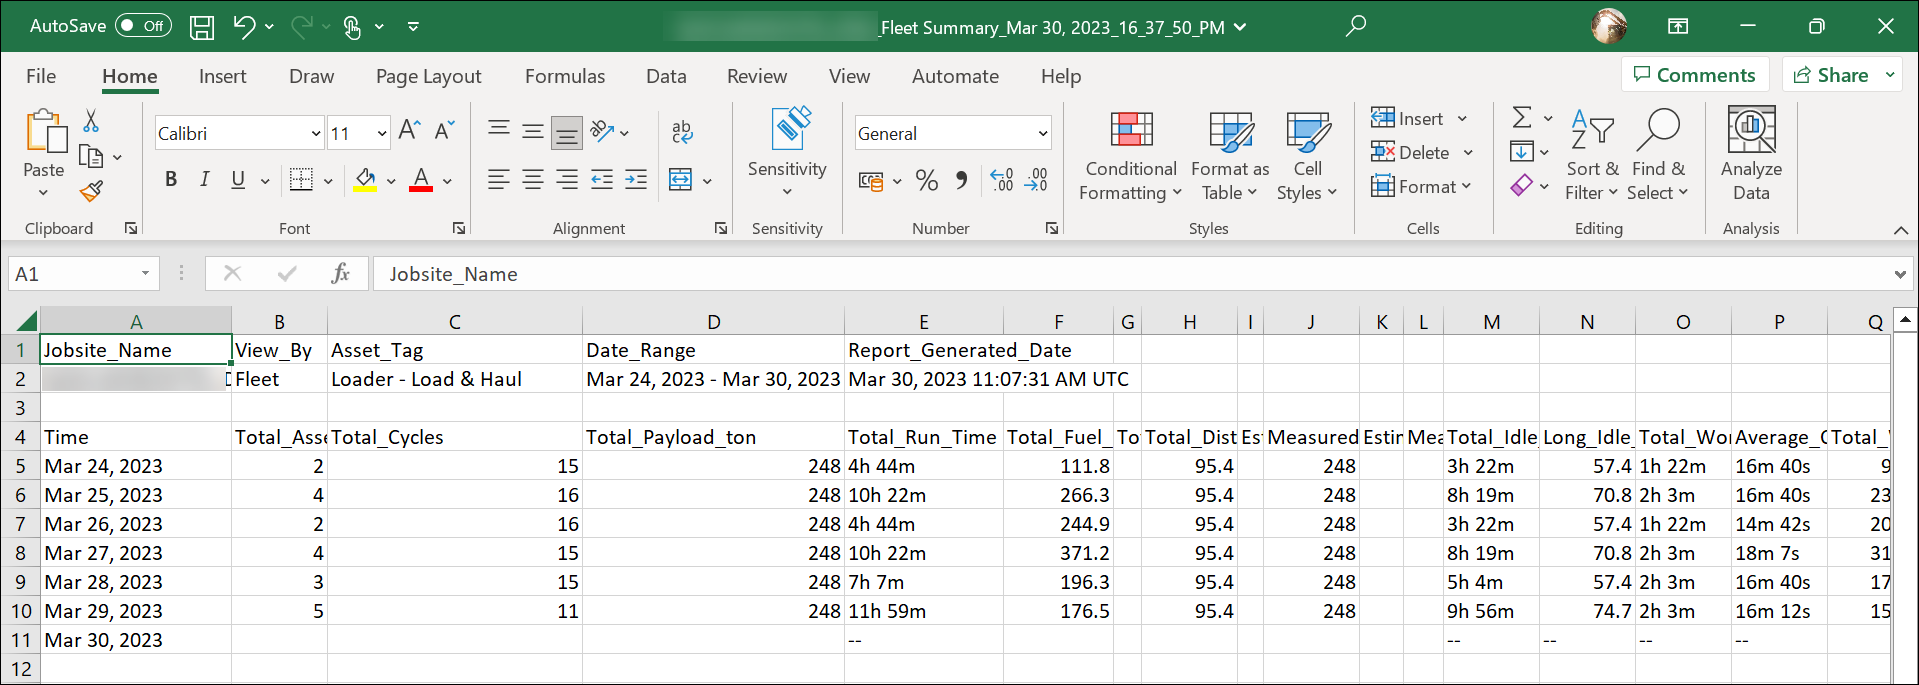
Download
 : Allows you to download asset and fleet details of site in .csv format for the selected date range. You can use this data for further analysis and share it with your team members.
Here is a sample Fleet Summary report: