November 2024
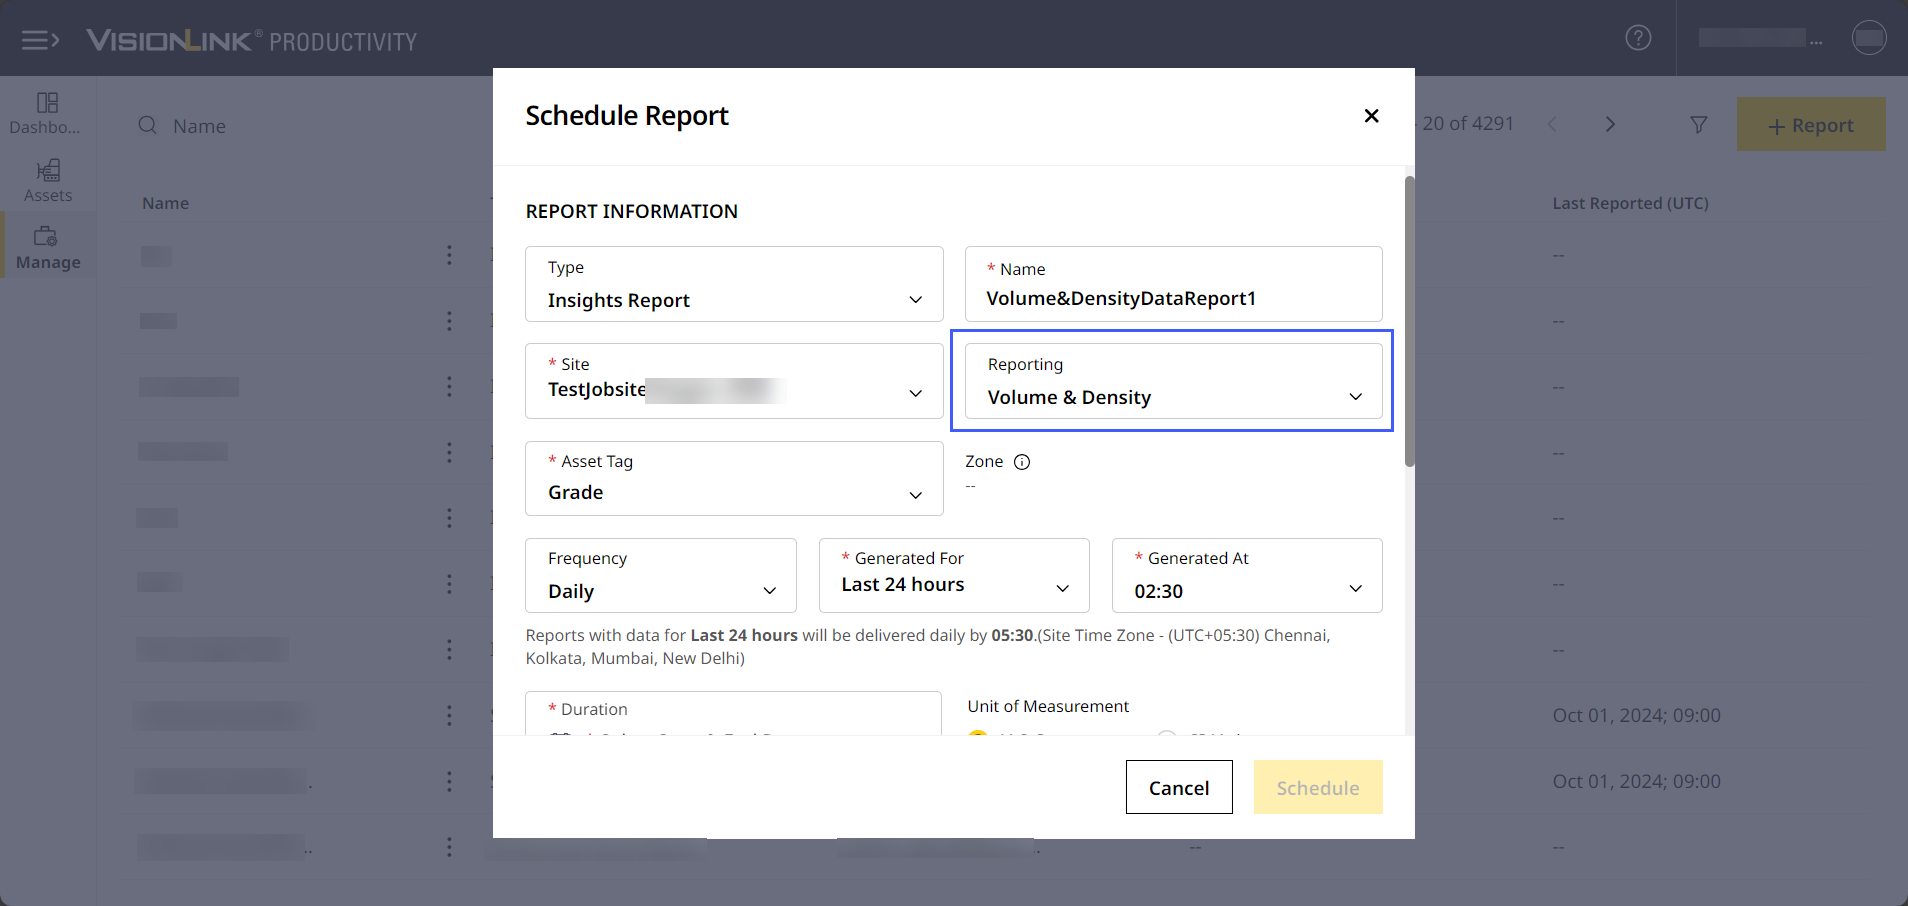
Schedule Reports for Volume and Density Data
Now, further analyze offline or share reports for your site’s volume and density data. This can be either scheduled custom zone-wise or for the entire site to obtain respective data.
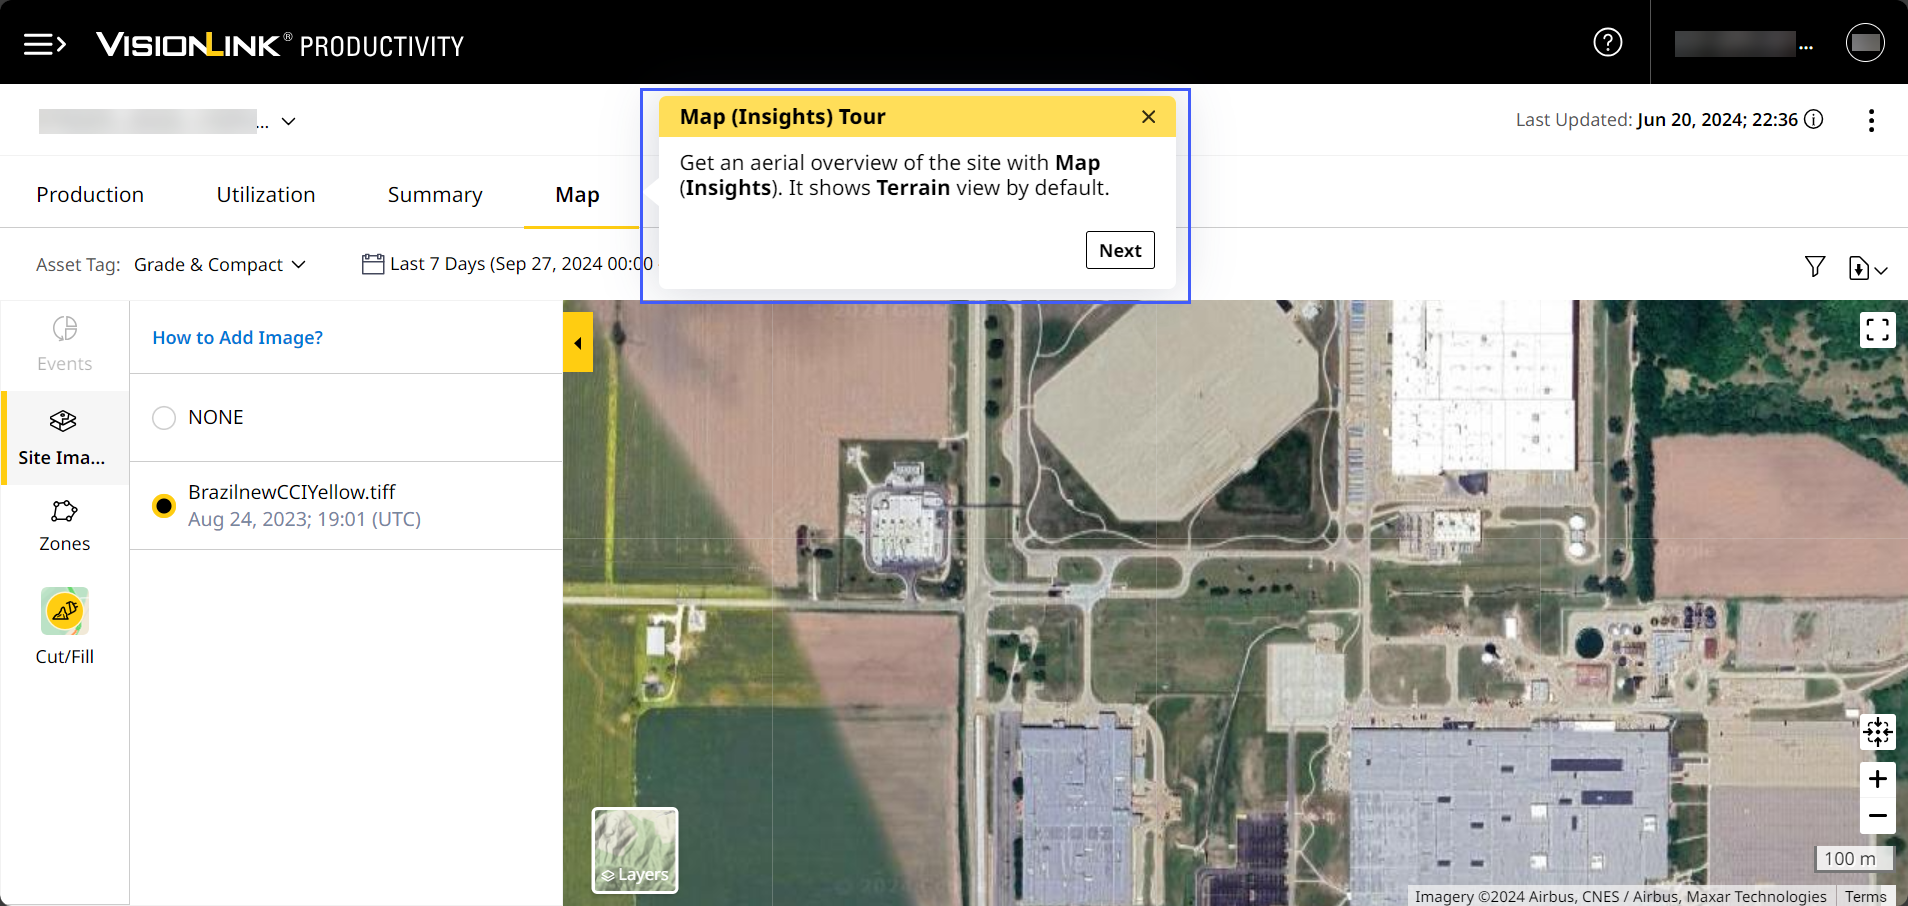
Learn All About Map (Insights) Tab with the New Guided Tour
The latest guided tour covers all you need to know about Map (Insights). This includes how to access the tab, available side panel information and different map tools and map details. Navigate to Insights > click quick help ![]() > Map (Insights) Tour to get started.
> Map (Insights) Tour to get started.
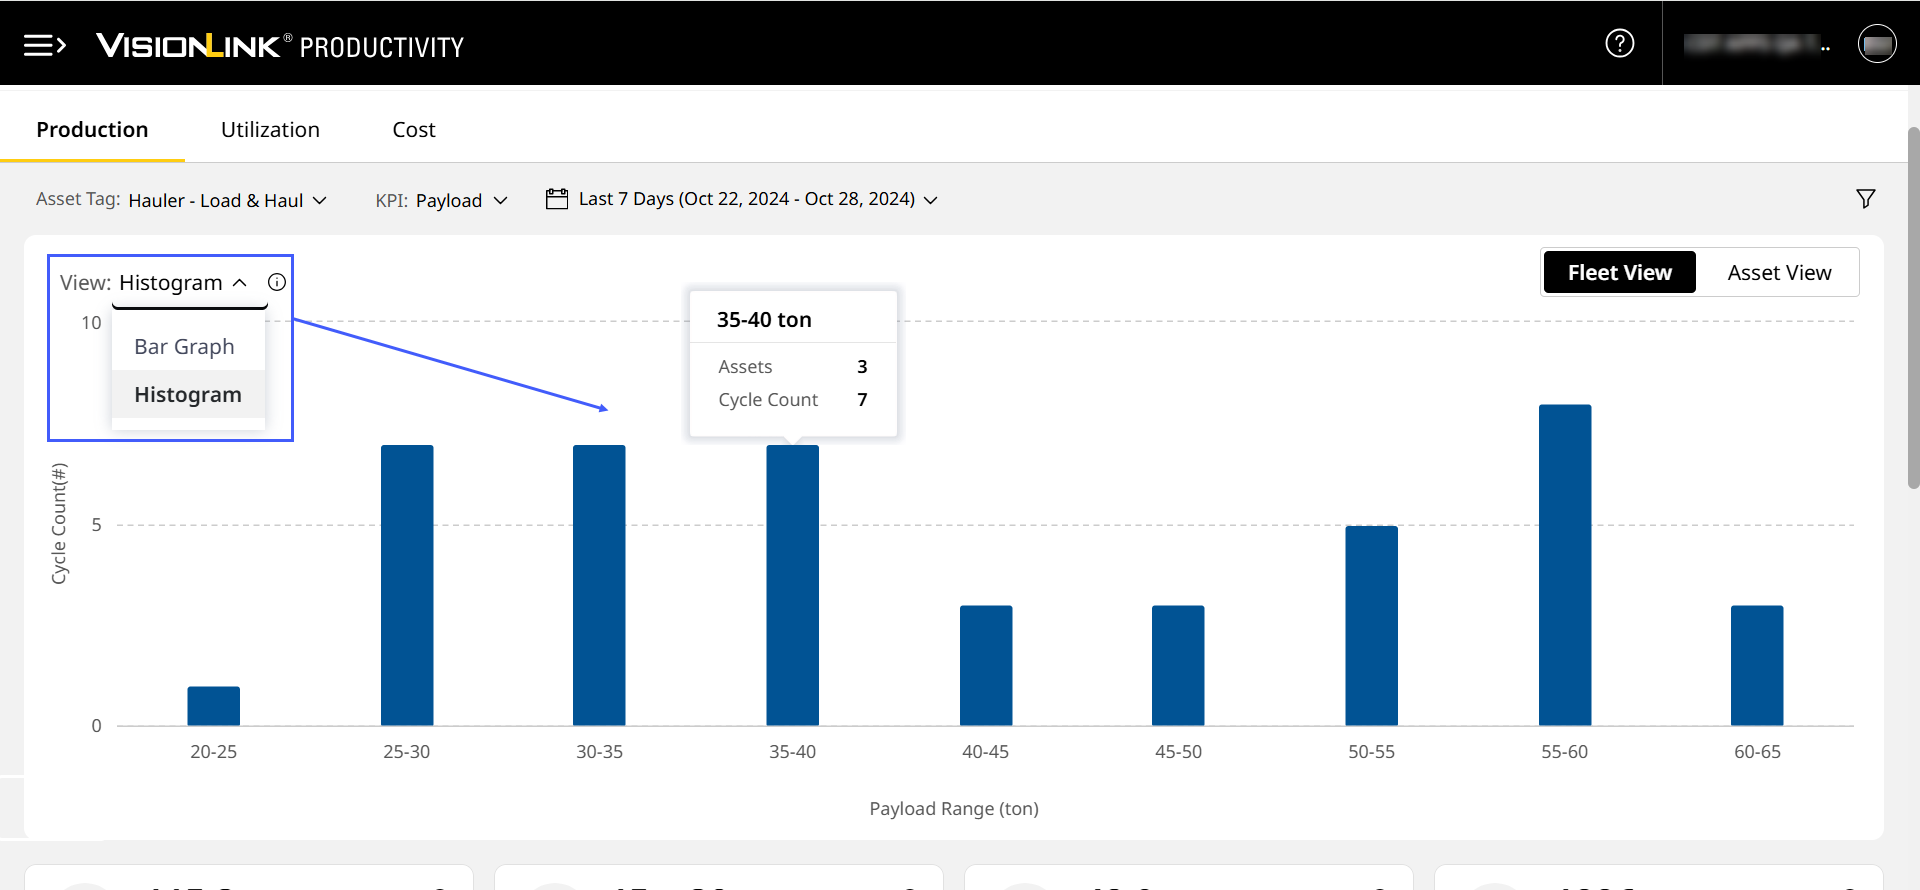
Switch to Histogram View of Your Site's Payload Data
On Production (Site), you can view the chart data as a histogram when selecting Payload KPI. Find out if (or which of) your assets are undercapacity or overcapacity. Also, uncover the range where your payload values for your fleet fall under.
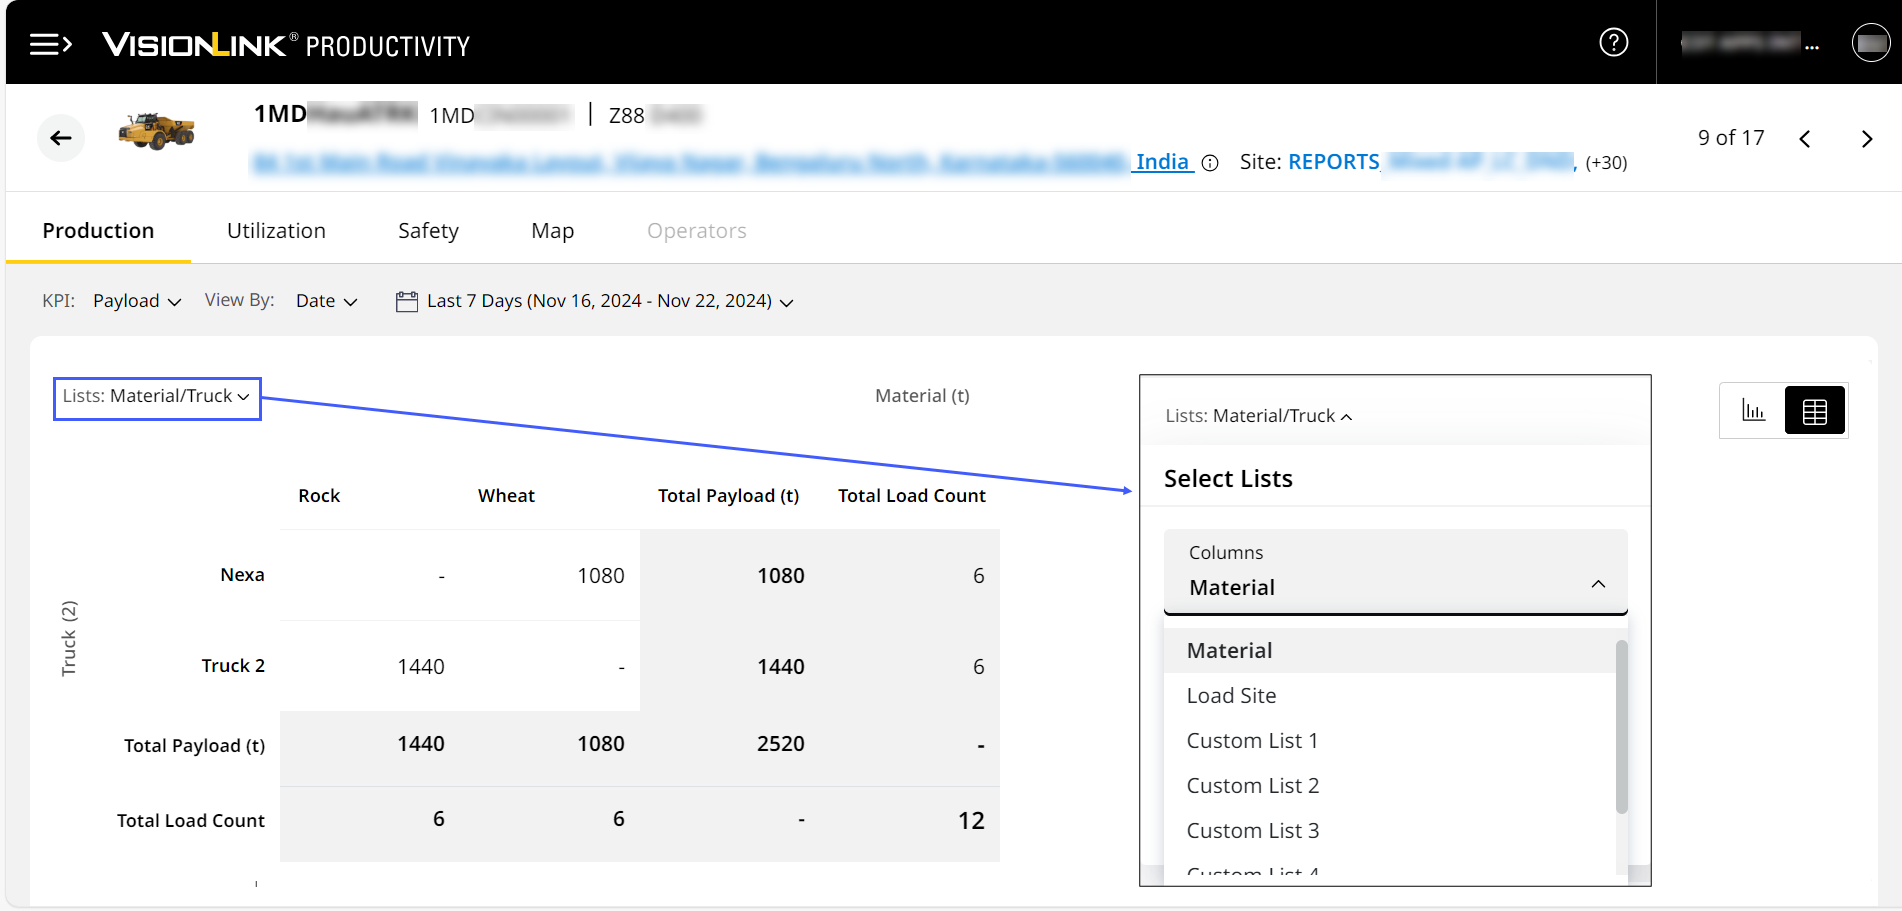
Compare an Asset's Payload Data by List Type
On Production (Asset), when selecting Payload KPI, analyze and compare the available data by list type. This displays material, truck, load site and/or custom list data in a matrix table. Quickly and easily find out if how your asset's operational payload distribution.
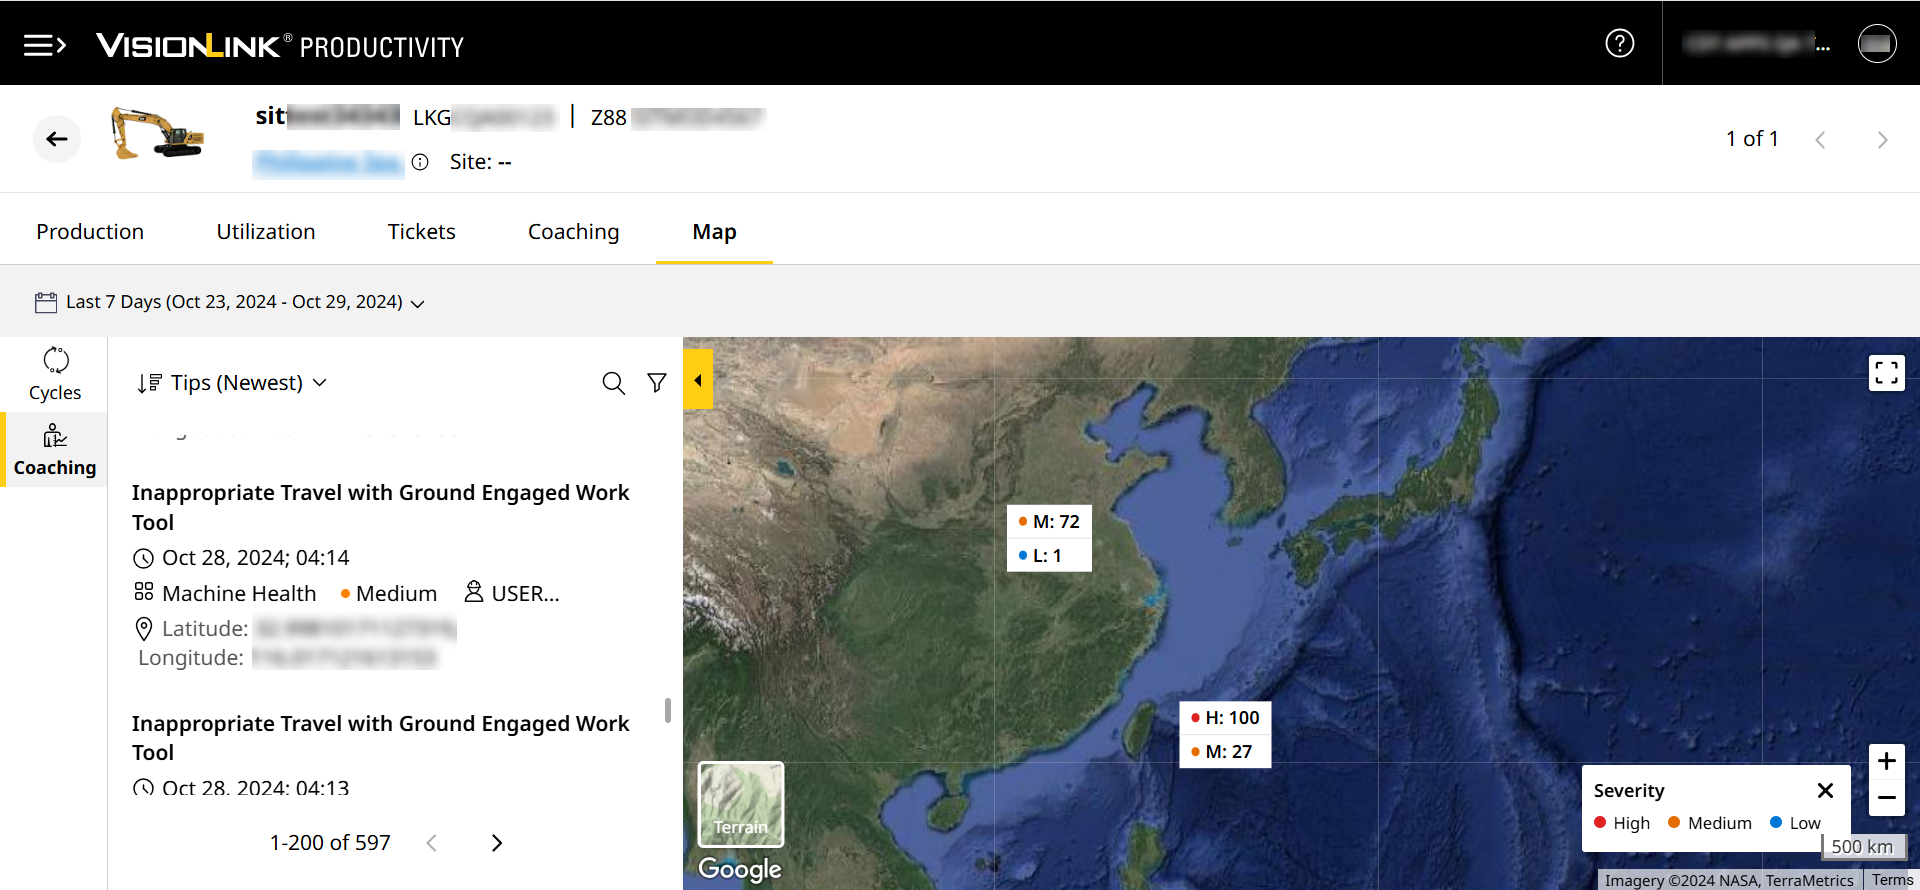
Visualize Your Asset's Cycle and Operator Details on a Map
The new Map (Asset) is available for every supported asset. View operator tip details and cycle data across time by each event on a map. Find out regions of importance and other insights to further boost your asset's performance.
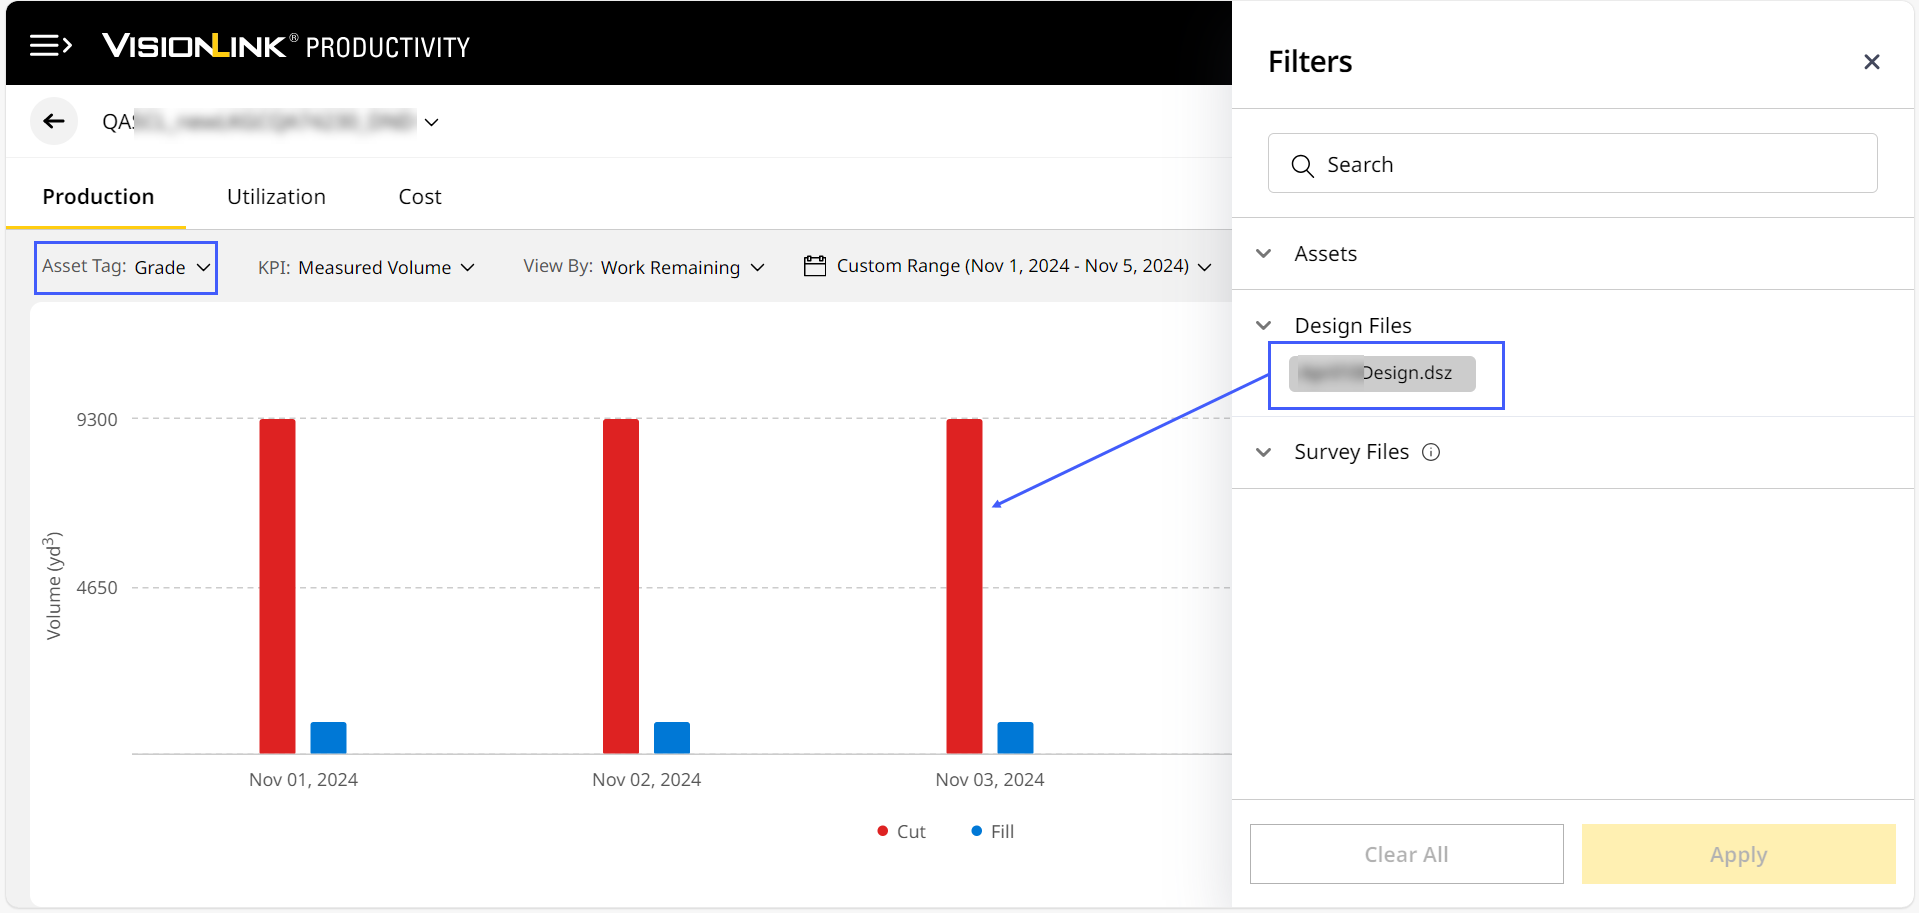
Filter and View Grade and Compact Assets
On Production (Site), after selecting Asset Tag as Grade or Compact, you can view each relevant asset on Asset List. You can also filter these assets by serial number or by file category (survey or design).
Resolved Missing Payload Details: CPI 536611
On Assets, there were instances of missing payload data for certain product families. This was caused by payload details not populating from the relevant system. The backend team fixed this by deploying a new config file to the product family.
Resolved Payload Data Mismatch Across VisionLink Productivity: CPI 540577
Payload data across Asset Production, Site Summary Production, and Payload Details reports weren't matching. This occurred due to missing data from the backend. Checks have been put into place to prevent future occurrences.
Fixed Inability to Access Site Summary and Insights Pages: CPI 548682
For a particular CWS ID alone, neither any Site Summary nor Insights tabs could be accessed. This error came up whenever date ranges were changed. The backend team corrected this issue by increasing the service plan.
Rectified Missing Daily Cycle Count Data: CPI 548263
For certain assets on certain dates, the cycle count data wasn't visible. This was caused by a temporary server restart. The backend fix restored the data and added alerts to flag future server outages in similar scenarios.
Resolved Incorrect Language Discrepancy: CPI 550715
When selecting Portuguese (Brazil) under Preferences, the language displayed in certain instances were Polish. This was due to a backend error which has now been fixed.
Fixed Asset ID Not Displaying on Audit Logs: CPI 550777
On Audit Logs, certain asset IDs weren't displaying even though available on other VisionLink Productivity pages. The backend team modified the database to ensure all Asset ID data (old and new) will display as expected.
Rectified Unavailability of Cut Distance/Fuel KPI Data: CPI 550942
On Production (Asset) for cold planers, cut distance/fuel KPI values weren't displaying. This occurred when distances were zero or close to zero. The backend fix now displays the KPI values in chart and table view.
Remedied Missing Cycles Issue for Non-Cat Assets: CPI 550947
For many non-Cat assets, there were difficulties in finding cycle details on the application. This was caused by issues with event logic and prioritization, which the backend team fixed. Cycles data is now displaying as expected.
Resolved Sign In Error: CPI 552733
Due to the presence of special characters in the CWS ID, certain users were unable to sign into the application. This has now been fixed, with special characters supported.