- + jobsite
- acceptable use policy
- account
- add user
- android
- answer
- april 2020
- archive
- asset tags
- assets
- assign schedule
- august 2020
- august 2021
- august 2022
- Average
- body up switch
- browser
- carbon footprint
- card error
- change KPI
- chrome
- CO2 emitted
- cookie
- copy site
- copyright
- cost kpi
- cost setup
- cost tab
- create
- currency
- custom list
- cut/fill
- dashboard
- december 2019
- december 2020
- december 2021
- delete site
- delete user
- digital offering
- dollar
- edit site
- edit targets
- edit user
- euro
- exemption
- FAQ
- favorite
- february 2020
- fill/dump
- filter
- firefox
- fleet
- frequently asked questions
- geofence
- getting started
- grid
- guide
- help
- ID
- insights reports
- introduction
- ios
- january 2020
- january 2021
- january 2022
- july 2020
- june 2022
- KPI
- KPI hierarchy
- landing page
- legal
- list
- list summary views
- load site
- login
- logout
- machine
- map tab
- march 2021
- march 2022
- material
- material list
- may 2020
- may 2021
- may 2022
- measurement
- more option
- november 2021
- october 2020
- october 2021
- october 2022
- overview
- playback view
- policy
- preferences
- primary KPI
- production tab
- productivity
- productivity insights
- question
- remove site
- renminbi
- report management
- report type
- restore site
- review
- safari
- schedule
- select assets
- september 2020
- set name and location
- shift
- shift comparison report
- step 1
- step 2
- step 3
- step 4
- step 5
- stockpile
- summary tab
- support
- telematics
- total cost
- user
- visionlink
- walkthrough
- zones
March 2023
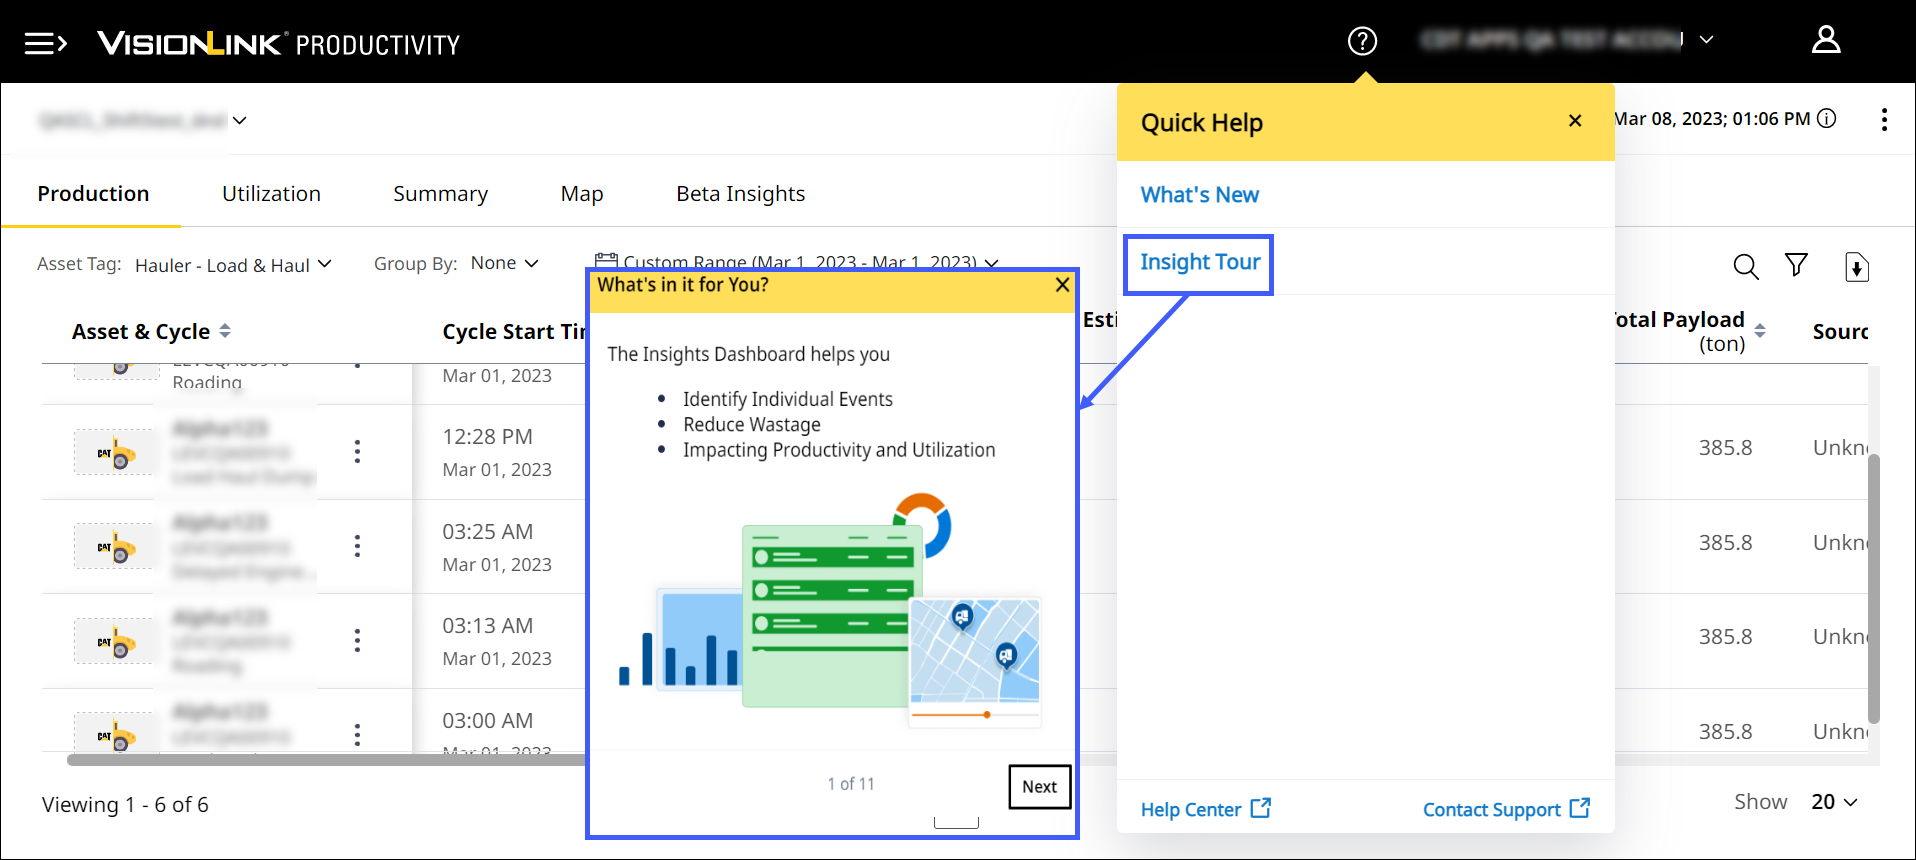
Introducing Insights Walkthrough
Guided walkthrough is now available for Insights. Navigate Production (Insights), Utilization (Insights), Summary (Insights) and Map (Insights) with step-by-step instructions. Master how to perform the following tasks easily:
-
View playback and cycle details.
-
Filter, search and download required data.
-
Select asset tags and group cycles by date.
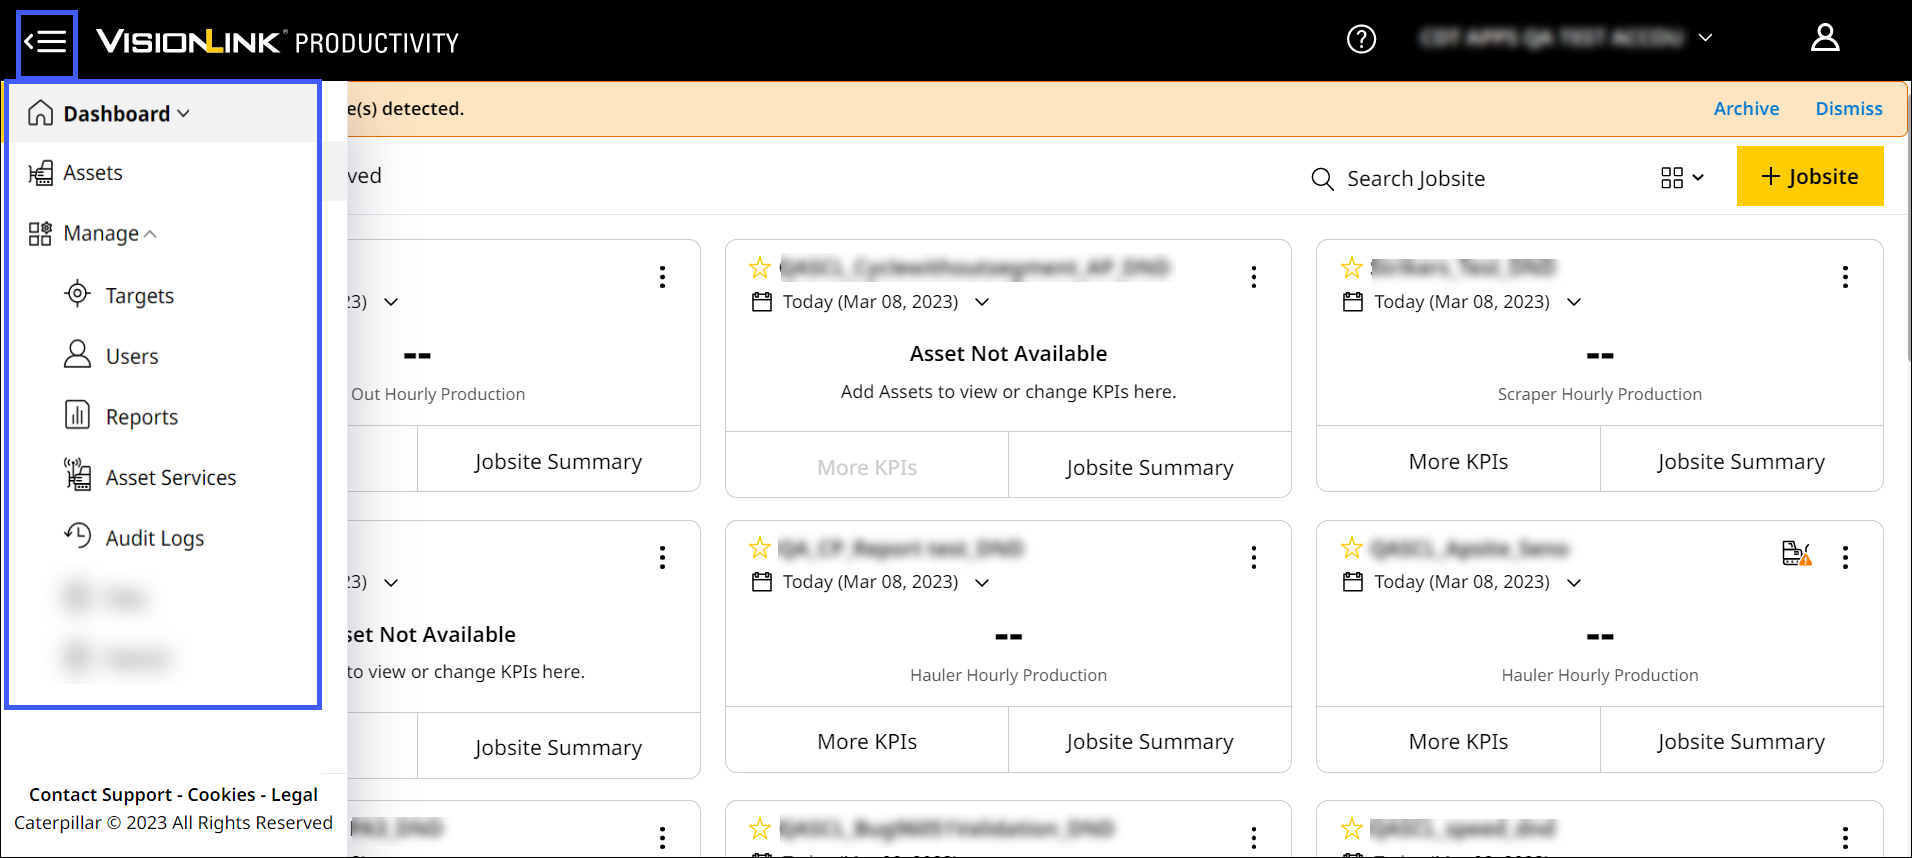
New Left-Hand Menu for All VisionLink Productivity Tabs
Switch between Dashboard, Assets and Managefrom the left-hand side. Frees up more space to track and view your site data.
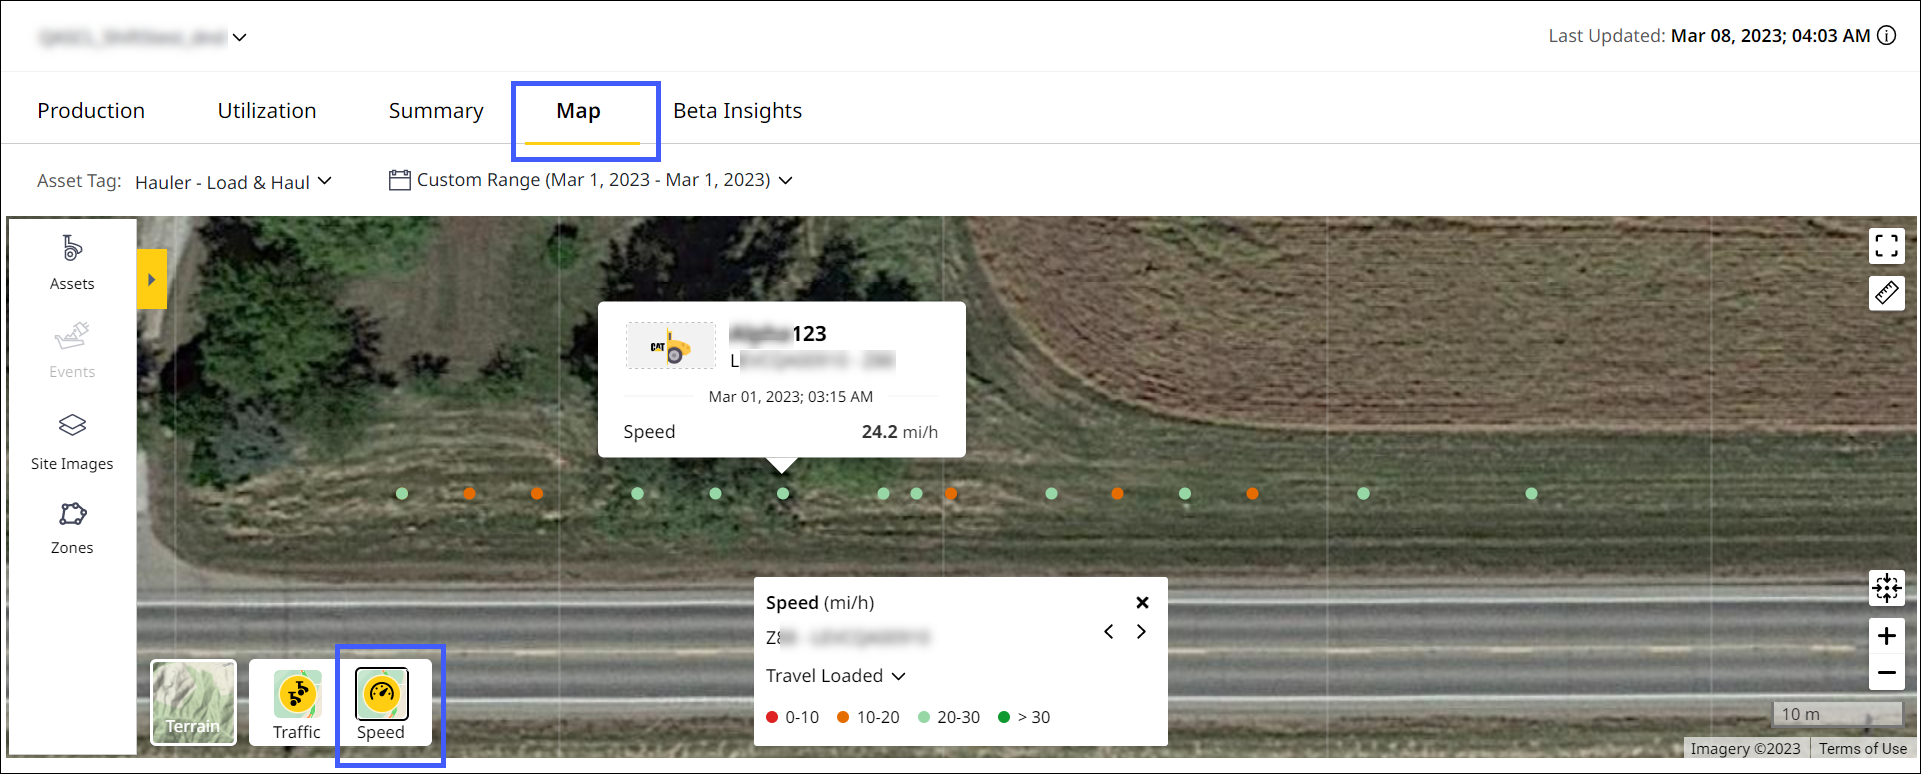
The Need for Speed: View Speed KPI on Map (Insights)
Stay up-to-date on your assets' speed using the Map (Insights). Applicable only for haulers and scrapers, and only for a single day.
View Shift Data Across KPIs on Production (Site) Tab
Find out how your site is performing during each shift in map, chart and tabular view. Learn how shifts impact utilization, production, asset metrics, and more.
Rectified Delay in Showing Cycle Data: CPI 512143 (Special Instructions)
Site Summary currently displays cycle data within an hour, excluding communication delay in extreme cases. If the delay exceeds an hour, it will be captured by the backend team and investigated further.
Resolved Incorrect Hauler Long Idle Location Issue - CPI 522205
The backend team has fixed the issue where two incorrect plotted locations were displayed for the same cycle within Map (Insights) view and Insights Utilization Zones column. The hauler long idle event now reflects accurately across both tabs.