Summary View Options in Fleet View
Click Fleet View from the ![]() toggle on Site Summary to switch from the default Asset View.
toggle on Site Summary to switch from the default Asset View.
Here, you can view data for all your site's assets in tabular format, sorted by asset tag, KPI, and/or date range.
Fleet View KPIs include:
-
Load Count: Number of cycles conducted by the assets.
-
Payload: Total weight of materials measured by the assets.
-
Estimated Volume: Volume of material moved by the assets.

• Depending on the asset tags selected, the KPI values displayed in the Fleet View may vary.
• For instance, Payload KPI values displayed for Hauler - Load & Haul and Loader - Load & Haul asset tags in a day are different. The KPI will identify the payload measured by assets in that specific asset tag, frequently loaders will perform work without a hauler (feeding crusher, stockpiling, etc.) which will lead the KPI to differ between the asset tags.

Download Fleet View data by clicking download ![]() for further analysis and to share with others.
for further analysis and to share with others.
-
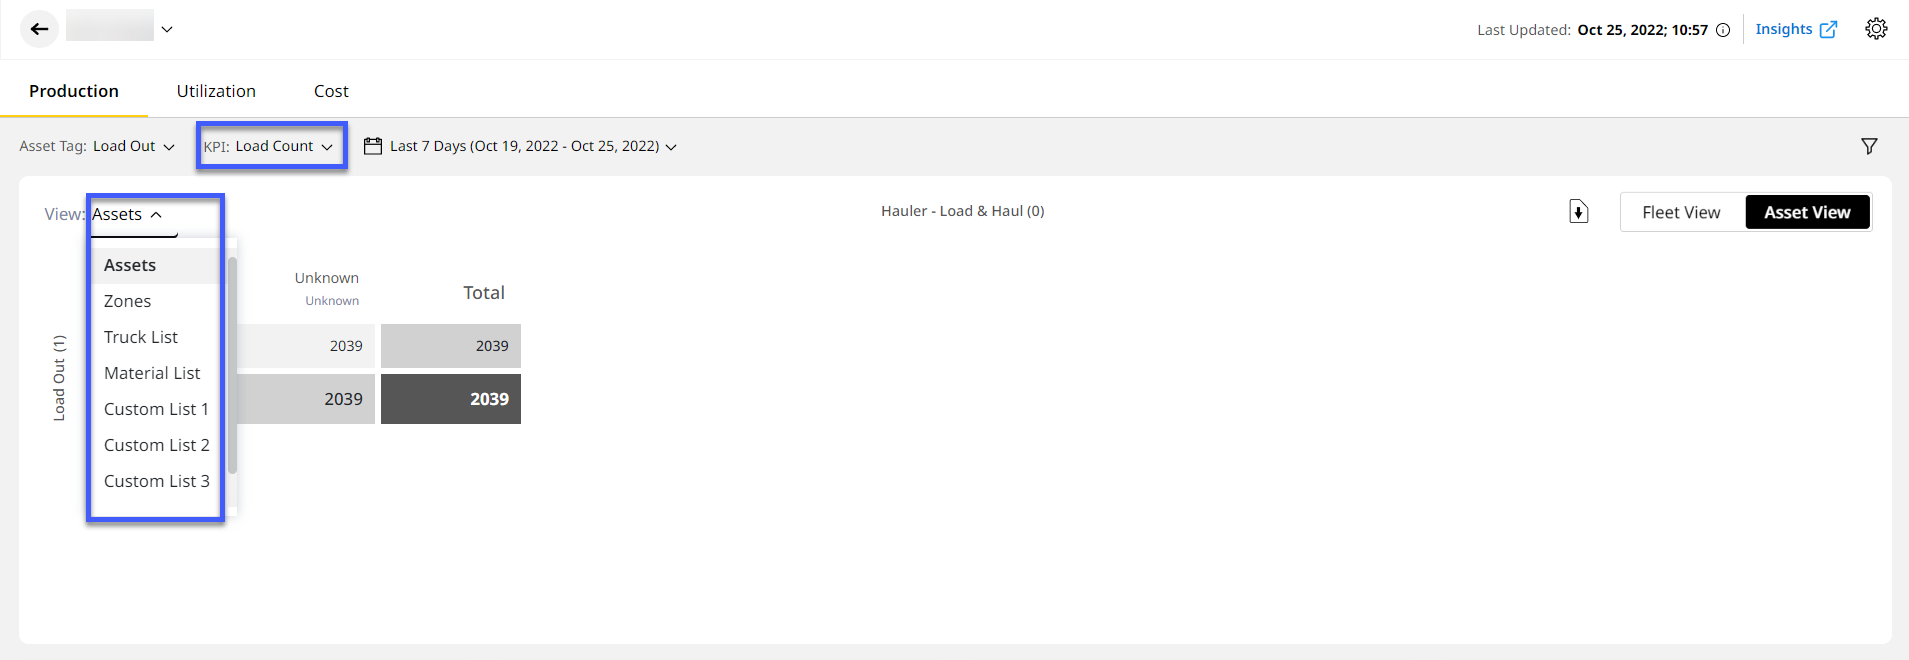
Load Count
This Fleet View table displays Load Count metrics, that covers the assets' cycle counts.
These metrics will display depending on the List Summary View selection:
-
Assets: Displays Load Count metrics between loaders and haulers.
-
Zones: Displays Total Load Count between a source and destination, such as Load to Dump zones.
-
Truck List: Displays Load Count and Total Truck Count for respective loader and load out trucks.
-
Material List: Displays Material Load Count and Total Truck Count data for respective hauler, loader and load out trucks.
-
Custom List: Displays Material Load Count and Total Truck Count data for respective hauler, loader and load out trucks.
-
-
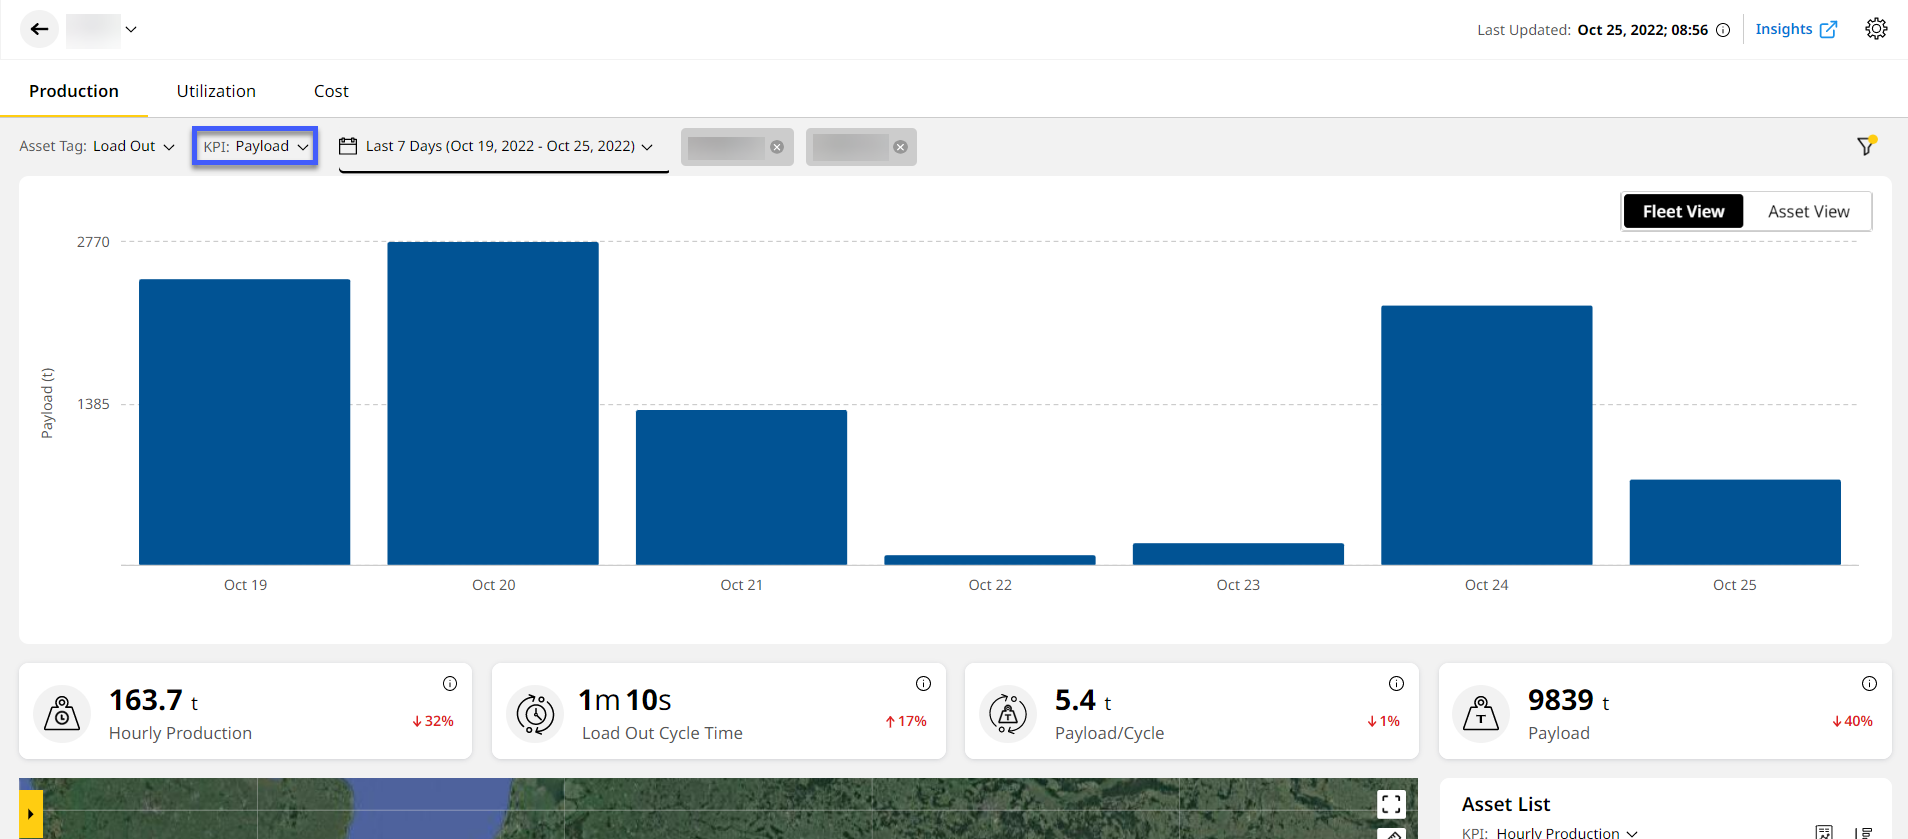
Payload
Displays Payload metrics as a table. This measures the total material weight moved by the assets.
The values in the x-axis and y-axis change depending on the selected List Summary View option:
-
Assets: Displays Payload metrics between site's loaders and haulers.
-
Zones: Displays Total Payload between a source and destination, such as Load to Dump zones.
-
Material List: Displays material Payload data for respective hauler, loader and load out trucks.
-
Custom List: Displays custom lists with supporting payload data for loader and load out assets.
-
-
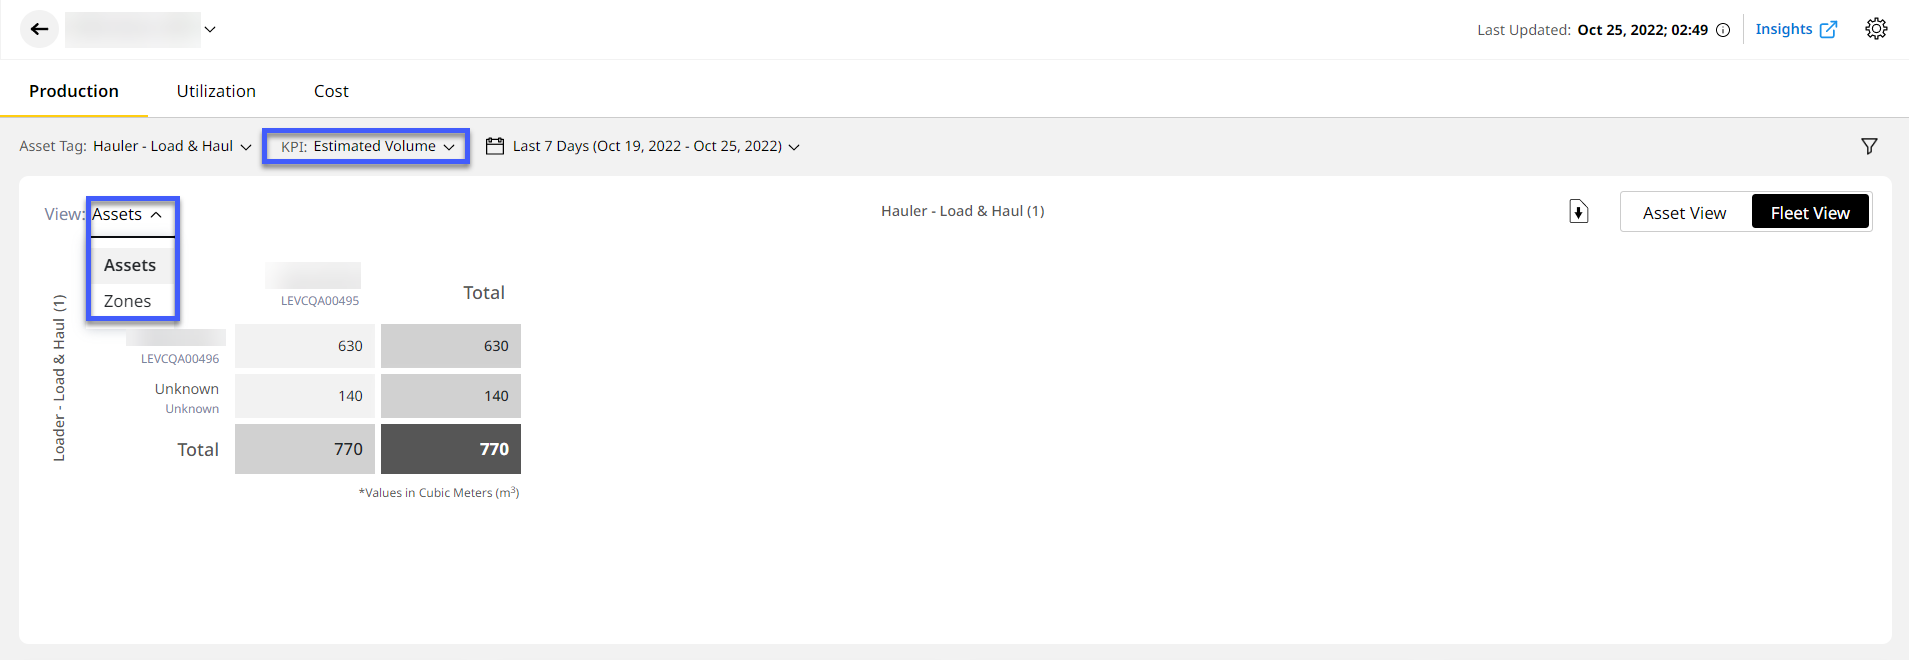
Estimated Volume
Displays Estimated Volume metrics as a table, measuring the volume moved by assets.
The values in the x-axis and y-axis change depending on selected List Summary View option.
If shifts are created and scheduled for a site, you can filter the data based on it by clicking
 .
.
-
Assets: Displays Estimated Volume metrics for assets based on selected asset tags.
-
Zones: Displays Estimated Volume metrics between a source and destination, such as Load to Dump zones.
-
Material List: Displays material Estimated Volume data for respective hauler and scraper assets.
-