Map View
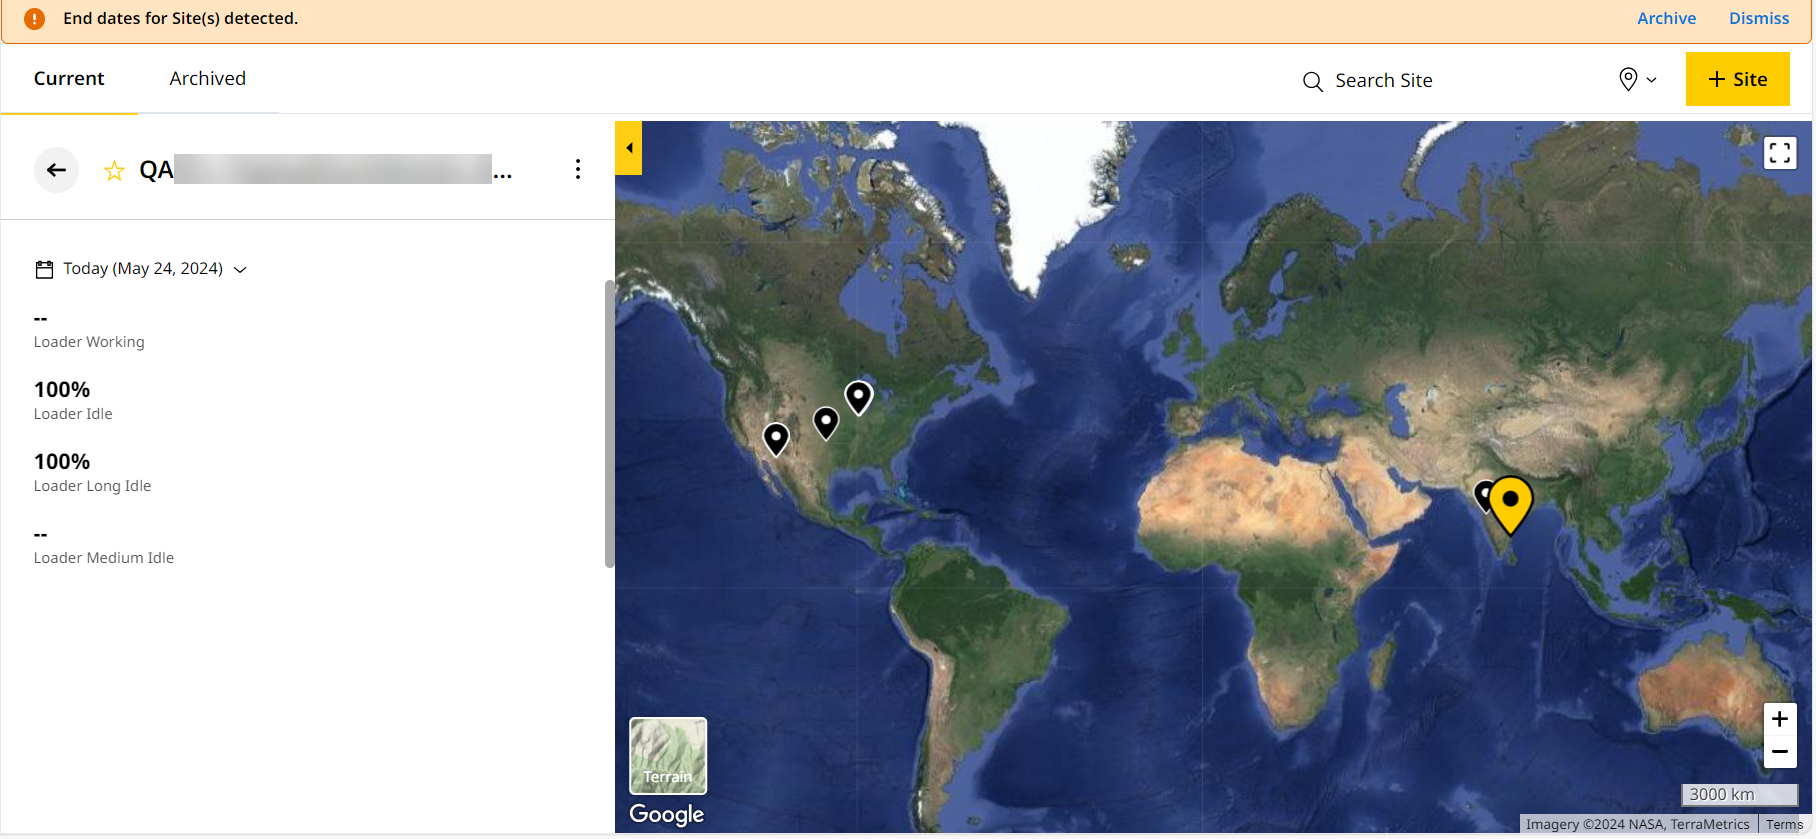
Visualize and analyze site details based on its pinned geographic location with Map View.
Especially helpful if you have several sites spread across a large geographic area. You can interact with these areas via their respective location.
To enable map view:
-
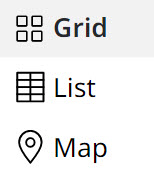
Switch views using grid
 or list
  . Select Map
  .
.
-
This displays all site cards in map view.

View sites along with total number of tons over the last seven days on the left side. Find the respective location pinned on the map on the right.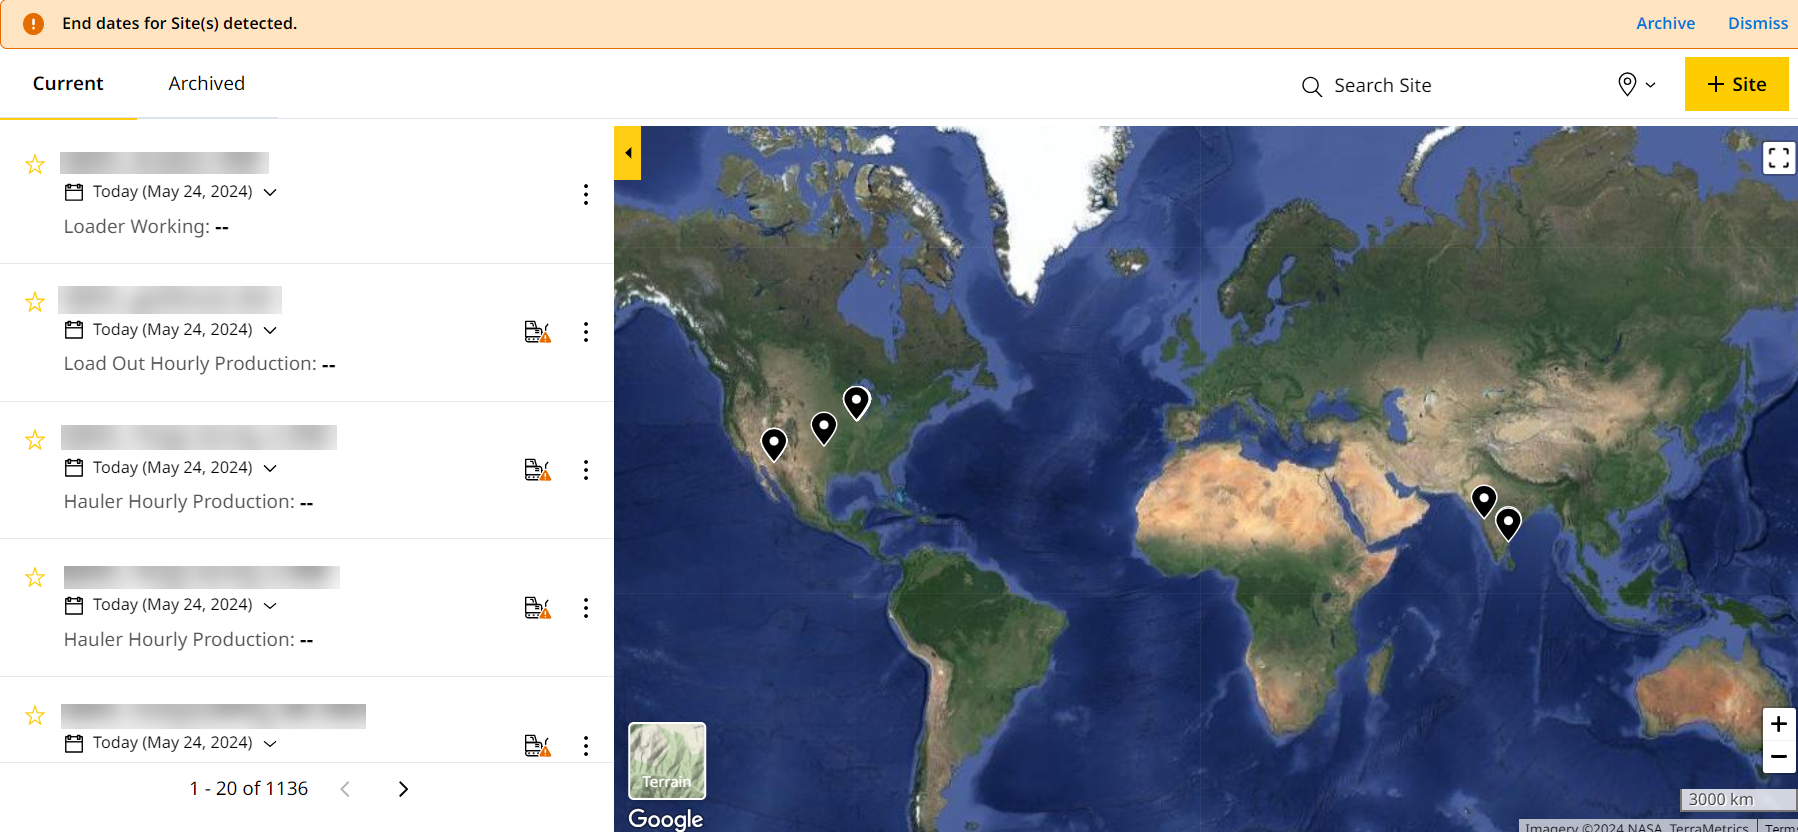
-
The following table lists out the Map view icons and their functions.
Items
Features
Description

Zoom In
Zoom in the map to view the site’s location. 
Zoom Out
Zoom out the map to view the site’s location. 
Satellite
View the map in satellite mode. 
Terrain
View the map in terrain mode. 
Full Screen
Expand the entire map view screen. 
Slider
Expand or collapse the site details on the left. -
Hover over the location pin
 on the map to view the respective site name, industry type and total number of tons over the last seven days.
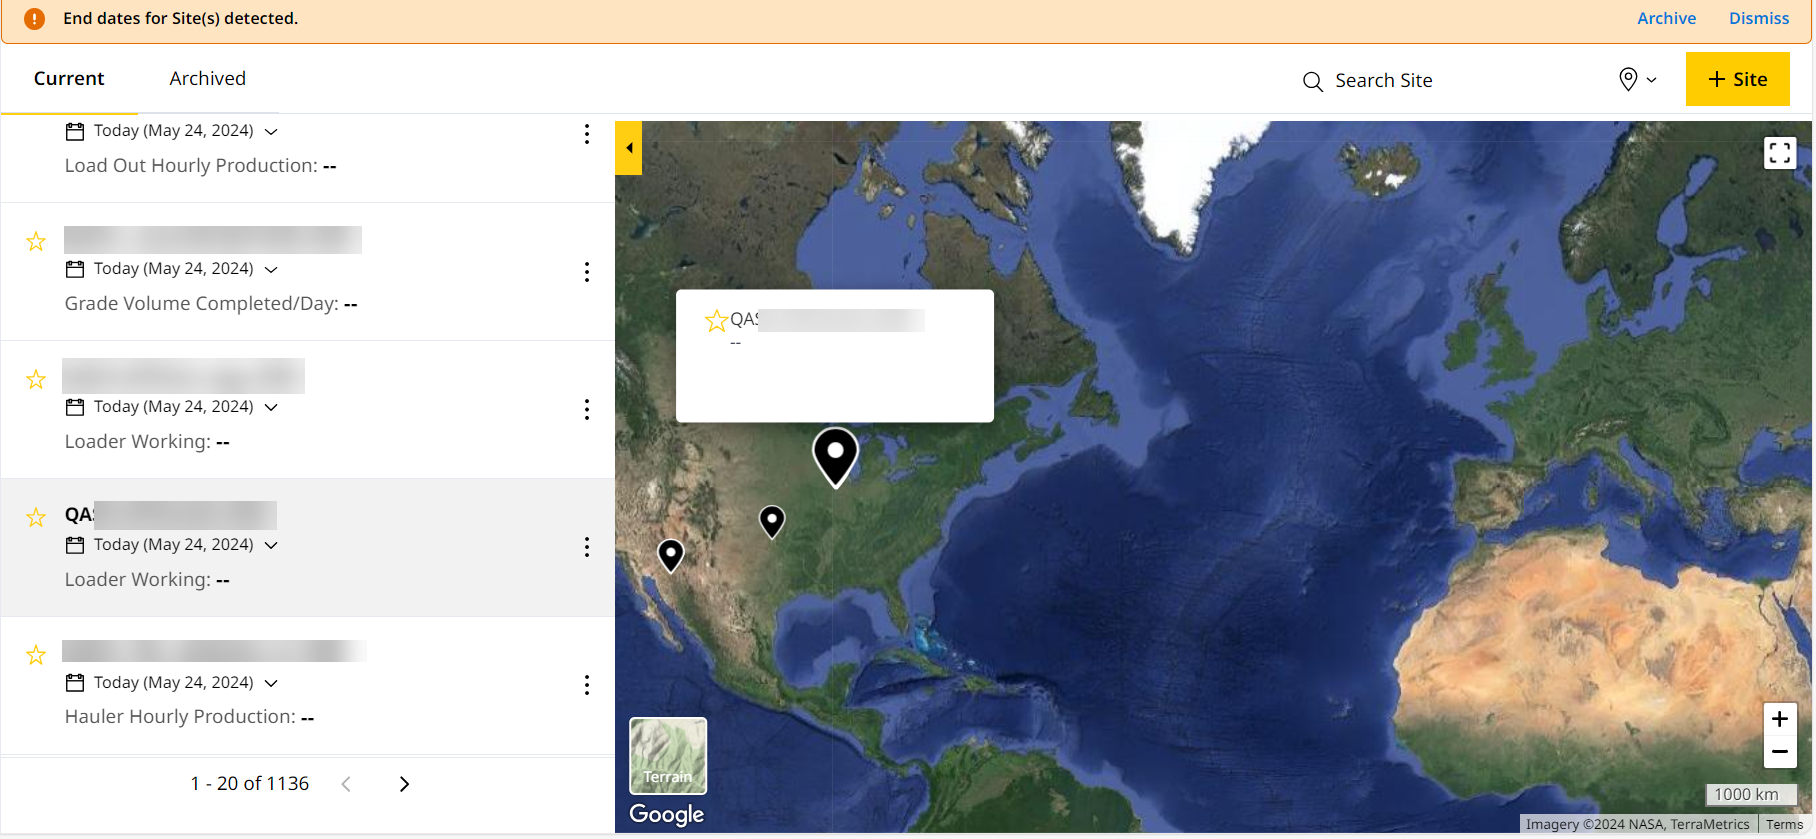
When you hover over a location pin, it expands on the map and the highlights the respective site on the left side. -
Select the location pin
on the map to view the site details on the left.
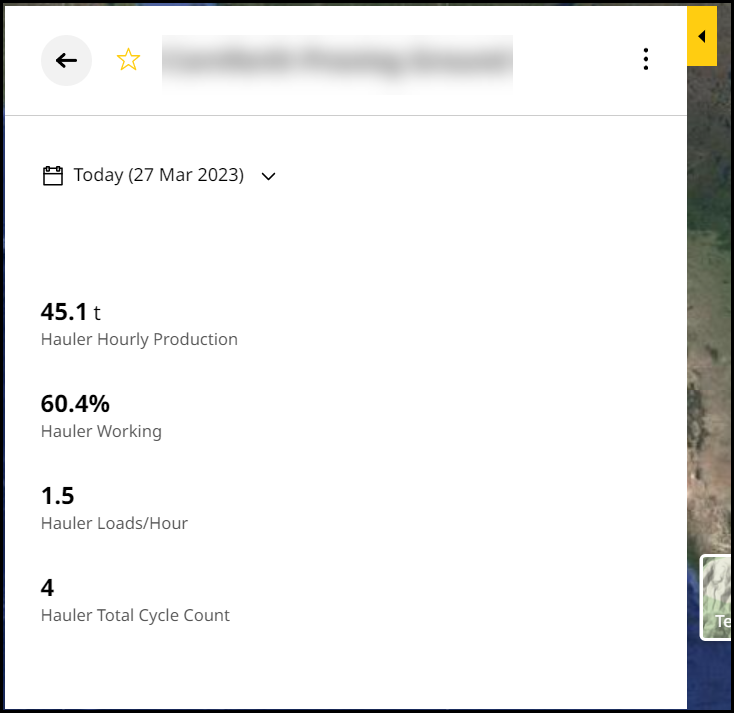
• Each site lists overall production and utilization percentage, cycles/hour, total number of assets available in the site.
• You can also select the data for today, yesterday and last seven days in the same row. -
Click more options
 against a site to see More KPIs and more options for sites.
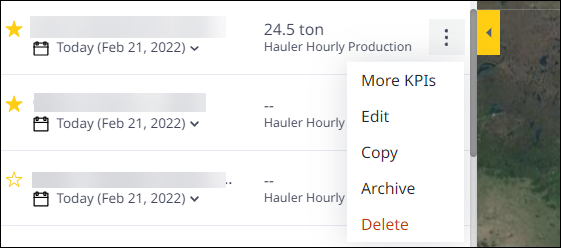
Use More KPIs to view additional KPIs set using Change KPI, within the side panel.
View ImageView Image