Production Volume and Density
Volume and Density data allows you to further analyze the performance of your grade and compact assets on a site for the selected date range. Click the desired toggle ![]() to switch and view.
to switch and view.
Volume
Displays data as a bar graph and shows volume of grade or compact completed in a site. Hover over the bars on the graph to learn specific details of Compact and Fill Volume.
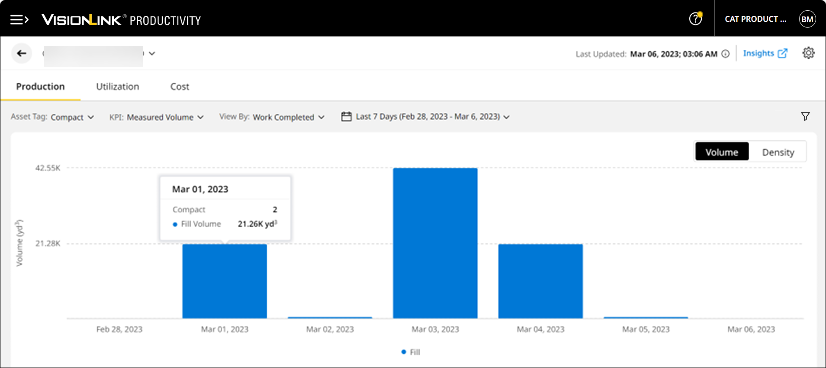
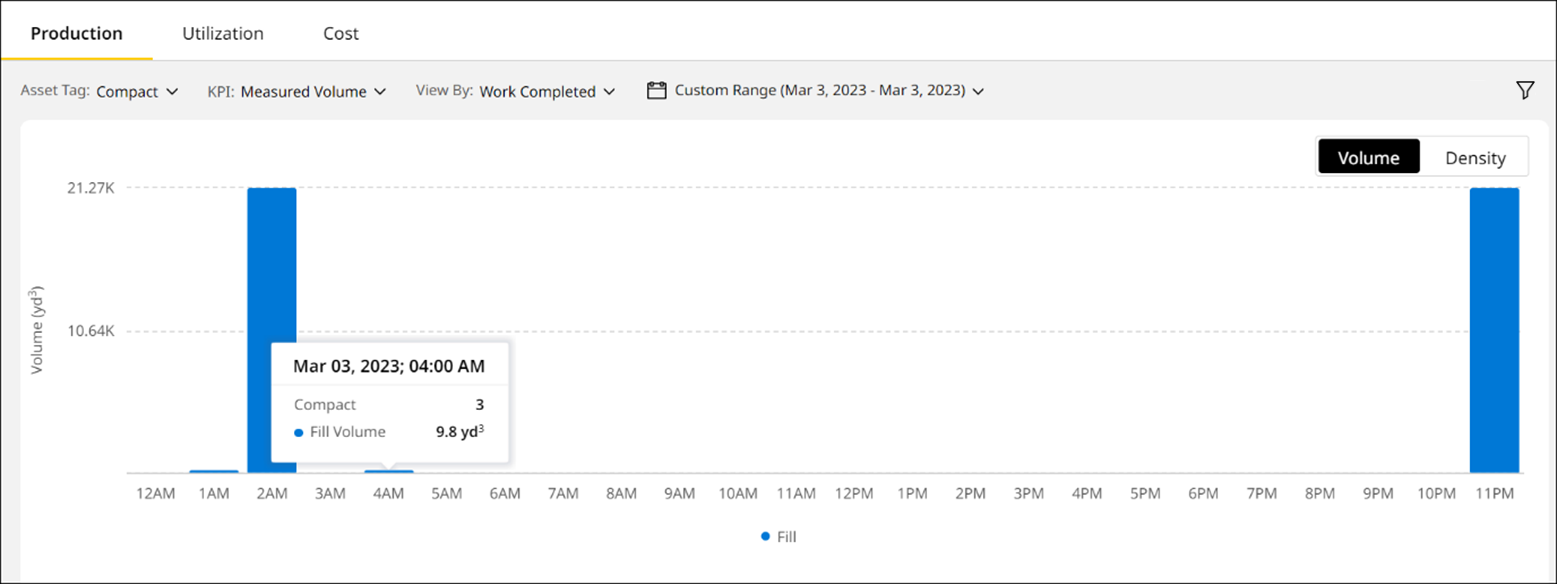
You can also view hourly data by clicking on a specific date.
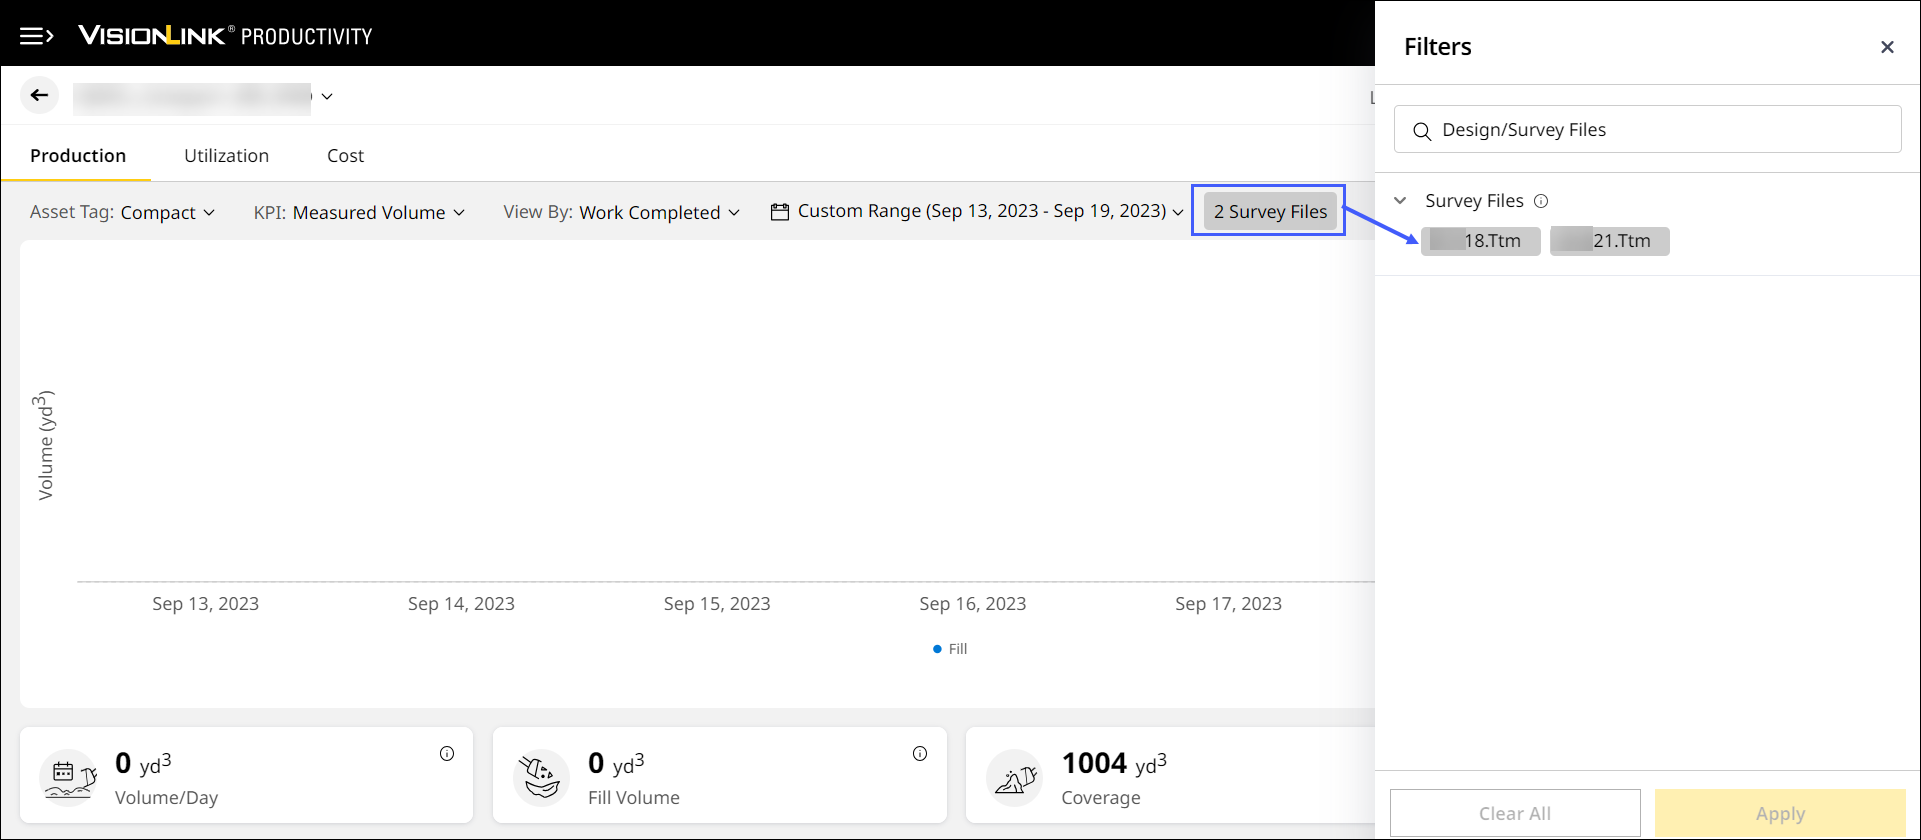
If survey (.ttm) files are uploaded for volume calculation, the file count appears as chip next to date range. Click to view file details under Filters.
Density
Displays data as a bar graph and shows density of compact completed in a site. Hover over the bars in the graph to learn specific Compact and Density details.
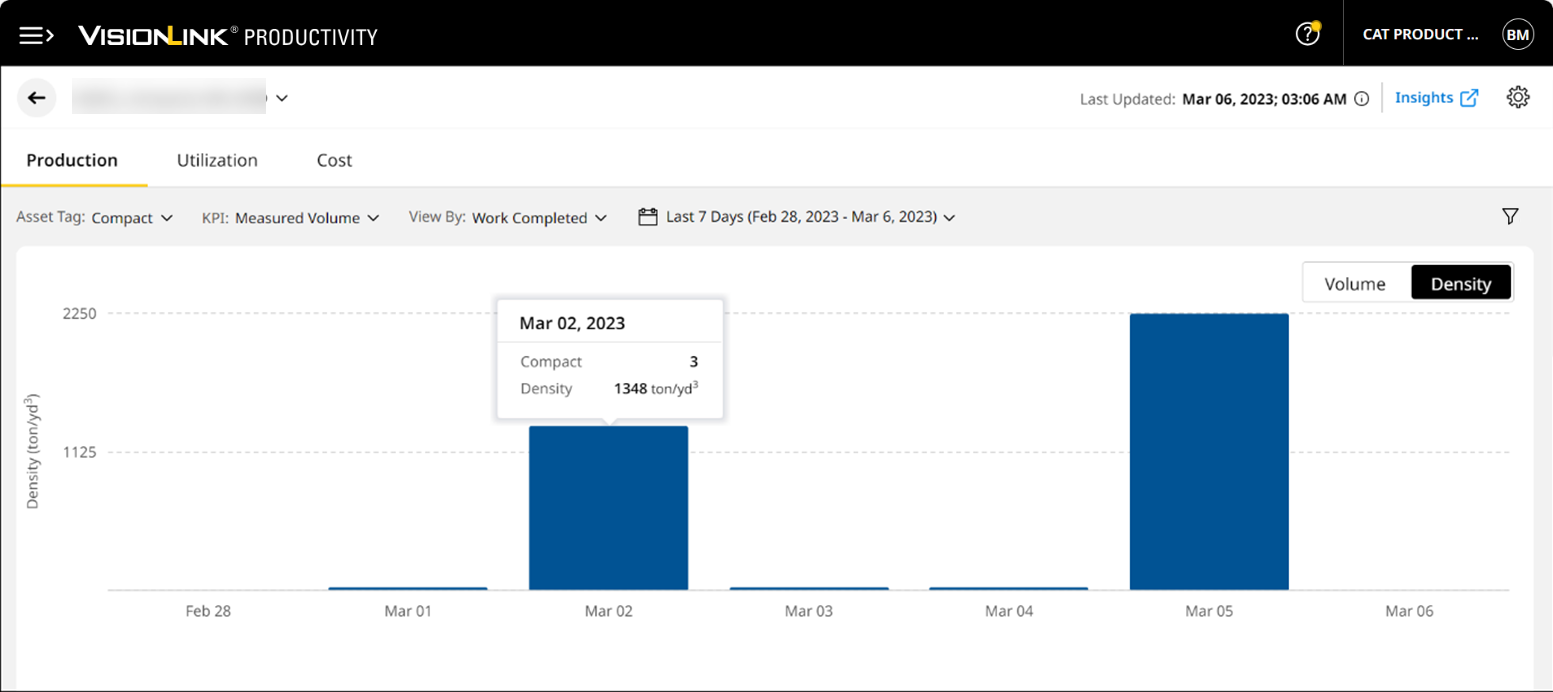

• You can view density data only if weight values are added to calculate compaction density. Refer to Manage Weights to learn more about adding or editing weights.